
Analysis :
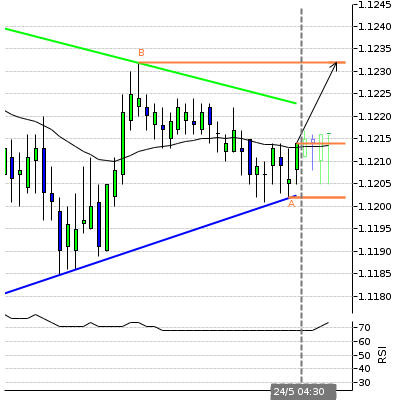
Triangle identified at 24-May-04:30 2016 GMT. This pattern is still in the process of forming. Possible bullish price movement towards the resistance 1.123 within the next 6 hours.
Supporting Indicators :
Upward sloping Moving Average
Resistance Levels :
( B ) 1.1232Last resistance turning point of Triangle.
Support Levels
( A ) 1.1202Last support turning point of Triangle.


![[EURUSD]: Weekly Liquidity Activation Points (LAP), October 12-16, 2026](https://c.mql5.com/6/1035/splash-preview-777305.png "[EURUSD]: Weekly Liquidity Activation Points (LAP), October 12-16, 2026")
![[Nasdaq]: Weekly Liquidity Activation Points (LAP), October 12-16, 2026](https://c.mql5.com/6/1035/splash-preview-777311.png "[Nasdaq]: Weekly Liquidity Activation Points (LAP), October 12-16, 2026")
![[DAX]: Weekly Liquidity Activation Points (LAP), October 12-16, 2026](https://c.mql5.com/6/1035/splash-preview-777313.png "[DAX]: Weekly Liquidity Activation Points (LAP), October 12-16, 2026")