Analysis :
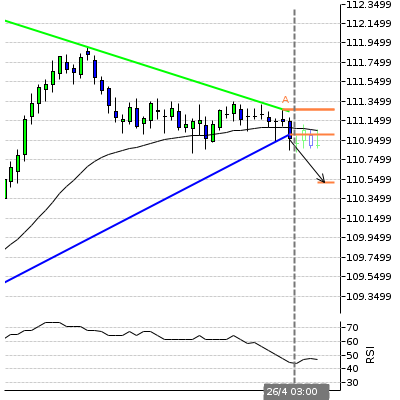
Triangle has broken through the support line at 26-Apr-03:00 2016 GMT. Possible bearish price movement forecast for the next 15 hours towards 110.515.
Supporting Indicators :
Downward sloping Moving Average
Resistance Levels :
( A ) 111.27Last resistance turning point of Triangle.