DAX30: Indicators Give Buy Signals
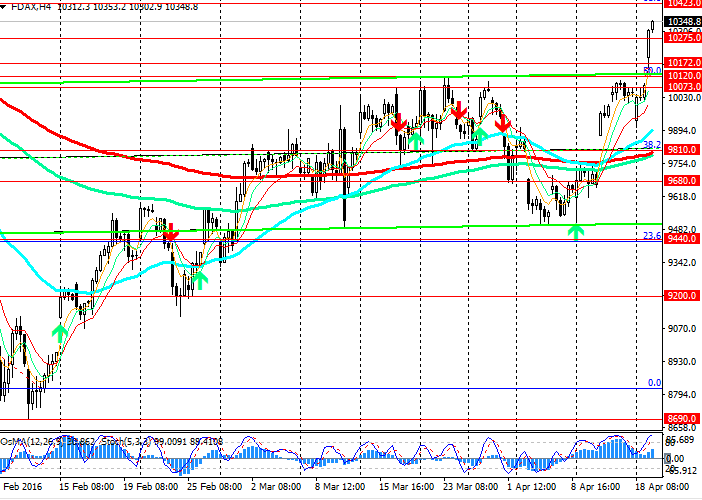
On the hourly, daily, weekly and 4-hour charts the indicators OsMA and Stochastic recommend to open long positions.
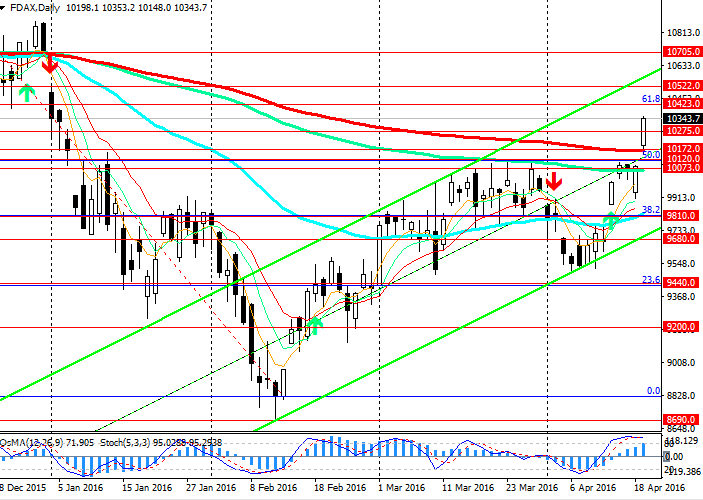
The price has regained half of the losses sustained from December 2015 and beginning of 2016 when the world stock markets collapsed after the Chinese stock market.
On the daily chart the price has broken out important resistance levels of 10120.0 (Fibonacci 50%) and 10172.0 (ЕМА200). At the moment the price is going up to 10423.0 (Fibonacci 61.8% to the wave of decline since 1 December 2015 to the level of 11410.0).
This week, market participants will focus attention on the interest rate decision of the ECB and a press-conference of the Bank president, Mr. Draghi, which is scheduled for 21 April.
Positive statements by Mario Draghi will trigger upward movement in the European indices.
In this case the nearest target of the index DAX30 will be the levels of 10423.0, 10522.0 (lows of November 2015 and the upper limit of the ascending channel on the daily chart).
An alternative scenario assumes that the pair can go back below the levels of 10172.0, 10120.0 and 10073.0 (ЕМА144 on the daily chart). Consolidation of the price below support level of 9810.0 (ЕМА50 on the daily chart and Fibonacci 38.2%) may bring the index back to the downtrend, close to the lows of September 2014 at the level of 8300.0.
Support levels: 10172.0, 10120.0 and 10073.0.
Resistance levels: 10423.0 and 10522.0.

Trading tips
Buy Stop: 10355.0. Stop-Loss: 10270.0. Take-Profit: 10423.0, 10522.0 and 10705.0.
Sell Stop: 10200.0. Stop-Loss: 10275.0. Take-Profit: 10170.0, 10120.0, 10075.0, 10000.0, 9900.0 and 9700.0.


