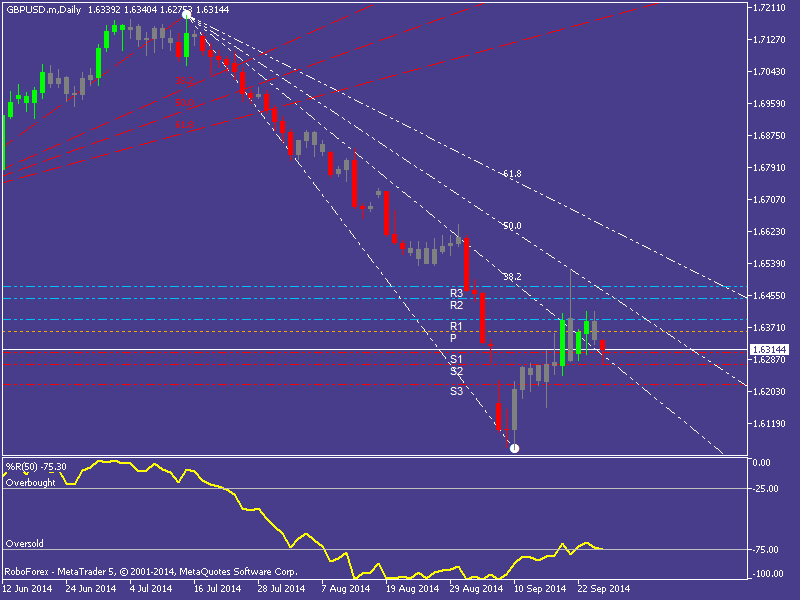
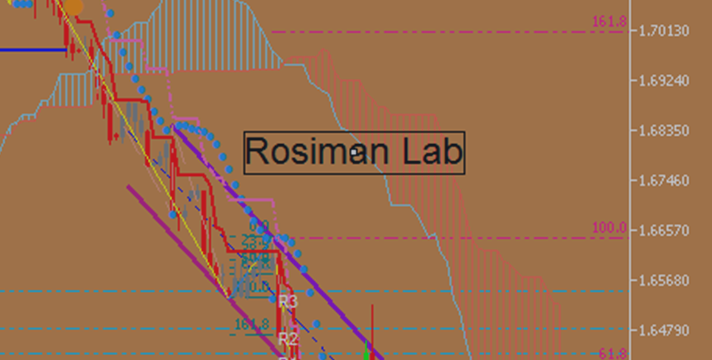
Primary Trend: Bearish (see FIBO white lines)
Secondary Trend : Bullish but with a current candle color Red (possible change inside bearish in closing bar)
Volumes : on the Oversold border (it could enter the zone on closing bar)
Suggestion: if price breaks down S2 and FIBO 38.2 in closing bar we may see a continuation of Primary bearish trend. So is possible to enter short. If not we may see a continuation of the Primary Trend pullback maybe till R1,R2 or FIBO 50. Enter long only once price break up R3 and FIBO 50 for a new Bull Primary Trend.
Warning: what will happen to prices no one can know, that belongs to the future.
Good Luck!


