Market is often compared to a thermodynamic system that jumps from one state to another, and the states are effective price levels where price action reveals underlying concentration of open interest. Many traders, especially on the Forex, prefer to analyze price action to discover the levels of market power. Today I'll show you how this can be done with a help of several indicators.
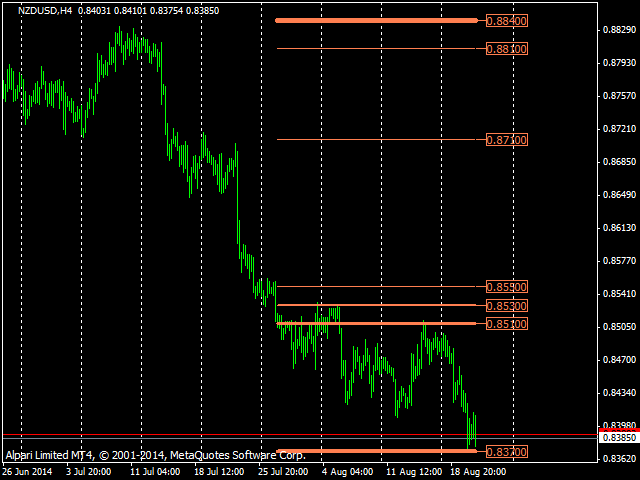
The first indicator of the review is most simple one. It does a job which traders usually do themselves, looking back to quotes history and finding higher highs and lower lows as they move from the current moment to the past. ImportantLevels achieves this automatically and displays levels, where price reversals formed next unbeaten highs and lows. Each level's strength is proportional to number of times the price changes direction near the level, and corresponding reversals ages (more recent reversals are more important).

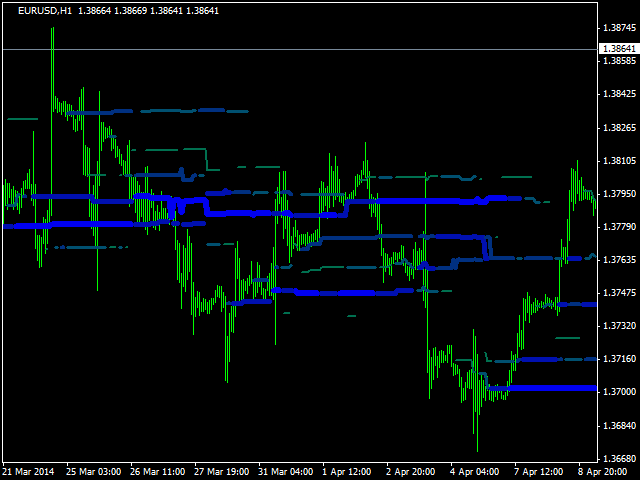
A slightly similar yet distinctive indicator I'd like to mention is EvoLevels. It looks up existing history of quotes and extracts most "frequent" price levels, that is levels, which act as attractors for the price. In other words, the price crosses these levels or "touches" their neigbourhood many times.

From this description you may think this somewhat resembles a well-known Market Profile indicator and you'll be right. There are 2 important differences between Market Profile and EvoLevels though:
- EvoLevels is continuously calculated using a sliding window of predefined number of bars, that is distirbution of levels changes on every bar; Market Profile is usually calculated on per day basis, and price distribution keeps its form stable intraday, then "jumps" between days;
- EvoLevels shows only up to 8, most important levels; MarketProfile shows a complete distribution of prices (a bell shape), uncluding the majority of low importance;
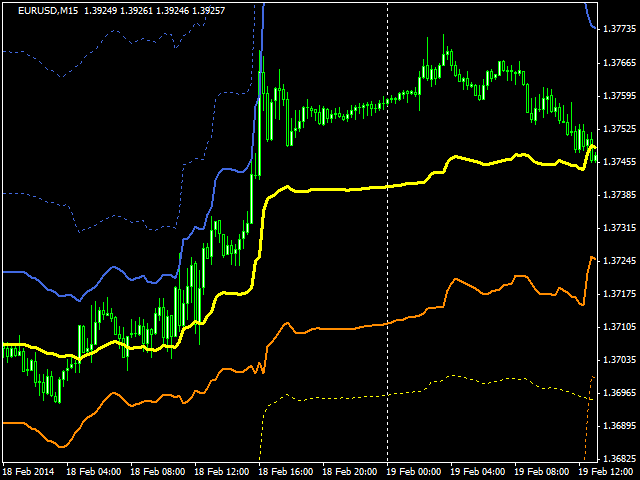
The next indicator is ExtraMovingPivots. Everybody knows the formulae for dayly or weekly pivot points, resistance and support levels. We'll not discuss the effectiveness of these levels here, just take it for granted that many traders trust them. Classical pivot points are calculated per day (or week) basis and does not change intraday. But wait - the Forex is a global market and every hour may start a day in some time-zone. This means that pivots could or should be updated more frequently - even for timeframes less than daily. This is exactly what ExtraMovingPivots does. The indicator uses a sliding window of bars, that form daily period (for example, 24 bars for H1), and calculates new pivot levels on the window for every intraday bar.

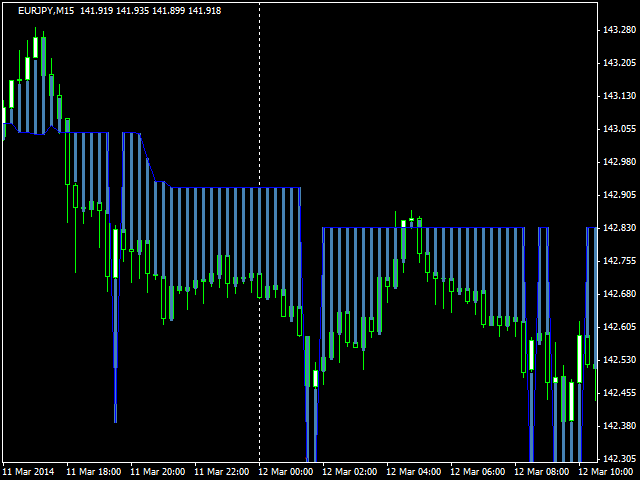
Finally, let us recall multi-currency nature of the Forex ;-). If you wonder how one could forget about this, I probably need to explain what I mean. Usually, most of traders tend to analyze every single symbol on its own, so the picture is two-currency, not multi-currency. Even most of popular daily or weekly publications on technical analysis of the market are splitted by currency pairs, and only a few pay attention to related instruments/charts. Yet they may have a noticable influence. For example, while trading AUDJPY, is it conceivable to overlook extremums on AUDUSD and USDJPY majors? Apparently, they affect AUDJPY cross. And ExtraMajorLevelExtremums allows you easily find out the cross prices, where extremums from specified major pairs are mapped.

What it basically does is looking for highest and lowest major prices during a given period in near past, then calculating their products and finding one of them closest to current price of the cross. You can be sure - this level will work as support or resistance (depending from its location) not less than native support and resistance lines of the cross.


