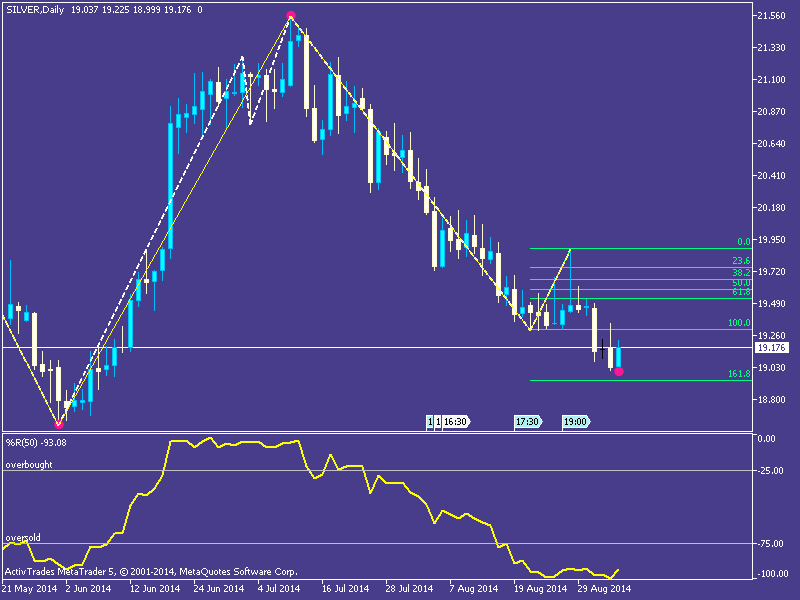
On Silver we see a similar situation of Gold.
All Indicators show the daily Downtrend and the Oscillator tells us
that price is inside an Oversold zone. Today the main point is the
formation of a new minimum "Red Dot" very close to the dinamic Fibo at 18,98.
At
the moment we know from Oscillator that is possible to enter the market
only short till price come out from the Oversold zone. If this new
minimum will be confirmed in the next bars and price moves from below to
above the -75 on oscillator we can enter long betting on a new bullish
trend. This can probably happen soon with a pull-back on Fibo 100 and
convert the bearish trend in a new bullish one.
Today recommendation is to wait new bars.
Good Luck!


