

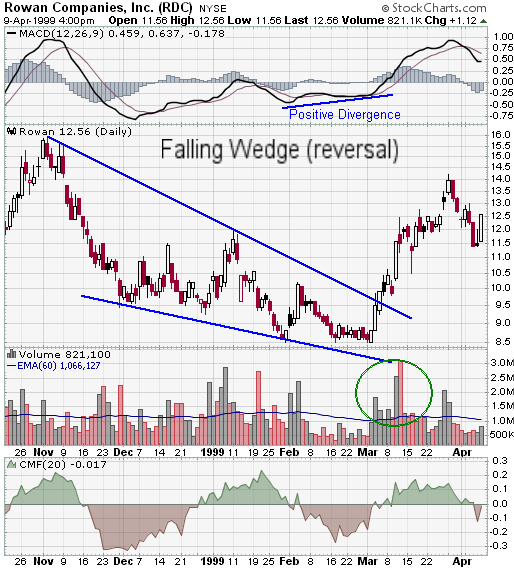
The Falling Wedge is a bullish pattern that begins wide at the top and contracts as prices move lower. However, this bullish bias cannot be realized until a resistance breakout.
- Prior Trend: To qualify as a reversal pattern, there must be a prior trend to reverse. Ideally, the falling wedge will form after an extended downtrend and mark the final low. The pattern usually forms over a 3-6 month period and the preceding downtrend should be at least 3 months old.
- Upper Resistance Line: It takes at least two reaction highs to form the upper resistance line, ideally three. Each reaction high should be lower than the previous highs.
- Lower Support Line: At least two reaction lows are required to form the lower support line. Each reaction low should be lower than the previous lows.
- Contraction: The upper resistance line and lower support line converge to form a cone as the pattern matures. The reaction lows still penetrate the previous lows, but this penetration becomes shallower. Shallower lows indicate a decrease in selling pressure and create a lower support line with less negative slope than the upper resistance line.
- Resistance Break: Bullish confirmation of the pattern does not come until the resistance line is broken in convincing fashion. It is sometimes prudent to wait for a break above the previous reaction high for further confirmation. Once resistance is broken, there can sometimes be a correction to test the newfound support level.
- Volume: While volume is not particularly important on rising wedges, it is an essential ingredient to confirm a falling wedge breakout. Without an expansion of volume, the breakout will lack conviction and be vulnerable to failure.


