Young Ho Seo / Profil
- Information
|
11+ Jahre
Erfahrung
|
62
Produkte
|
1205
Demoversionen
|
|
4
Jobs
|
0
Signale
|
0
Abonnenten
|
Harmonic Pattern Indicator - Repainting + Japanese Candlestick Pattern Scanner + Automatic Channel + Many more
https://www.mql5.com/en/market/product/4488
https://www.mql5.com/en/market/product/4475
https://algotrading-investment.com/portfolio-item/harmonic-pattern-plus/
Non Repainting and Non Lagging Harmonic Pattern Indicator – Customizable Harmonic + Japanese Candlestic Pattern Scanner + Advanced Channel + Many more
https://www.mql5.com/en/market/product/41993
https://www.mql5.com/en/market/product/41992
https://algotrading-investment.com/portfolio-item/profitable-pattern-scanner/
Supply Demand Indicator – Multiple Timeframe Scanning Added + Non Repainting + Professional Indicator
https://www.mql5.com/en/market/product/40076
https://www.mql5.com/en/market/product/40075
https://algotrading-investment.com/portfolio-item/ace-supply-demand-zone/
Momentum Indicator – Path to Volume Spread Analysis
https://www.mql5.com/en/market/product/30641
https://www.mql5.com/en/market/product/30621
https://algotrading-investment.com/portfolio-item/excessive-momentum-indicator/
Elliott Wave Indicator for the Power User
https://www.mql5.com/en/market/product/16479
https://www.mql5.com/en/market/product/16472
https://algotrading-investment.com/portfolio-item/elliott-wave-trend/
Forex Prediction - Turn Support and Resistance to the Advanced Strategy
https://www.mql5.com/en/market/product/49170
https://www.mql5.com/en/market/product/49169
https://algotrading-investment.com/portfolio-item/fractal-pattern-scanner/
MetaTrader 4 and MetaTrader 5 Product Page: https://www.mql5.com/en/users/financeengineer/seller#products
Free Forex Prediction with Fibonacci Analysis: https://algotrading-investment.com/2020/10/23/forex-prediction-with-fibonacci-analysis/
Free Harmonic Pattern Signal: https://algotrading-investment.com/2020/12/17/harmonic-pattern-signal-for-forex-market/
============================================================================================================================
Here are the trading education books. We recommend reading these books if you are a trader or investor in Forex and Stock market. In the list below, we put the easy to read book on top. Try to read the easy to read book first and try to read the harder book later to improve your trading and investment.
First Link = amazon.com, Second Link = Google Play Books, Third Link = algotrading-investment.com, Fourth Link = Google Books
Technical Analysis in Forex and Stock Market (Supply Demand Analysis and Support Resistance)
https://www.amazon.com/dp/B09L55ZK4Z
https://play.google.com/store/books/details?id=pHlMEAAAQBAJ
https://algotrading-investment.com/portfolio-item/technical-analysis-in-forex-and-stock-market/
https://books.google.co.kr/books/about?id=pHlMEAAAQBAJ
Science Of Support, Resistance, Fibonacci Analysis, Harmonic Pattern, Elliott Wave and X3 Chart Pattern (In Forex and Stock Market Trading)
https://www.amazon.com/dp/B0993WZGZD
https://play.google.com/store/books/details?id=MME3EAAAQBAJ
https://algotrading-investment.com/portfolio-item/science-of-support-resistance-fibonacci-analysis-harmonic-pattern/
https://books.google.co.kr/books/about?id=MME3EAAAQBAJ
Profitable Chart Patterns in Forex and Stock Market (Fibonacci Analysis, Harmonic Pattern, Elliott Wave, and X3 Chart Pattern)
https://www.amazon.com/dp/B0B2KZH87K
https://play.google.com/store/books/details?id=7KrQDwAAQBAJ
https://algotrading-investment.com/portfolio-item/profitable-chart-patterns-in-forex-and-stock-market/
https://books.google.com/books/about?id=7KrQDwAAQBAJ
Guide to Precision Harmonic Pattern Trading (Mastering Turning Point Strategy for Financial Trading)
https://www.amazon.com/dp/B01MRI5LY6
https://play.google.com/store/books/details?id=8SbMDwAAQBAJ
http://algotrading-investment.com/portfolio-item/guide-precision-harmonic-pattern-trading/
https://books.google.com/books/about?id=8SbMDwAAQBAJ
Scientific Guide to Price Action and Pattern Trading (Wisdom of Trend, Cycle, and Fractal Wave)
https://www.amazon.com/dp/B073T3ZMBR
https://play.google.com/store/books/details?id=5prUDwAAQBAJ
https://algotrading-investment.com/portfolio-item/scientific-guide-to-price-action-and-pattern-trading/
https://books.google.com/books/about?id=5prUDwAAQBAJ
Predicting Forex and Stock Market with Fractal Pattern: Science of Price and Time
https://www.amazon.com/dp/B086YKM8BW
https://play.google.com/store/books/details?id=VJjiDwAAQBAJ
https://algotrading-investment.com/portfolio-item/predicting-forex-and-stock-market-with-fractal-pattern/
https://books.google.com/books/about?id=VJjiDwAAQBAJ
Trading Education Book 1 in Korean (Apple, Google Play Book, Google Book, Scribd, Kobo)
https://books.apple.com/us/book/id1565534211
https://play.google.com/store/books/details?id=HTgqEAAAQBAJ
https://books.google.co.kr/books/about?id=HTgqEAAAQBAJ
https://www.scribd.com/book/505583892
https://www.kobo.com/ww/en/ebook/8J-Eg58EDzKwlpUmADdp2g
Trading Education Book 2 in Korean (Apple, Google Play Book, Google Book, Scribd, Kobo)
https://books.apple.com/us/book/id1597112108
https://play.google.com/store/books/details?id=shRQEAAAQBAJ
https://books.google.co.kr/books/about?id=shRQEAAAQBAJ
https://www.scribd.com/book/542068528
https://www.kobo.com/ww/en/ebook/X8SmJdYCtDasOfQ1LQpCtg
About Young Ho Seo
Young Ho Seo is an Engineer, Financial Trader, and Quantitative Developer, working on Trading Science and Investment Engineering since 2011. He is the creator of many technical indicators, price patterns and trading strategies used in the financial market. He is also teaching the trading practice on how to use the Supply Demand Analysis, Support, Resistance, Trend line, Fibonacci Analysis, Harmonic Pattern, Elliott Wave Theory, Chart Patterns, and Probability for Forex and Stock Market. His works include developing scientific trading principle and mathematical algorithm in the work of Benjamin Graham, Everette S. Gardner, Benoit Mandelbrot, Ralph Nelson Elliott, Harold M. Gartley, Richard Shabacker, William Delbert Gann, Richard Wyckoff and Richard Dennis. You can find his dedicated works on www.algotrading-investment.com . His life mission is to connect financial traders and scientific community for better understanding of this world and crowd behaviour in the financial market. He wrote many books and articles, which are helpful for understanding the technology and application behind technical analysis, statistics, time series forecasting, fractal science, econometrics, and artificial intelligence in the financial market.
If you are interested in our software and training, just visit our main website: www.algotrading-investment.com
Young Ho Seo
How to Ride the Price Swing or Fractal Wave in Forex – Must Read
In this short article, we will share some practical tips to ride the price swings (or Fractal wave) in Forex and Stock market. Please read this article for your own good as it does not cost you anything. Forex trading is basically the decision making process over the market entry and exit. The most important variable you need to watch is the price. You need to watch how the price evolves with time. Hence, we will share the best way to calculate the market timing.
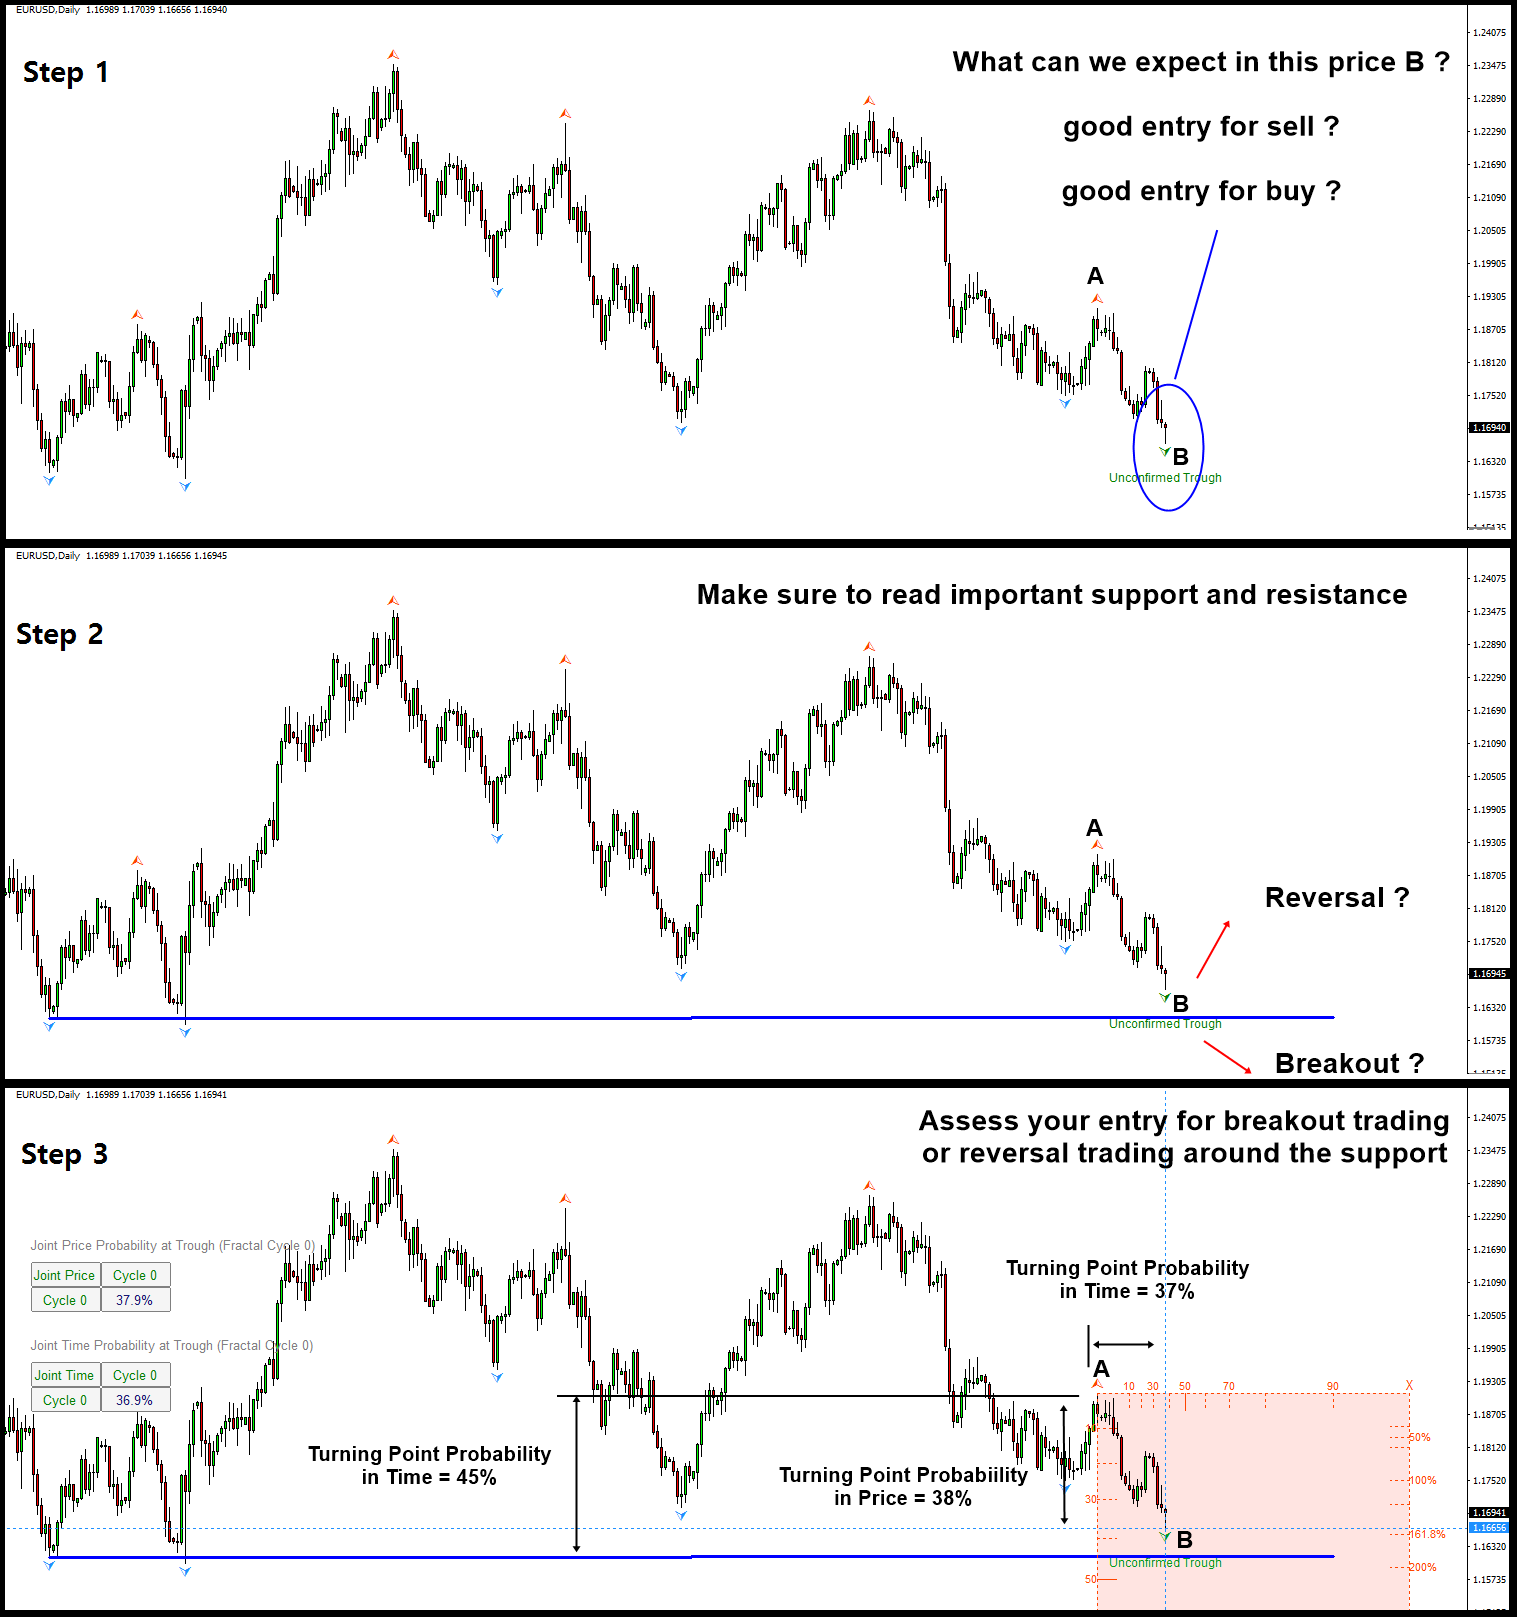
Step 1: open the chart. This is the first requirement for any trading. You need to see the price to learn what is going on in the market. Especially, when you apply the peak trough analysis in your chart, you will see lowest and highest points marked automatically. This lowest and highest points are basically the price swings happened in the past. You need use these price swings to read the market rhythm before making your trading decision.
Step 2: Look for the important horizontal support and resistance or diagonal support and resistance. In this example, we have drawn the horizontal support line for the visual illustration of this process. Marking up the support and resistance is simple task with peak trough analysis in your chart. Never underestimated them. It can takes as little time as 2 to 3 minutes to draw one or two important lines.
Step 3: Here is the most important part. As in our example, the price is heading to the horizontal support line, we need to assess how risky to take the reversal or breakout trading around this horizontal support line. Now we apply our turning point probability graph to assess our opportunity for reversal or breakout. Turning point probability will be measured between the point A and the point B. That is one price swing or fractal wave. Now let us have a look at the number.
From the turning point probability graph, at the point B, we can tell the followings:
the turning point probability in price is 38%
turning point probability in time is 37%
In another words, at the point B, we can tell the followings:
the trend probability in price is 62% (1 – 38%)
trend probability in time is 63% (1 – 37%)
Interpreting this probability, we can tell that the current price level is little bit immature to expect the reversal movement. If price go down further and it touches the horizontal support line, then we can tell the followings:
the turning point probability in price is 45%
turning point probability in time is unknown now. Depending on how fast or slowly price come down, it might go over 50%.
In Step 3 analysis, there are two important points for you to understand. Firstly, this trading opportunity is not entirely favoring the reversal trading. There are some cases which your chance for reversal trading is much higher comparing to the breakout trading chance. The step 3 analysis will usually help you to find out that. Secondly, since the certainty is not too high, this recommends you to position size carefully. In another words, you need to think about the mild position size rather than the big position size. Even more simply speaking, reduce the lot size for your forex trading. Then depending on the surrounding market condition, you can conditionally increase or reduce the position size. Checking the surrounding market condition is the final check up. If the surrounding market condition is not favoring your trading direction, it is good to skip this opportunity.
In long run, we recommend you to follow step 1, step 2 and step 3. Especially, step 3 is the most important analysis as you have the opportunity to access your risk in your trading. Typically, visualizing one’s trading decision is not an easy task. Hence, this article is not meant to provide the exhausted list of the analysis steps but use as only some base guideline. We hope you enjoy this short practical guideline. There are more educational articles in this link below.
https://algotrading-investment.com/2019/07/23/trading-education/
https://algotrading-investment.com/2020/04/26/metatrader-and-optimum-chart-manuals/
For the time being, there are only two tools that can measure the turning point probability in price and time. First one is the Fractal Pattern Scanner for MetaTrader 4 and MetaTrader 5. Second one is the Optimum Chart.
Below is the landing page for Fractal Pattern Scanner in MetaTrader version.
https://www.mql5.com/en/market/product/49170
https://www.mql5.com/en/market/product/49169
https://algotrading-investment.com/portfolio-item/fractal-pattern-scanner/
The screenshot is massive. Sorry for the downloading time.

Young Ho Seo
Scan and search future harmonic patterns with Harmonic Pattern Scenario Planner
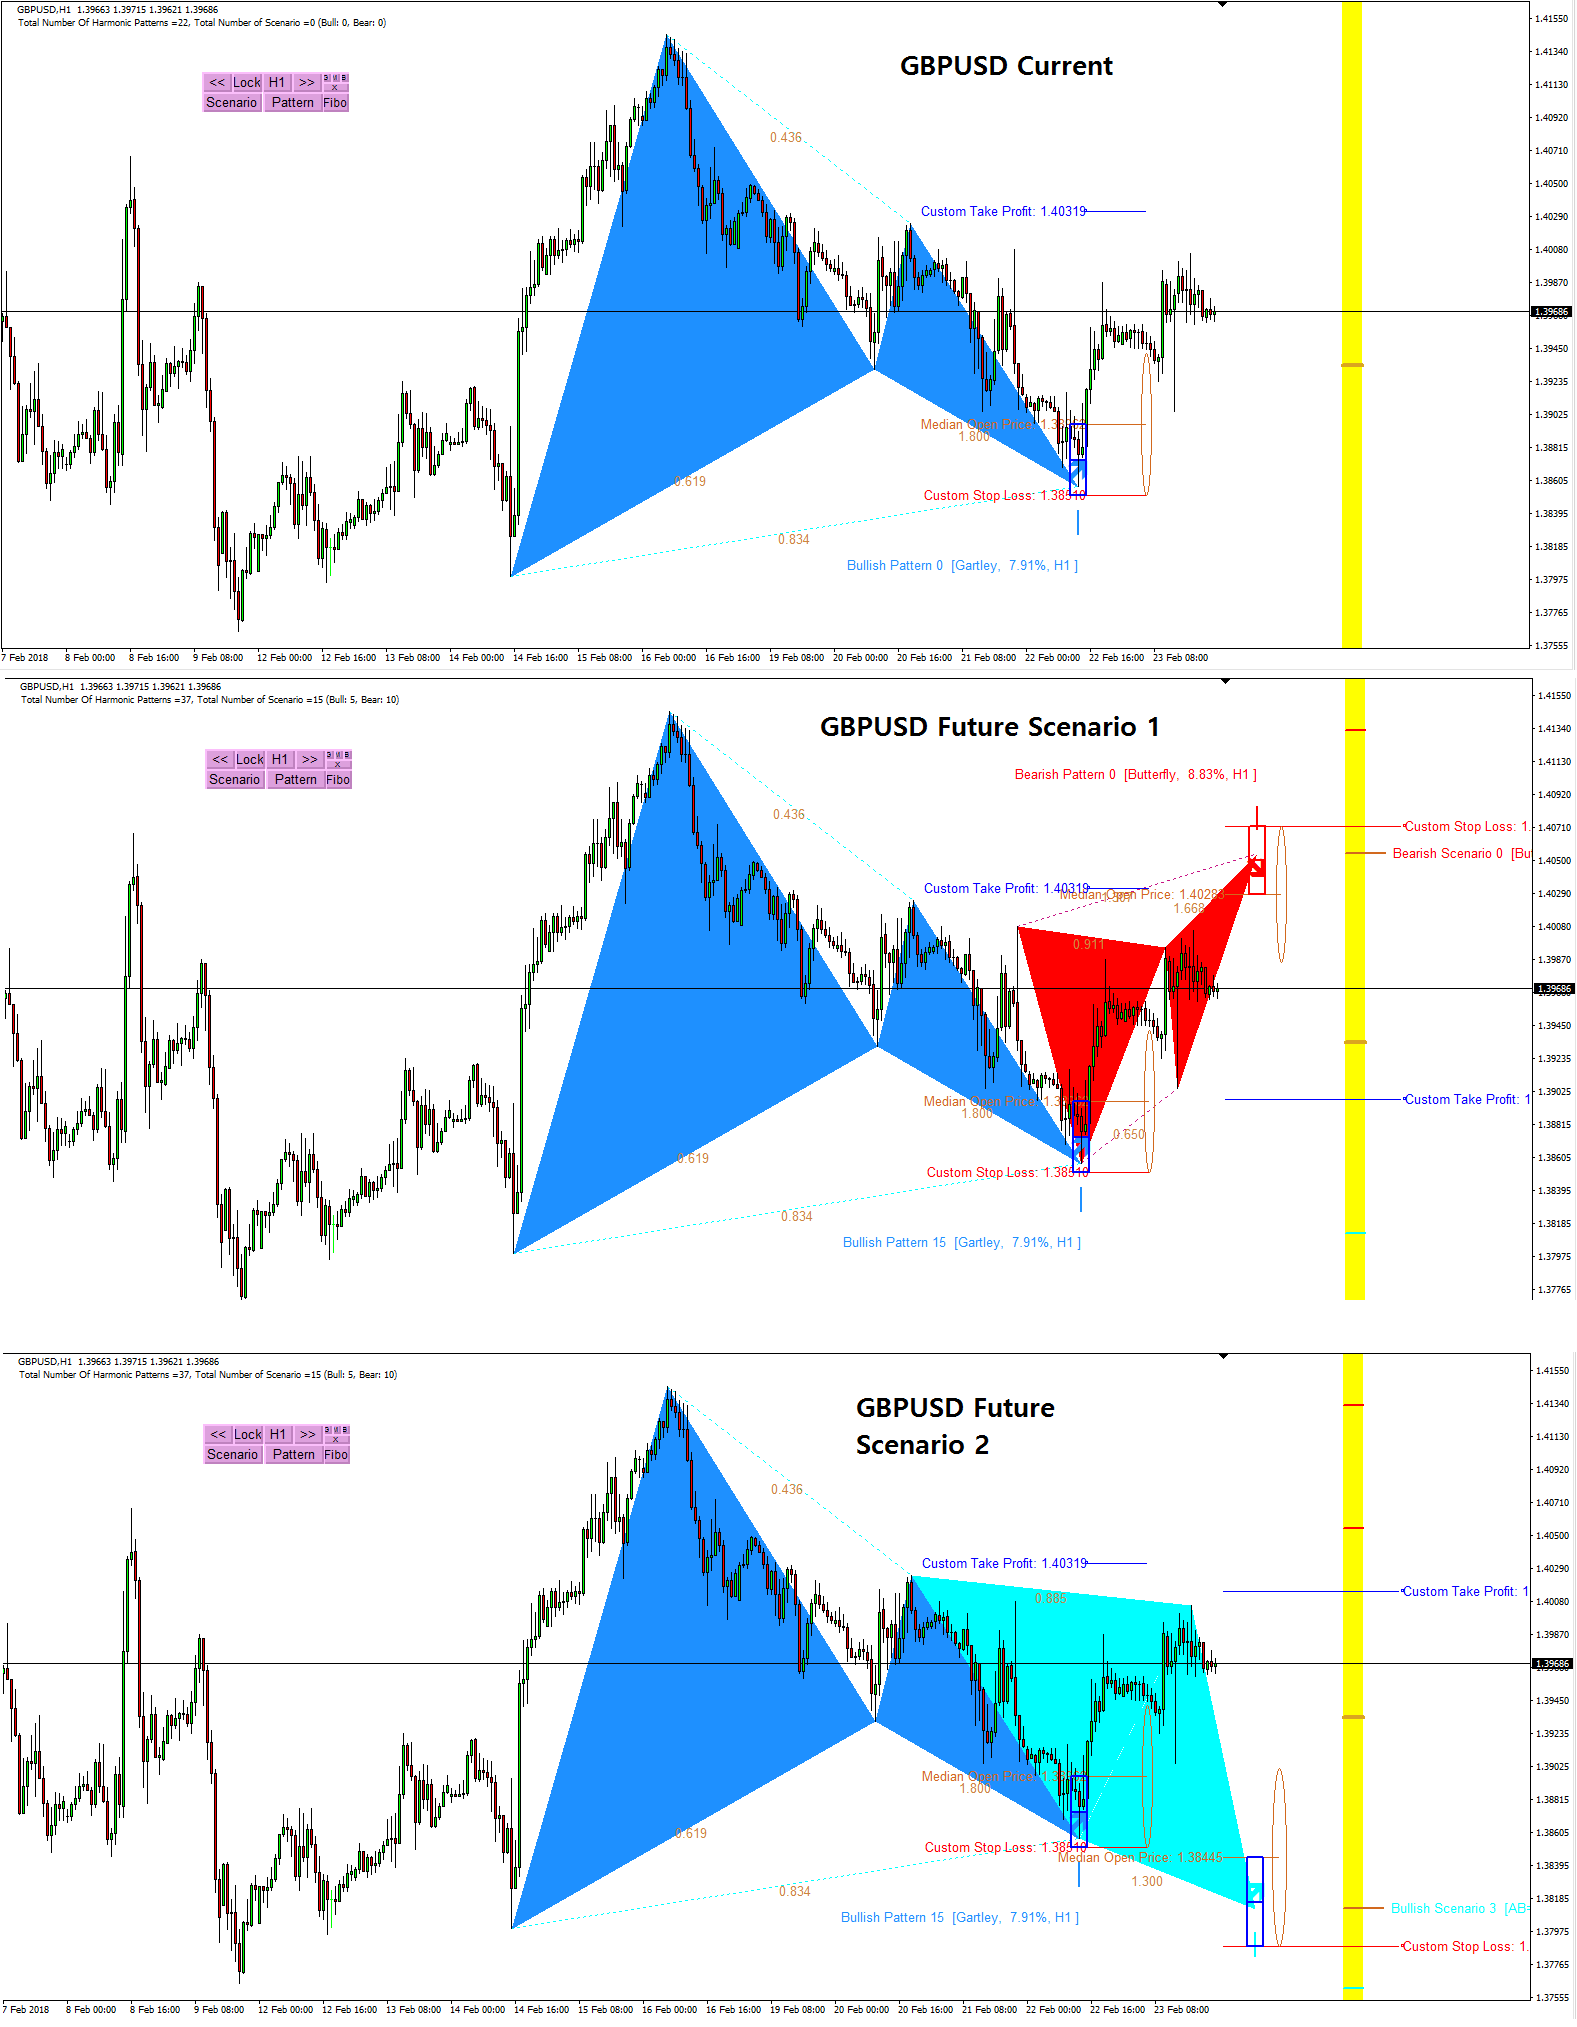
Harmonic Pattern Scenario Planner is a tool you can scan and search future harmonic patterns in just one button click. It would detect any potential future harmonic patterns in your search range using the algorithm like Monte Carlo simulation. You can even get the potential take profit and stop loss of the future patterns even before they form. What is even more, you can use all the features and functionality of harmonic pattern plus from your harmonic pattern scenario planner too.
Have watched this interesting movie called “Next” ? Check out the guy can see the few minutes into the futures. How powerful the 2 minutes vision for future is. Predicting future is very tactical game but it is hard because future keep changing based on the presents. However, it is definitely an interesting game. As a trader, you can gain a lot of advantage over other traders by predicting futures.
http://www.imdb.com/title/tt0435705/
This movie like predicting concept was equipped in our Harmonic Pattern Scenario Planner. check the power of predictive harmonic pattern for your trading. We are only one selling this future predictive harmonic pattern scanner in the universe.
https://algotrading-investment.com/portfolio-item/harmonic-pattern-scenario-planner/
https://www.mql5.com/en/market/product/6101
https://www.mql5.com/en/market/product/6240

Young Ho Seo
Pattern Completion Interval and Basic Order Management for harmonic Pattern Trading
Many harmonic pattern trader uses arbitrary order management. Some just uses Fibonacci levels but they are not able to measure or think how each winning and losing trades can affect their trading balance. You do need to know this to grow your capital safely. Risk and Order management is not the concept you can skip regardless of your trading strategy and signals.
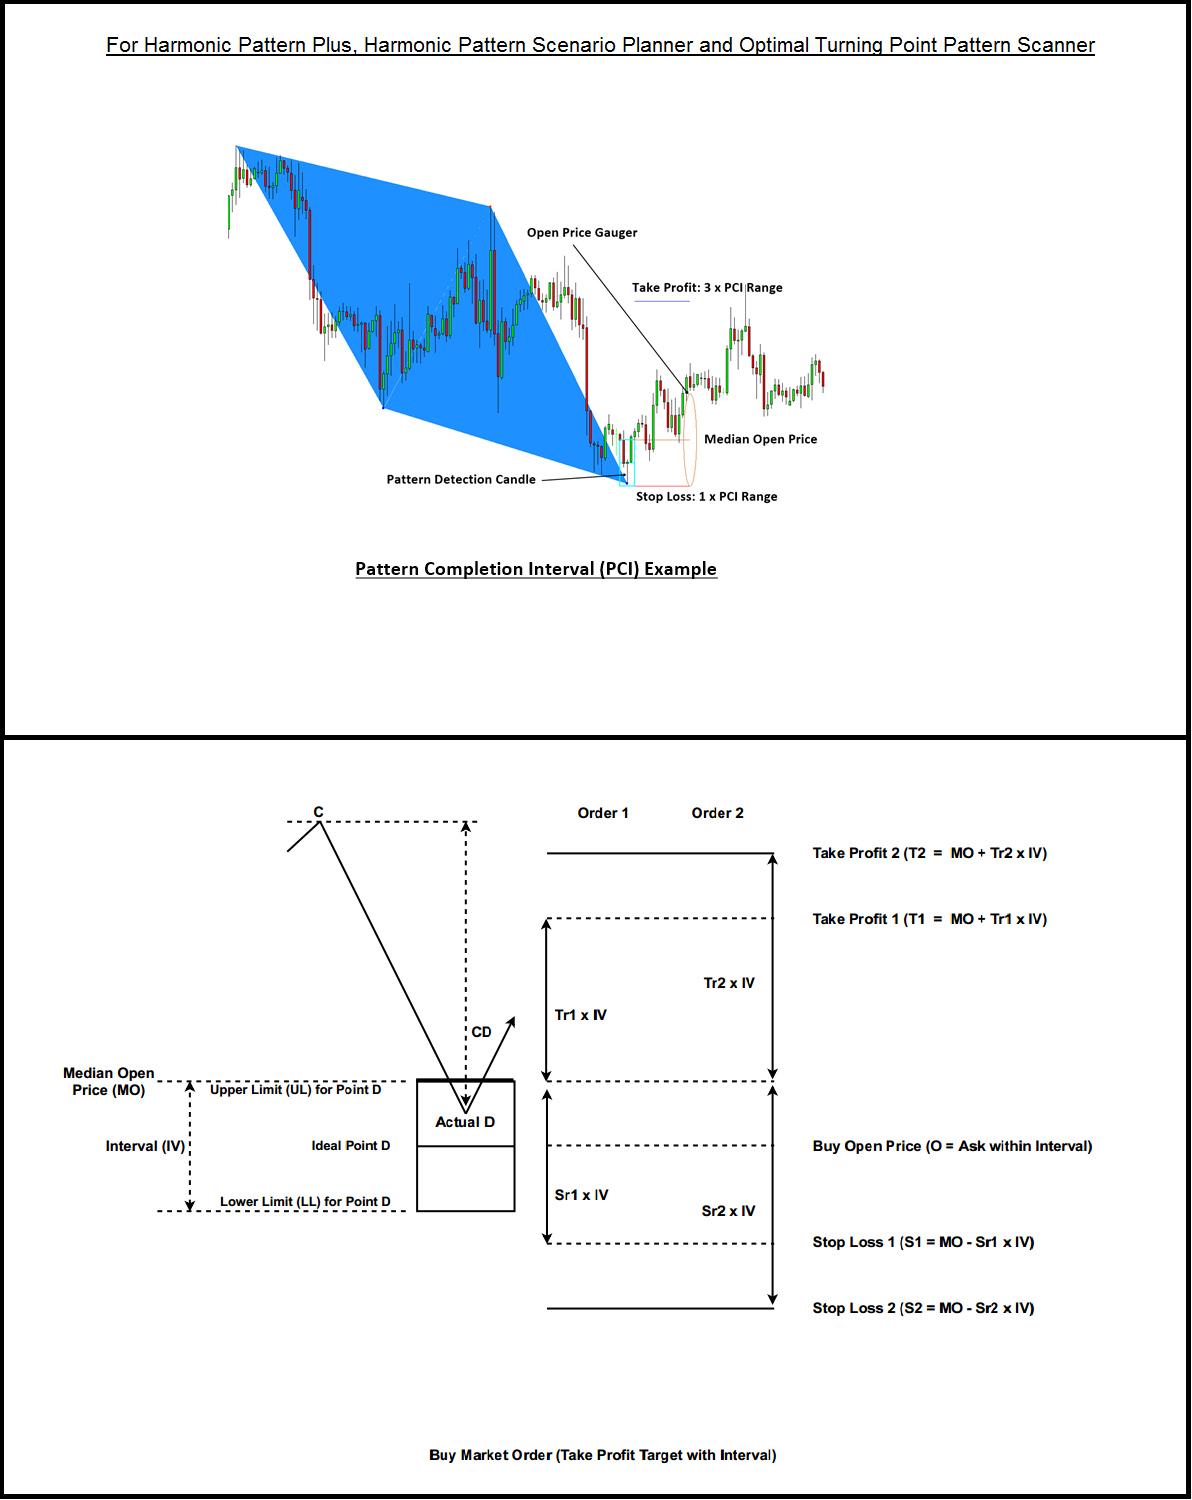
Pattern Completion Interval is the concept, first introduced in the Book (Guide to Precision Harmonic Pattern Trading), to help you to trade with harmonic pattern in more scientific Risk management. Here is the link to the Book: Guide to Precision Harmonic Pattern Trading.
https://algotrading-investment.com/portfolio-item/guide-precision-harmonic-pattern-trading/
Especially, it helps you to achieve the desired Reward/Risk ratio while you are trading in real time tick by tick data. Here is one of many approaches how you may use the Pattern Completion Interval concept for your trading. Of course, this approach is compatible with your Harmonic Pattern Plus and Harmonic Pattern Scenario Planner. We produce this diagram so you can understand this approach intuitively without any calculator in your hands. Tr = Take Profit Ratio and Sr = Stop Loss Ratio. The diagram shows the case of two orders but you can even generate more orders taking this example further. Hopefully this new diagram is easier to understand than previous one.
Of course, this precision trading frame work is applicable to our Harmonic Pattern Indicator ranges including Harmonic Pattern Plus and Harmonic Pattern Scenario Planner and X3 Chart Pattern Scanner.
https://algotrading-investment.com/portfolio-item/harmonic-pattern-plus/
https://algotrading-investment.com/portfolio-item/harmonic-pattern-scenario-planner/
https://algotrading-investment.com/portfolio-item/profitable-pattern-scanner/

Young Ho Seo
Trend Probability in Forex and Stock market trading
In this article, we will introduce the trend probability for your Forex and Stock market trading. When the turning point probability is high, we can expect the turning point to arrive within the fractal cycle. Like the margin of safety described by Benjamin Graham, it is safe to use the turning point probability in conservative manner. We should only look for the turning point within the higher probability area. The margin of safety will tell that higher turning point probability is safer to predict the turning point. On the other hand, we can look for the breakout opportunity or we can expect the price to move in the same direction within the lower turning point probability area. We can consider the trend probability providing the opposite concept of the turning point probability. In a simple math, we can derive the trend probability by subtracting the turning point probability from one like “1.0 – the turning point probability”. Or if you prefer the percent, we can derive the trend probability by subtracting the turning point probability (%) from one hundred percent like “100% – turning point probability (%)”. Since the turning point probability is drawn from the peak trough transformation directly, the conversion of the trend probability from the turning point probability should be taken as the rule of thumb guideline for your trading. As in the turning point probability, the margin of safety will tell that higher trend probability is safer to predict the breakout or price continuation. This information was taken from the book: Science Of Support, Resistance, Fibonacci Analysis, Harmonic Pattern, Elliott Wave and X3 Chart Pattern (In Forex and Stock Market Trading). This book will provide the scientific rational for chart patterns, connection with economics, chart pattern detection examples, how to use them and how to improve them in Forex and Stock market.
The book can be found in all the major book distributors in the world. Please choose the best book distributor you like from the link below including amazon.com, Google Play Book, scribd.com, Apple Book and so on.
https://www.scribd.com/book/515253555/Science-Of-Support-Resistance-Fibonacci-Analysis-Harmonic-Pattern-Elliott-Wave-and-X3-Chart-Pattern
https://algotrading-investment.com/portfolio-item/science-of-support-resistance-fibonacci-analysis-harmonic-pattern/
https://www.amazon.com/dp/B0993WZGZD
https://play.google.com/store/books/details?id=MME3EAAAQBAJ
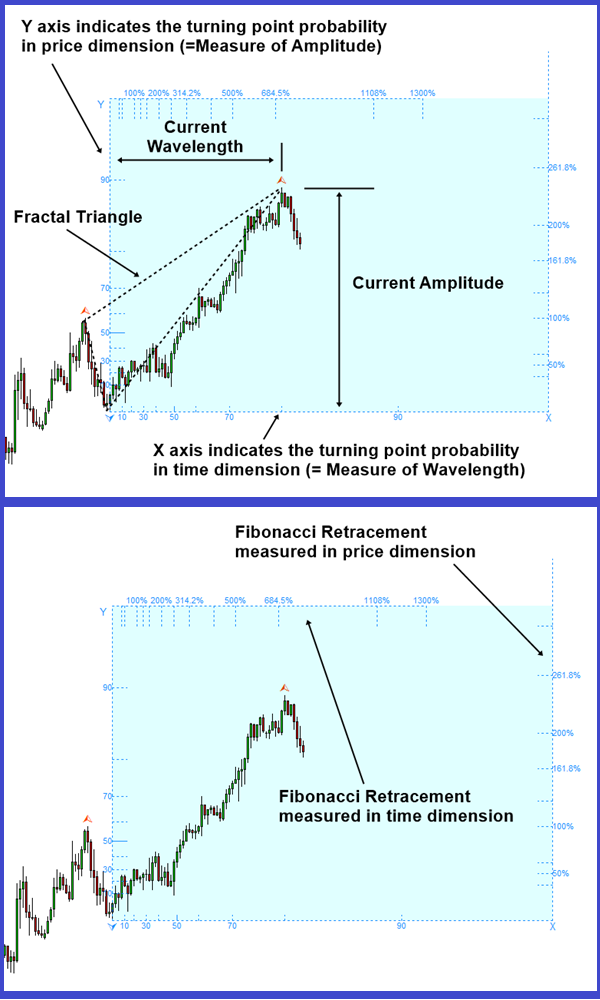
To present the turning point probability in Forex and Stock Market, we have devised the simple turning point probability graph. When we predict the peak, in the probability graph, Y axis (=the left axis) indicates the turning point probability in price dimension and X axis (= the bottom axis) indicates the turning point probability in time dimension. The probability ranges from 0.0 (=0%) to 1.0 (=100%). Typically, there is no practical application making use of 100% probability in the world. Since our calculation is based on the price data only (i.e. empirical probability), we recommend using 90% probability or less for the maximum probability. For example, even if the price stays above the 90% probability, it is better to treat them as 90% or less depending on how conservative your trading style is.
You have the full access to the turning point probability and trend probability from Fractal Pattern Scanner to improve your Forex and Stock Market Trading. As it was suggested from the book, the display probability in the Fibonacci Probability Graph is the turning point probability. You will use the turning point probability to gauge the trend probability as it was guided from the book. Please have a look at the indicator. Of course, you have this tool built in our Optimum Chart too.
Below is the landing page for Fractal Pattern Scanner in MetaTrader version.
https://www.mql5.com/en/market/product/49170
https://www.mql5.com/en/market/product/49169
https://algotrading-investment.com/portfolio-item/fractal-pattern-scanner/

Young Ho Seo
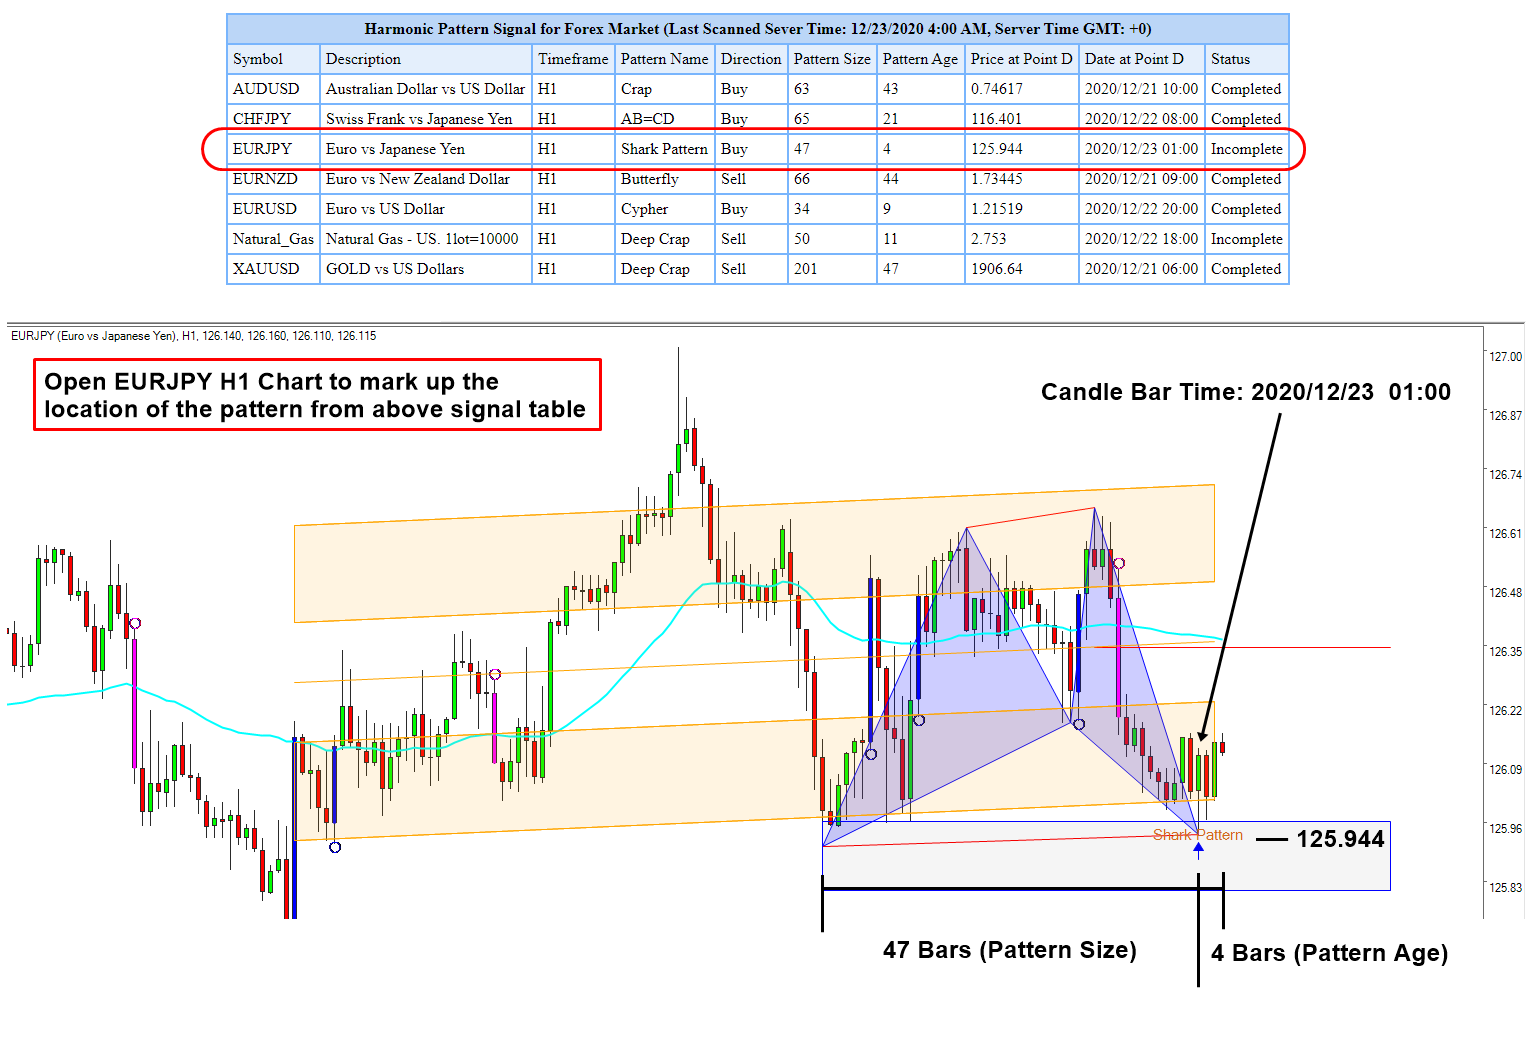
Harmonic Pattern Signal – Free
Harmonic Pattern Trading Signal provides a mean of detecting the turning point in the market. It is one way to solve the puzzle of market geometry, which is often not solvable with other technical indicators. Especially, we provide the Harmonic Pattern Signal for your trading. It is absolutely free of charge. The Harmonic Pattern Signal can be accessible from the link below.
https://algotrading-investment.com/2020/12/17/harmonic-pattern-signal-for-forex-market/
We present the trading signal in the simple table form. To use this trading signal, you need to mark up the location of the Harmonic Pattern in your chart. You can do this in any trading platform including MetaTrader, Trading View, Ninja Trader and so on. Follow the two steps below:
Open the Chart with the same timeframe shown in the table
Mark up the pattern location using Price at Point D and Date at Point D
That is all. Check the attached screenshot and more detailed Instruction can be found from the above link. Our Harmonic Pattern Trading signal is absolutely free. It is a good staring point for anyone who are interested in trading Forex market. At the same time, we provide the MetaTrader 4 and MetaTrader 5 version of Harmonic Pattern Scanner. If you prefer the indicator version of Harmonic Pattern Signal, then you can visit the product page for Harmonic Pattern Plus or X3 Chart Pattern Scanner.
Below are the Links to Harmonic Pattern Plus
https://www.mql5.com/en/market/product/4488
https://www.mql5.com/en/market/product/4475
https://algotrading-investment.com/portfolio-item/harmonic-pattern-plus/
Below are the Links to X3 Chart Pattern Scanner.
https://www.mql5.com/en/market/product/41993
https://www.mql5.com/en/market/product/41992
https://algotrading-investment.com/portfolio-item/profitable-pattern-scanner/

Young Ho Seo
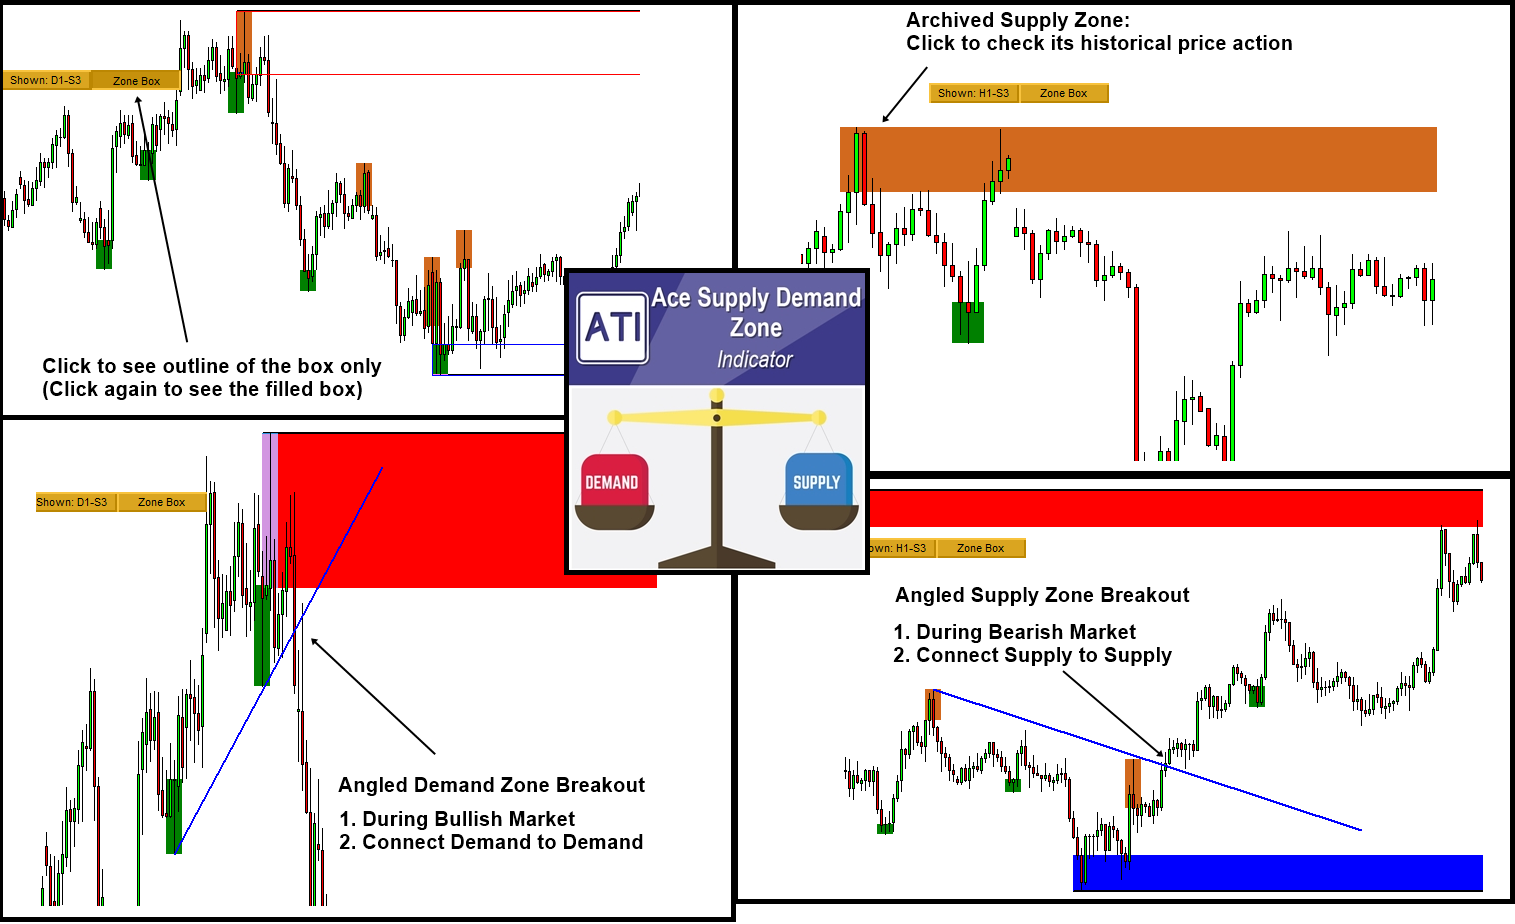
Supply Demand Zone Indicator on MetaTrader 4
MetaTrader 4 is one of the most popular trading platform since 2010. It is accessible for free of charge for any trader from all over the world. We provide a range of powerful supply demand zone indicator particularly designed for MetaTrader 4 platform.
Here is the list of Advanced Supply Demand Zone Indicator. These supply and demand zone indicators are rich in features with many powerful features to help you to trade the right supply and demand zone to trading.
Mean Reversion Supply Demand on MetaTrader 4
Mean Reversion Supply Demand indicator is our earliest supply demand zone indicator and loved by many trader all over the world. It is great to trade with reversal and breakout. You can also fully setup your trading with stop loss and take profit target. Please note that Mean Reversion Supply Demand is the excellent tool but it is repainting supply demand zone indicator.
Below are the links to MetaTrader 4 version of the Mean Reversion Supply Demand indicator.
https://www.mql5.com/en/market/product/16851
https://algotrading-investment.com/portfolio-item/mean-reversion-supply-demand
Ace Supply Demand Zone Indicator on MetaTrader 4
Ace Supply Demand Zone indicator is our next generation supply demand zone indicator. It was built in non repainting and non lagging algorithm. On top of many powerful features, you can also make use of archived supply and demand zone in your trading to find more accurate trading opportunity. Ace Supply Demand Zone indicator is the non repainting supply demand zone indicator. If you prefer the non repainting indicator, then you must use Ace Supply Demand Zone Indicator.
Below are the links to MetaTrader 4 version of the Ace Supply Demand Zone indicator.
https://www.mql5.com/en/market/product/40076
https://algotrading-investment.com/portfolio-item/ace-supply-demand-zone
For your information, both indicators provides many powerful features to complete for your trading. You can also use this indicators together with harmonic pattern and elliott wave pattern indicators.

Young Ho Seo
Trading Chart Patterns in Forex and Stock Market
Chart patterns are the essential price analysis for Forex and Stock market trading as the price is the single most important variable in the market. You can not miss to study the price, even it is very basic one. No one would attempt to trade without seeing the price itself. When you use the chart patterns wisely as the timing tool, it will often reward you more than people who does not use them. Chart patterns include support, resistance, Fibonacci Analysis, harmonic pattern, Elliott Wave, X3 Chart pattern, triangles, rising wedge, falling wedge pattern, channels and many more. Your next question would be why they are so important for our trading and how to use them in our trading. This is rather not short story to be packed in this single article. We can only tell where you can find such a guidance using the chart patterns in Forex and Stock market. The book: Science Of Support, Resistance, Fibonacci Analysis, Harmonic Pattern, Elliott Wave and X3 Chart Pattern (In Forex and Stock Market Trading) is exactly the book dedicated for this topic. This book will provide the scientific rational for chart patterns, connection with economics, chart pattern detection examples, how to use them and how to improve them in Forex and Stock market.
The book can be found in all the major book distributors in the world. Please choose the best book distributor you like from the link below including amazon.com, Google Play Book, scribd.com, Apple Book and so on.
https://www.scribd.com/book/515253555/Science-Of-Support-Resistance-Fibonacci-Analysis-Harmonic-Pattern-Elliott-Wave-and-X3-Chart-Pattern
https://algotrading-investment.com/portfolio-item/science-of-support-resistance-fibonacci-analysis-harmonic-pattern/
https://www.amazon.com/dp/B0993WZGZD
https://play.google.com/store/books/details?id=MME3EAAAQBAJ
Learning the geometric shape of the price patterns might be not sufficient to apply them well in the financial market. If we understand why the price patterns exist in the financial market, we can use them more accurately. Hence, it is important to understand the underlying science behind the price patterns. In doing so, we need to understand the trend and cycle. Then we need to see the connection of fractal wave with trend and cycle. Finally, when we recognize the fractal wave as the superior analytical method to the existing methods, we will understand why price patterns were used in the financial market over 100 years. With understanding of the turning point in connection with economics, this can advance your knowledge and practice for your day trading and investing.
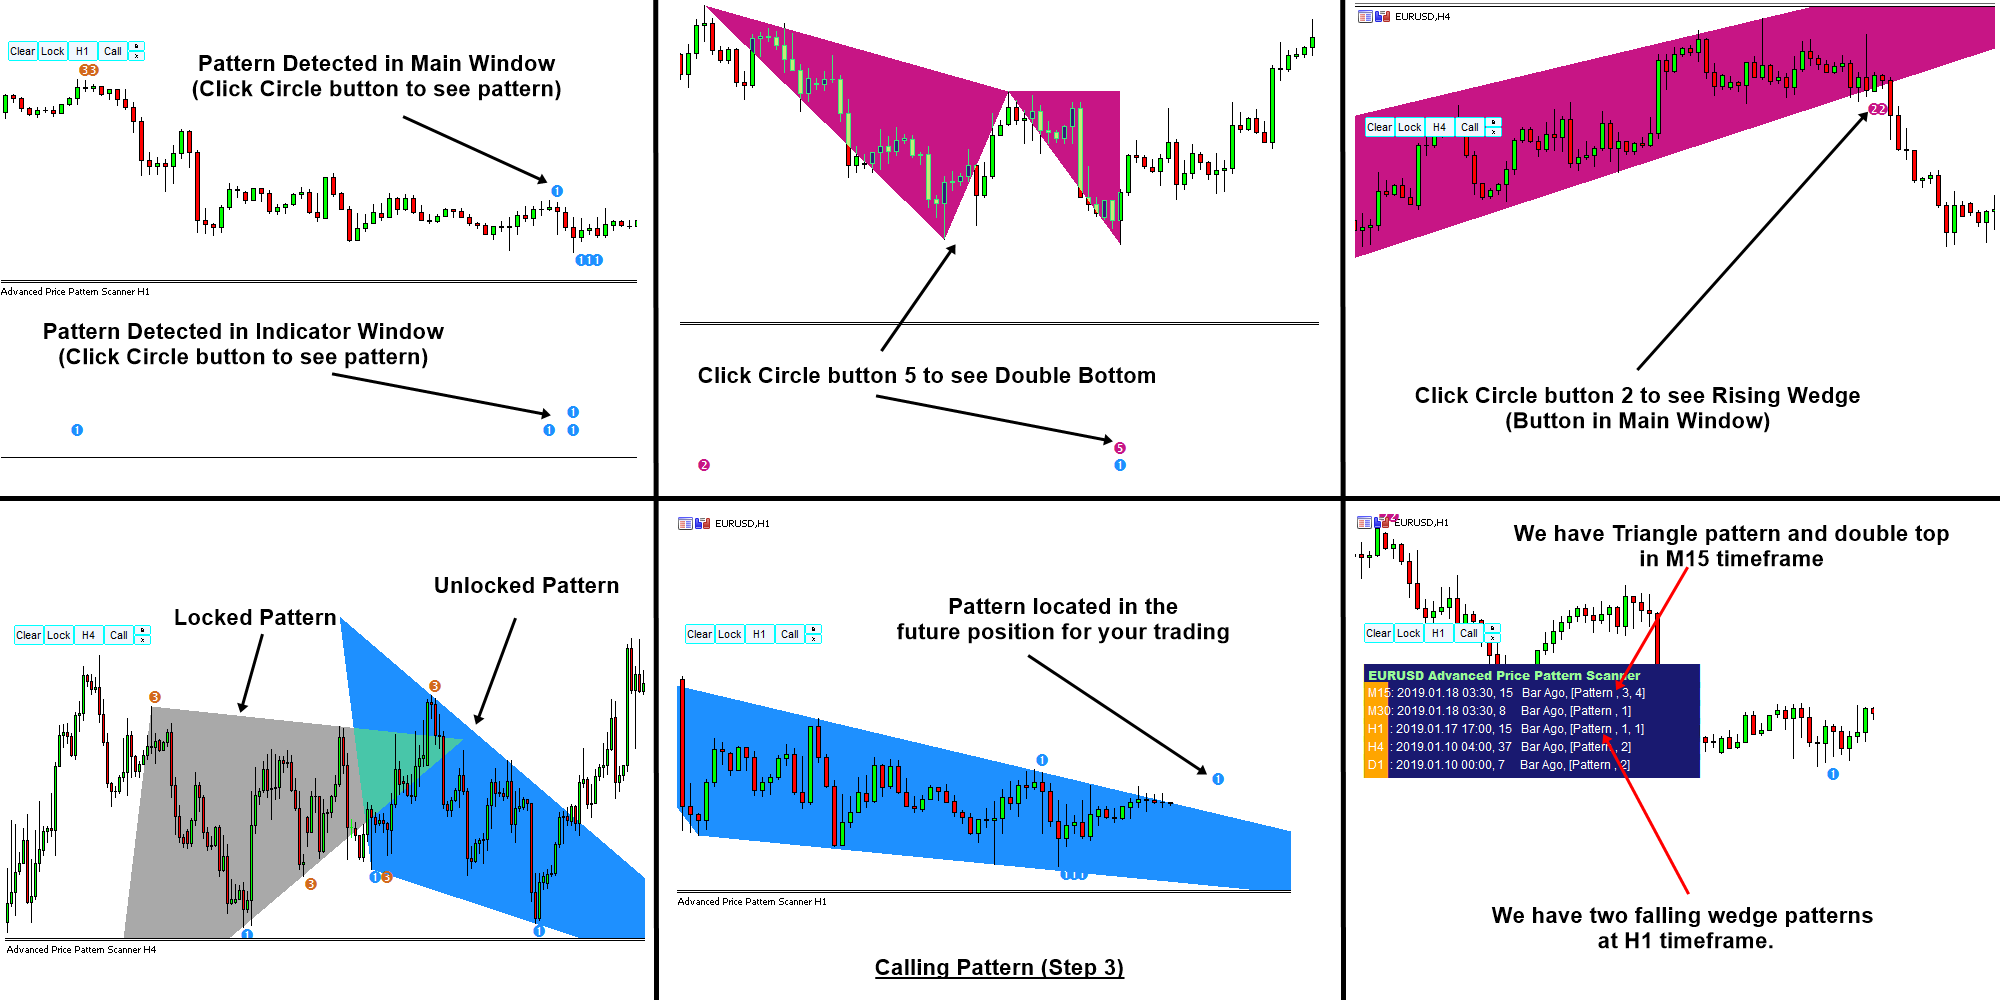
In addition, we provide the automated chart pattern scanner for the harmonic patterns, triangle and wedge patterns respectively. The automated chart pattern scanner helps you to detect some repeating chart patterns automatically. They are the convenient tool to use after you have understood how the chart patterns works for your trading.
1. Advanced Price Pattern Scanner (Triangle + Wedge patterns + others)
Advanced Price Pattern Scanner is the non repainting pattern scanner designed for both MetaTrader 4 and MetaTrader 5. It can detects many important price patterns for your trading like rising wedge, falling wedge, head and shoulder patterns, Cup and Handle, etc. Here is an intro video for Advanced Price Pattern Scanner from YouTube. Please check it out.
https://algotrading-investment.com/portfolio-item/advanced-price-pattern-scanner/
https://www.mql5.com/en/market/product/24679
https://www.mql5.com/en/market/product/24678
1. X3 Chart Pattern Scanner (Harmonic Pattern + X3 Chart Pattern)
X3 Chart Pattern Scanner is next generation tools to trade with X3 price patterns in Forex market. With non repainting and non lagging algorithm, this tool can detect with advanced Harmonic Pattern, Elliott Wave Pattern, X3 Pattern structure for your trading. As a bonus, it provides your Japanese candlestick patterns too. X3 Chart Pattern Scanner is type 4 harmonic pattern indicator, which means that you can fine tune your strategy using historical patterns while you are trading the same patterns on live trading.
https://www.mql5.com/en/market/product/41993
https://www.mql5.com/en/market/product/41992
https://algotrading-investment.com/portfolio-item/profitable-pattern-scanner/
For your information, the attached screenshot shows the advanced price pattern scanner.

Young Ho Seo
Combining Price Breakout Pattern with Support and Resistance
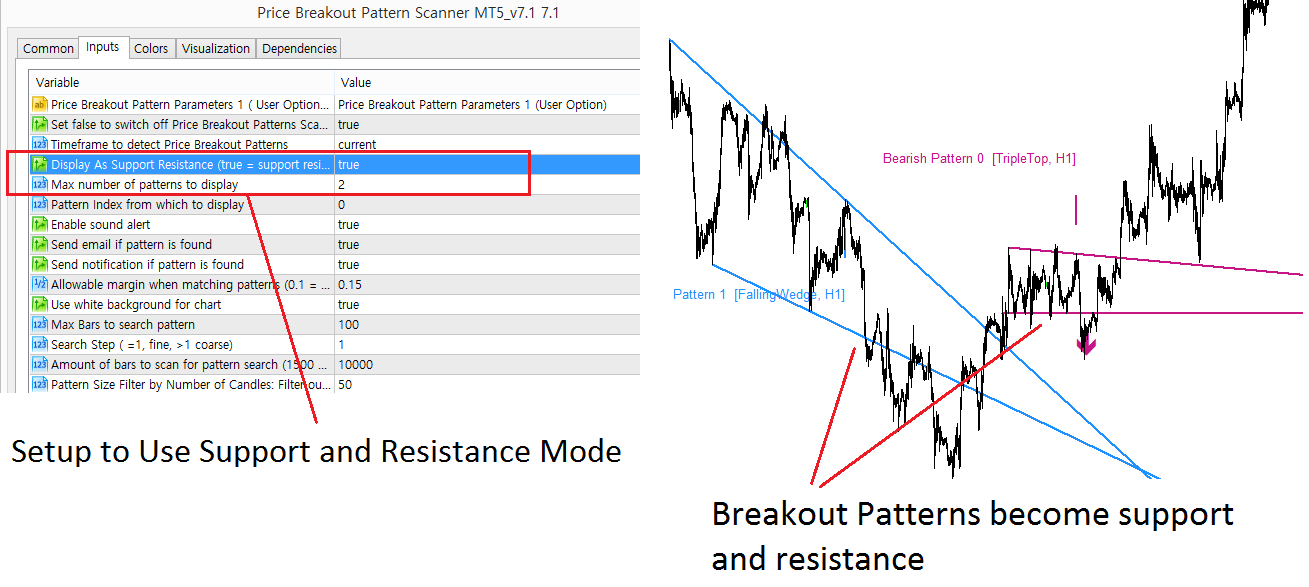
Price Breakout Patterns are in fact the extension of support and resistance trading. When you grab the idea of support and resistance with Price Breakout Patterns, you can really advance your trading a lot. With Price Breakout Pattern Scanner, this is easy task because it provide the built in support and resistance mode.
In the support and resistance mode, your price breakout patterns will be turned into support and resistance. In doing so, you need to set support and resistance mode in your input setting. We will show this in our screenshot.
Once this setup is in place, Price Breakout Pattern will become support and resistance for your trading. With conventional support and resistance together, this could indicate highly probable trading entry.
Below is the YouTube Video link for Price Breakout Pattern Scanner:
YouTube Video Link: https://www.youtube.com/watch?v=aKeSmi_Di2s
Below are the links to Price breakout Pattern Scanner
https://www.mql5.com/en/market/product/4859
https://www.mql5.com/en/market/product/4858
https://algotrading-investment.com/portfolio-item/price-breakout-pattern-scanner/

Young Ho Seo
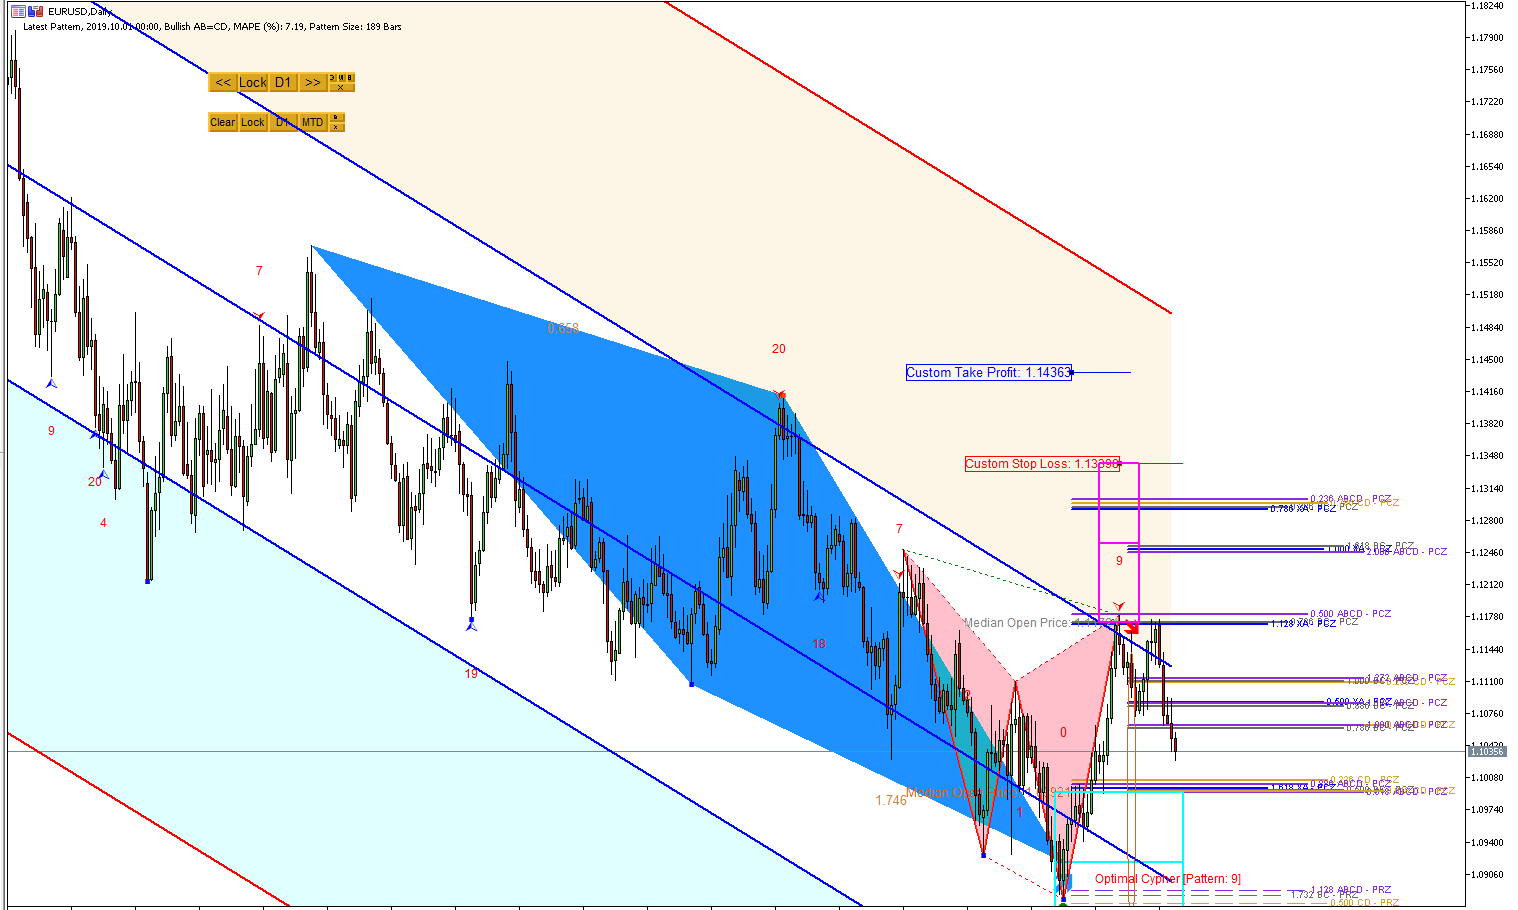
Using Harmonic Pattern Plus and X3 Chart Pattern Scanner Together
Harmonic Pattern Plus and X3 Chart Pattern Scanner are the great harmonic pattern detection indicator. Some trader asked me if they can use Harmonic Pattern Plus and X3 Chart Pattern Scanner together.
The short answer is yes. It is possible to combine them. Even though both indicators detect harmonic patterns, they are using completely different pattern detection algorithm. Harmonic pattern Plus uses the classic pattern detection algorithm whereas X3 Chart Pattern Scanner uses non repainting pattern detection algorithm (i.e. latest pattern detection technology).
There can be some overlapping in the detected patterns. However, many patterns can be detected in different timing. If both indicator detect the same patterns, then the patterns are often more accurate. At the same time, with non overlapping patterns, you have less chance to miss out the good signals.
When you want to use the channel function together with Harmonic Pattern, then use the channel function in X3 Chart Pattern Scanner because it is more advanced version.
Of course, the same logic applies to Harmonic Pattern Scenario planner.
Link to Harmonic Pattern Plus
https://www.mql5.com/en/market/product/4488
https://www.mql5.com/en/market/product/4475
https://algotrading-investment.com/portfolio-item/harmonic-pattern-plus/
Link to X3 Chart Pattern Scanner
https://www.mql5.com/en/market/product/41993
https://www.mql5.com/en/market/product/41992
https://algotrading-investment.com/portfolio-item/profitable-pattern-scanner/

Young Ho Seo
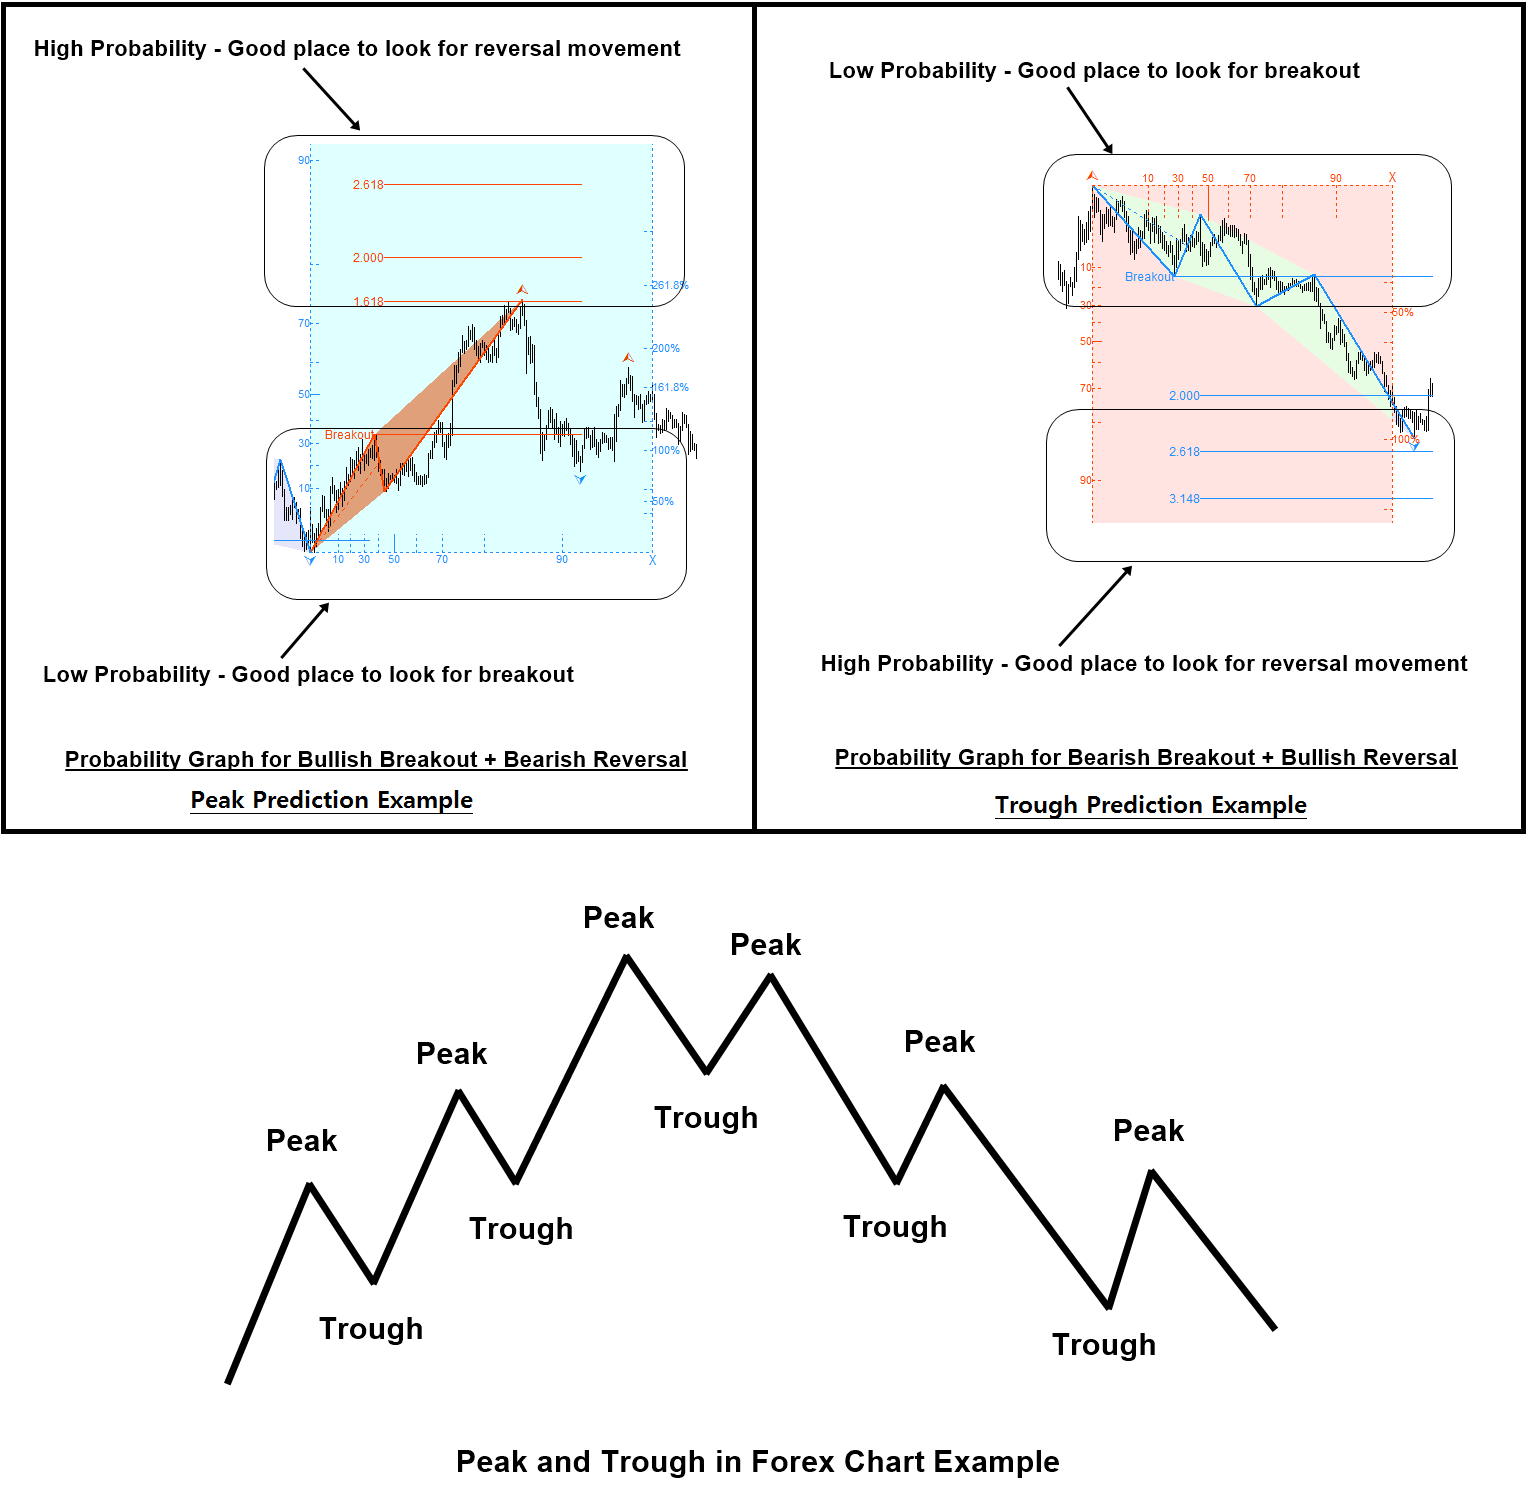
Understanding the Turning Point and Trend
As a day trader or investor, the concept of the turning point and the trend in Forex and Stock market must be understood. These two are not the independent topic from each other. It is better to view them under one subject. It is even better if you understand the concept of the momentum trading and mean reversion trading as any strategy in Forex and Stock market trading will be either one of them. You need to learn how to use them at your favor for your trading. The book: Science Of Support, Resistance, Fibonacci Analysis, Harmonic Pattern, Elliott Wave and X3 Chart Pattern (In Forex and Stock Market Trading) is exactly the book dedicated for this topic. This book will provide many examples of the turning point and trend. In addition, the book brings the concept of the trend and turning point further. It provides the detailed description on the turning point probability and the trend probability.
In the trend strategy, your entry will be at the strong trend movement during the growth phase. This might be good if our entry is not too late. However, if we are late, then we will encounter the loss from early enterers starting to materialize their profits. In the turning point strategy, we are trying to pick up the new trend as early as possible in their birth stage. Therefore, it gives you the opportunity to become the early enterer. Hence, the profitable range is longer than typical trend strategy. In addition, you can also quit your position much earlier than other trend strategy players can.
The longer profitable range means that we need fewer trades to achieve good profits. At the same time, there are some weaknesses of the turning point strategy too. For example, turning point strategy might signal buy or sell entry too early while the ongoing trend was not finished. Since both trend and turning point strategy have their own strength and weakness, it is possible that you can compromise between turning point strategy and trend strategy too. For example, you do not immediately trade at the turning point signal but you can wait until you observe that some price movement is following the new trend direction. Therefore, this becomes semi-turning point strategy. Many of good traders use semi-turning point strategy since they are the hybrid of turning point strategy and trend strategy. The fact is that skills to predict the turning point is important for the successful trading. Even though you are trading with trend strategy, it is still advantageous to have good skills in predicting turning point. Hence, the methodology of predicting turning point was sought after by many legendary traders in the financial market nearly 100 years. It is one clear piece of winning logic for successful trading helping “You act faster than other trader.”
The book can be found in all the major book distributors in the world. Please choose the best book distributor you like from the link below including amazon.com, Google Play Book, scribd.com, Apple Book and so on.
https://www.scribd.com/book/515253555/Science-Of-Support-Resistance-Fibonacci-Analysis-Harmonic-Pattern-Elliott-Wave-and-X3-Chart-Pattern
https://algotrading-investment.com/portfolio-item/science-of-support-resistance-fibonacci-analysis-harmonic-pattern/
https://www.amazon.com/dp/B0993WZGZD
After understanding the probability, we can improve your trading with either turning point probability and trend probability. The direct representation of its principle can be found from Fractal Pattern Scanner. You have the full access to the turning point probability and trend probability from Fractal Pattern Scanner to improve your trading strategy. Please have a look at the indicator.
Below is the landing page for Fractal Pattern Scanner in MetaTrader version.
https://www.mql5.com/en/market/product/49170
https://www.mql5.com/en/market/product/49169
https://algotrading-investment.com/portfolio-item/fractal-pattern-scanner/

Young Ho Seo
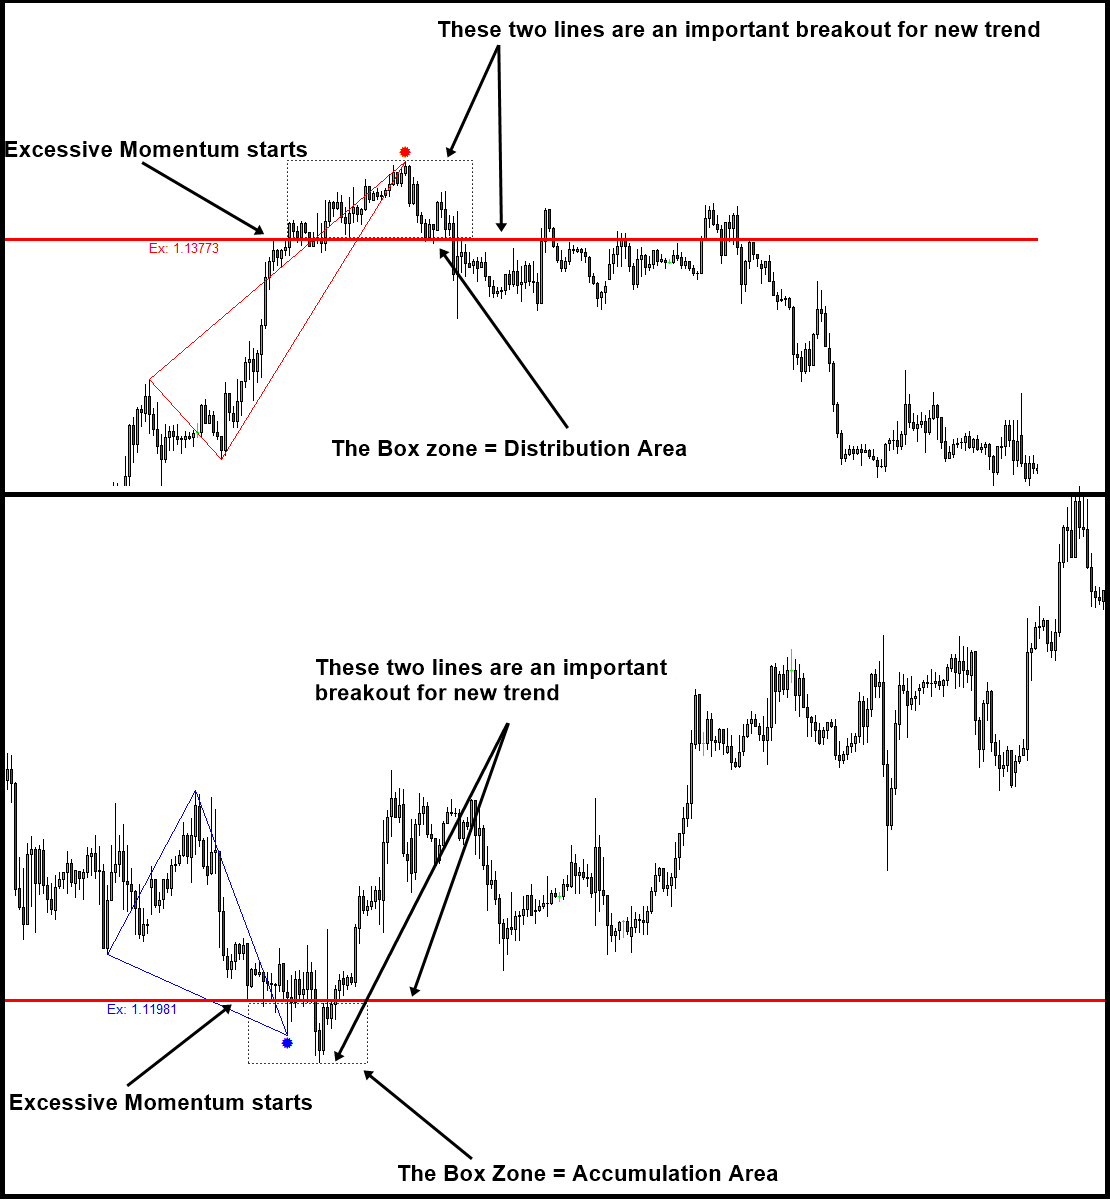
Harmonic Pattern – Turning Point and Trend
This article “Turning Point and Trend” tries to answer you on when to use Harmonic Pattern Trading in terms of the four market cycle including Birth, Growth, Maturity and Death. If you want to become profitable trader, then you need to decide when your capital to dive into the market. The best way is doing it with the market rhythm, i.e. the market cycle. This article will provide you the clear answer on how to tune your entry with the market. This is the first step for any trader in choosing their strategy in fact. You would also revise the pros and cons of the turning point strategy, semi turning point strategy and trend strategy.
https://algotrading-investment.com/2019/07/06/turning-point-and-trend/
Below are the list of automated Harmonic pattern Indicator developed for MetaTrader 4 and MetaTrader 5 platform.
Harmonic Pattern Plus
One of the first automated Harmonic Pattern detection tool released in 2014. It can detect 11 most popular harmonic patterns with well-defined trading entries and stops. Pattern Completion Interval, Potential Reversal Zone and Potential Continuation Zone are supported. In addition, other dozens of powerful features are added like Japanese candlestick detection, etc. Because of affordable price, this harmonic pattern detection indicator is loved by many traders. Please note that this is repainting and non lagging harmonic pattern trading system.
https://www.mql5.com/en/market/product/4488
https://www.mql5.com/en/market/product/4475
https://algotrading-investment.com/portfolio-item/harmonic-pattern-plus/
Harmonic Pattern Scenario planner
It is an advanced Harmonic Pattern indicator. On top of the features of Harmonic Pattern Plus, you can also predict future harmonic patterns through simulation. This is the tactical harmonic pattern tool designed for Professional harmonic pattern trader. Because of affordable price, this harmonic pattern detection indicator is loved by many traders. Please note that this is repainting and non lagging harmonic pattern trading system.
https://www.mql5.com/en/market/product/6240
https://www.mql5.com/en/market/product/6101
https://algotrading-investment.com/portfolio-item/harmonic-pattern-scenario-planner/
Both Harmonic pattern plus and Harmonic Pattern Scenario planner are the excellent trading system at affordable cost. However, if you do not like repainting Harmonic pattern indicator, then we also provide the non repainting and non lagging harmonic pattern trading. Just check the X3 Chart Pattern Scanner below.
Link to X3 Chart Pattern Scanner
https://www.mql5.com/en/market/product/41993
https://www.mql5.com/en/market/product/41992
https://algotrading-investment.com/portfolio-item/profitable-pattern-scanner/

Young Ho Seo

Winning Trading Logic – Detecting Supply and Demand Unbalance
As we have pointed out in our article, detecting the supply and demand unbalance is the most important key in making profits in Financial market. The excessive momentum indicator is the automated tool to detect these unbalance in supply and demand for your trading. With excessive momentum drawn in your chart, it is much easier to predict the timing of new trend and its direction.
Here is the insightful article explaining where the profits comes and how the profits are captured with the knowledge of excessive momentum. If you really want to make money in the market, must read this article. Reading does not cost you anything.
https://algotrading-investment.com/2018/10/29/introduction-to-excessive-momentum-trading/
Here is link to Excessive Momentum Indicator.
https://algotrading-investment.com/portfolio-item/excessive-momentum-indicator/
https://www.mql5.com/en/market/product/30641
https://www.mql5.com/en/market/product/30621

Young Ho Seo
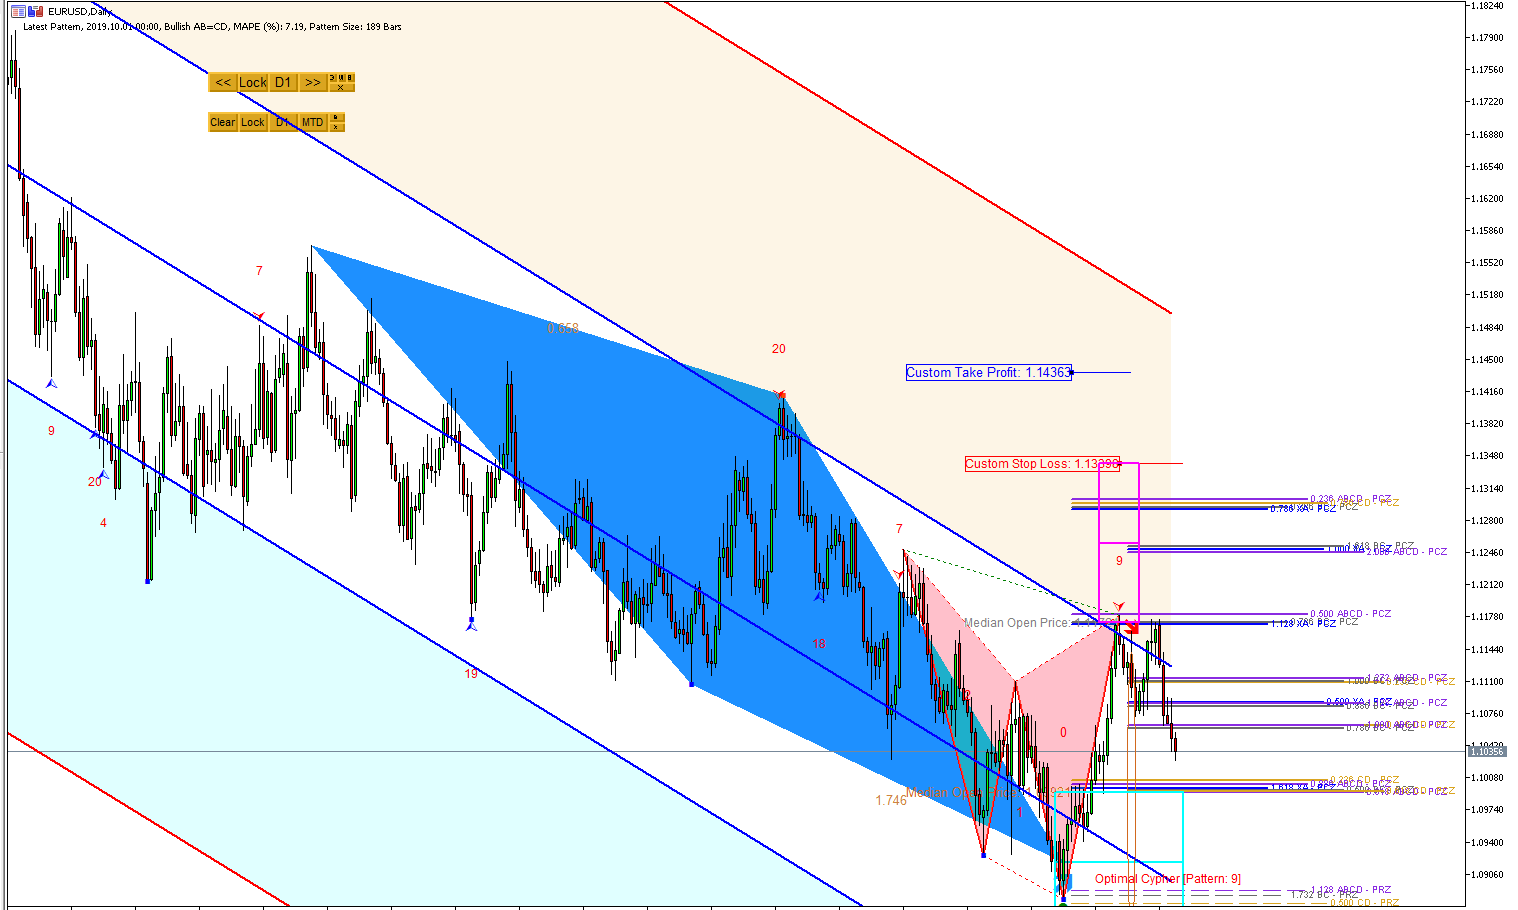
Science of Harmonic Pattern in Forex and Stock Market
Harmonic Pattern in Forex and Stock market is an advanced technique for your trading although it is hard to find out any scientific reference to its usage. We know that harmonic pattern is originated from Fibonacci Ratio Analysis. However, that is not sufficient to bring your harmonic pattern trading to another level. There is a need to pin down the harmonic pattern in terms of the science, that are the price dynamics and cycles.
Although the harmonic pattern are used by many successful trading strategies, no book or article will really pin down the science behind the harmonic pattern. The book: Science Of Support, Resistance, Fibonacci Analysis, Harmonic Pattern, Elliott Wave and X3 Chart Pattern (In Forex and Stock Market Trading) is exactly the book dedicated for this topic. This book will tell you the wisdom behind the harmonic pattern in Forex and Stock market trading.
Understanding the scientific principle always help you to bring it further than other traders. This book incorporates the price dynamics and cycles to explain why and how the harmonic patterns are formed in your chart. This also covers why the harmonic pattern and other Fibonacci based patterns are repainting. The book also provides how to detect them as well as how to trade them.
The book can be found in all the major book distributors in the world. Please choose the best book distributor you like from the link below including amazon.com, Google Play Book, scribd.com, Apple Book and so on.
https://www.scribd.com/book/515253555/Science-Of-Support-Resistance-Fibonacci-Analysis-Harmonic-Pattern-Elliott-Wave-and-X3-Chart-Pattern
https://algotrading-investment.com/portfolio-item/science-of-support-resistance-fibonacci-analysis-harmonic-pattern/
https://www.amazon.com/dp/B0993WZGZD
Harmonic patterns are another fractal wave patterns that frequently used by many financial traders. Harmonic patterns are typically made up from two or three triangles (i.e. three price swings or four price swings). The structures of the harmonic pattern are based on the Fibonacci ratios. Hence, some people consider Harmonic pattern as an advanced Fibonacci price patterns.
Harmonic Pattern Detection could be tedious process if you have to do them manually. You can use the automated tool for your trading. If you are looking for the Harmonic Pattern Scanner, then here are some choice between repainting harmonic pattern scanner and non repainting harmonic pattern scanner. We present one repainting and one non repainting harmonic pattern scanner for your information below.
1. Harmonic Pattern Plus (2014)
Harmonic pattern plus is extremely good product for the price although this is repainting harmonic pattern indicator. With dozens of powerful features including Pattern Completion Interval, Potential Reversal Zone, Potential Continuation Zone, Automatic Stop loss and take profit sizing.
Below are the Links to Harmonic Pattern Plus
https://www.mql5.com/en/market/product/4488
https://www.mql5.com/en/market/product/4475
https://algotrading-investment.com/portfolio-item/harmonic-pattern-plus/
2. X3 Chart Pattern Scanner (2019)
X3 Chart Pattern Scanner is next generation tools to trade with X3 price patterns in Forex market. With non repainting and non lagging algorithm, this tool can detect with advanced Harmonic Pattern, Elliott Wave Pattern, X3 Pattern structure for your trading. As a bonus, it provides your Japanese candlestick patterns too. X3 Chart Pattern Scanner is type 4 harmonic pattern indicator, which means that you can fine tune your strategy using historical patterns while you are trading the same patterns on live trading.
https://www.mql5.com/en/market/product/41993
https://www.mql5.com/en/market/product/41992
https://algotrading-investment.com/portfolio-item/profitable-pattern-scanner/

Young Ho Seo
Volume Spread Analysis Indicator List
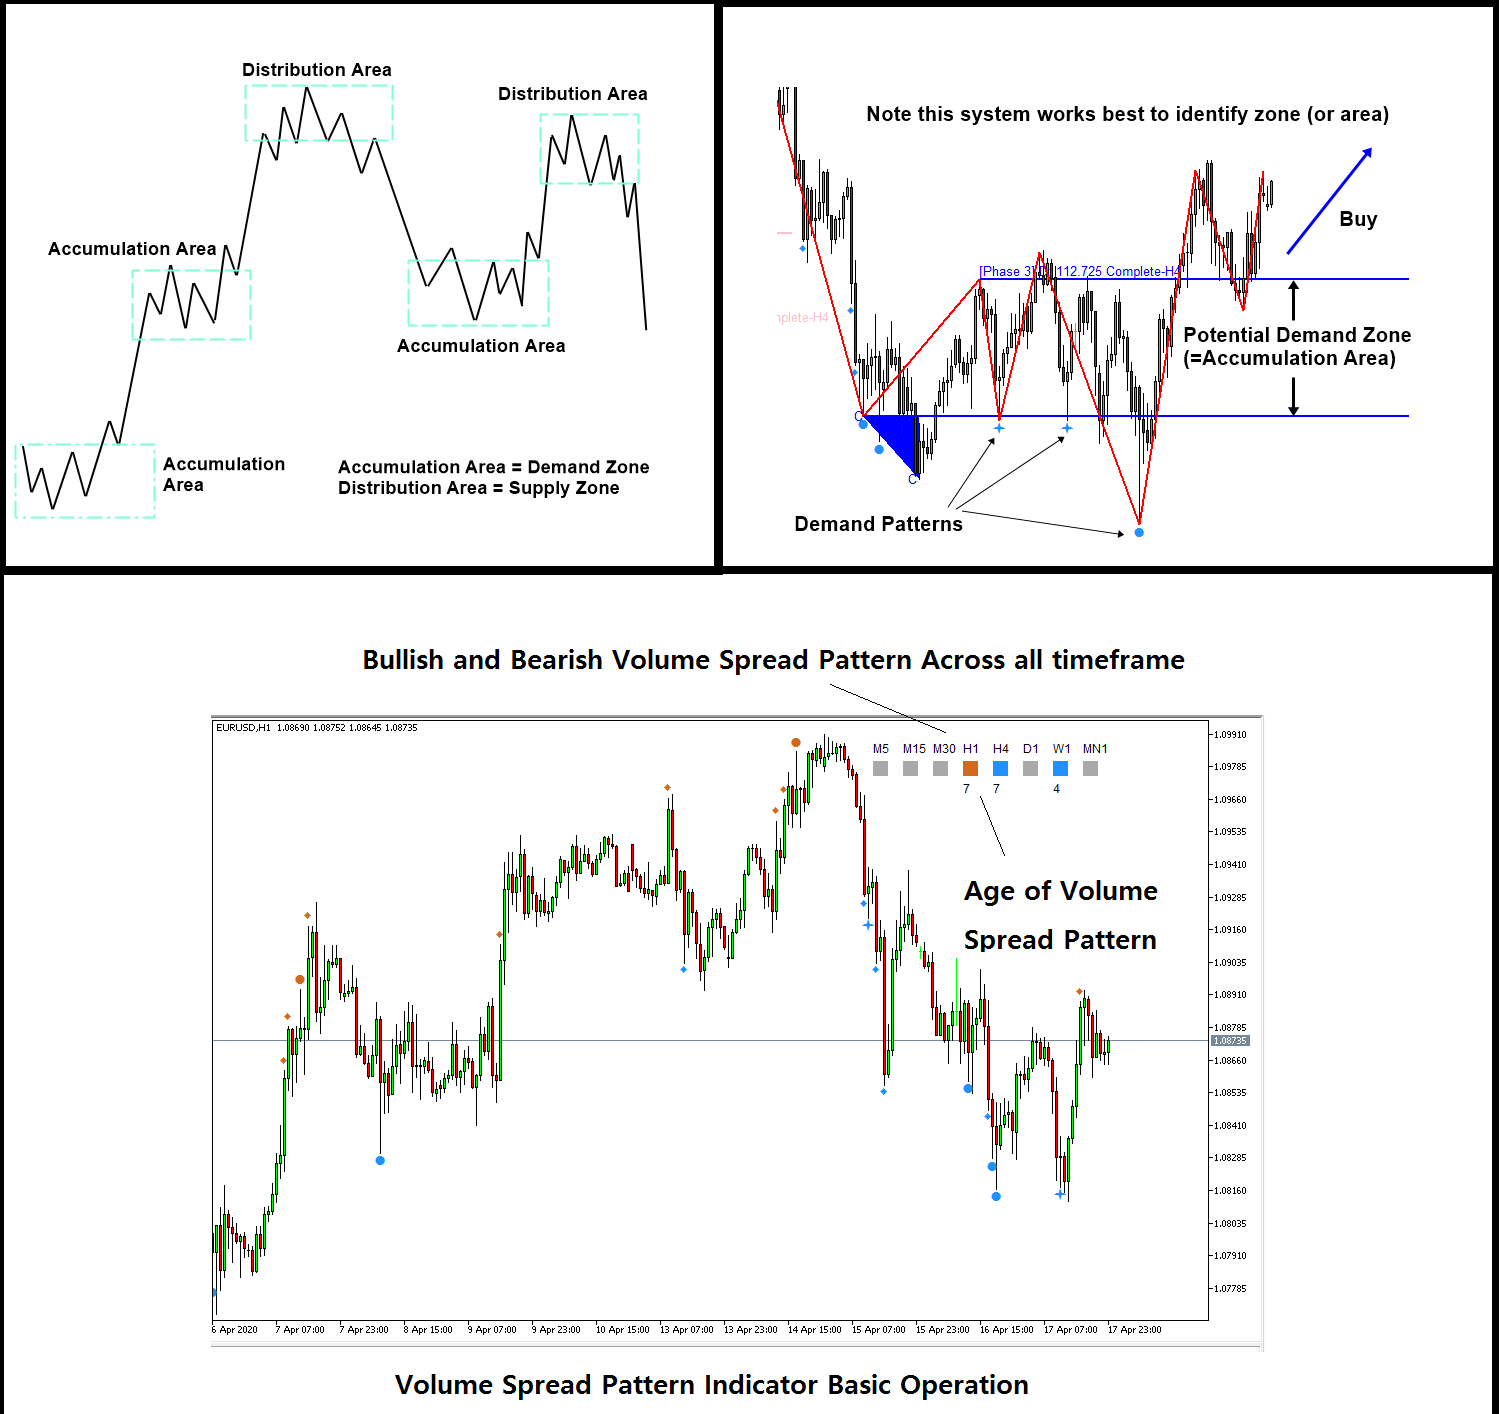
We provide three different Volume Spread Analysis indicators and volume based tools. Our volume spread analysis tools are the hybrid of volume spread analysis and signal processing theory.
These tools will help you to complete your trading decision with high precision. As long as you understand the concept of the Accumulation and Distribution area in the volume spread analysis, these tools will help you to predict the presence of Accumulation and Distribution area. Hence, you can predict the best trading opportunity.
Firstly, Volume Spread Pattern Indicator is the powerful volume spread analysis indicator that operated across multiple timeframe. Volume Spread Pattern Indicator will not only provide the bearish and bullish volume spread pattern in the current time frame but also it will detect the same patterns across all timeframe. You just need to open one chart and you will be notified bullish and bearish patterns in all timeframe in real time.
Here is the link to Volume Spread Pattern Indicator.
https://www.mql5.com/en/market/product/32961
https://www.mql5.com/en/market/product/32960
https://algotrading-investment.com/portfolio-item/volume-spread-pattern-indicator/
Secondly, Volume Spread Pattern Detector is the light version of Volume Spread Pattern Indicator above. This is free tool with some limited features. However, Volume Spread Pattern Detector is used by thousands of traders. Especially, it works great with the support and resistance to confirm the turning point. This is free tool. Just grab one.
https://www.mql5.com/en/market/product/28438
https://www.mql5.com/en/market/product/28439
https://algotrading-investment.com/portfolio-item/volume-spread-pattern-detector/
Both Volume Spread Pattern Indicator and Volume Spread Pattern Detector works well with Excessive Momentum indicator as Excessive Momentum indicator helps to detect the potential Accumulation and Distribution area automatically. Hence, if you are using Excessive Momentum Indicator, then you must use one between Volume Spread Pattern Indicator or Volume Spread Pattern Detector.
Here is link to Excessive Momentum Indicator.
https://algotrading-investment.com/portfolio-item/excessive-momentum-indicator/
https://www.mql5.com/en/market/product/30641
https://www.mql5.com/en/market/product/30621
Thirdly, we provide the volume Zone Oscillator. This is another useful free tool that utilizes the volume information for your trading. You can use these tools for volume spread analysis, Harmonic Pattern, Elliott Wave Pattern, X3 Price Pattern further. This is free tool. Just grab one.
https://algotrading-investment.com/portfolio-item/volume-zone-oscillator/

Young Ho Seo
Automatic Resizing your Stop Loss and Take Profit Level with Harmonic Pattern Plus (Harmonic Pattern Scenario Planner)
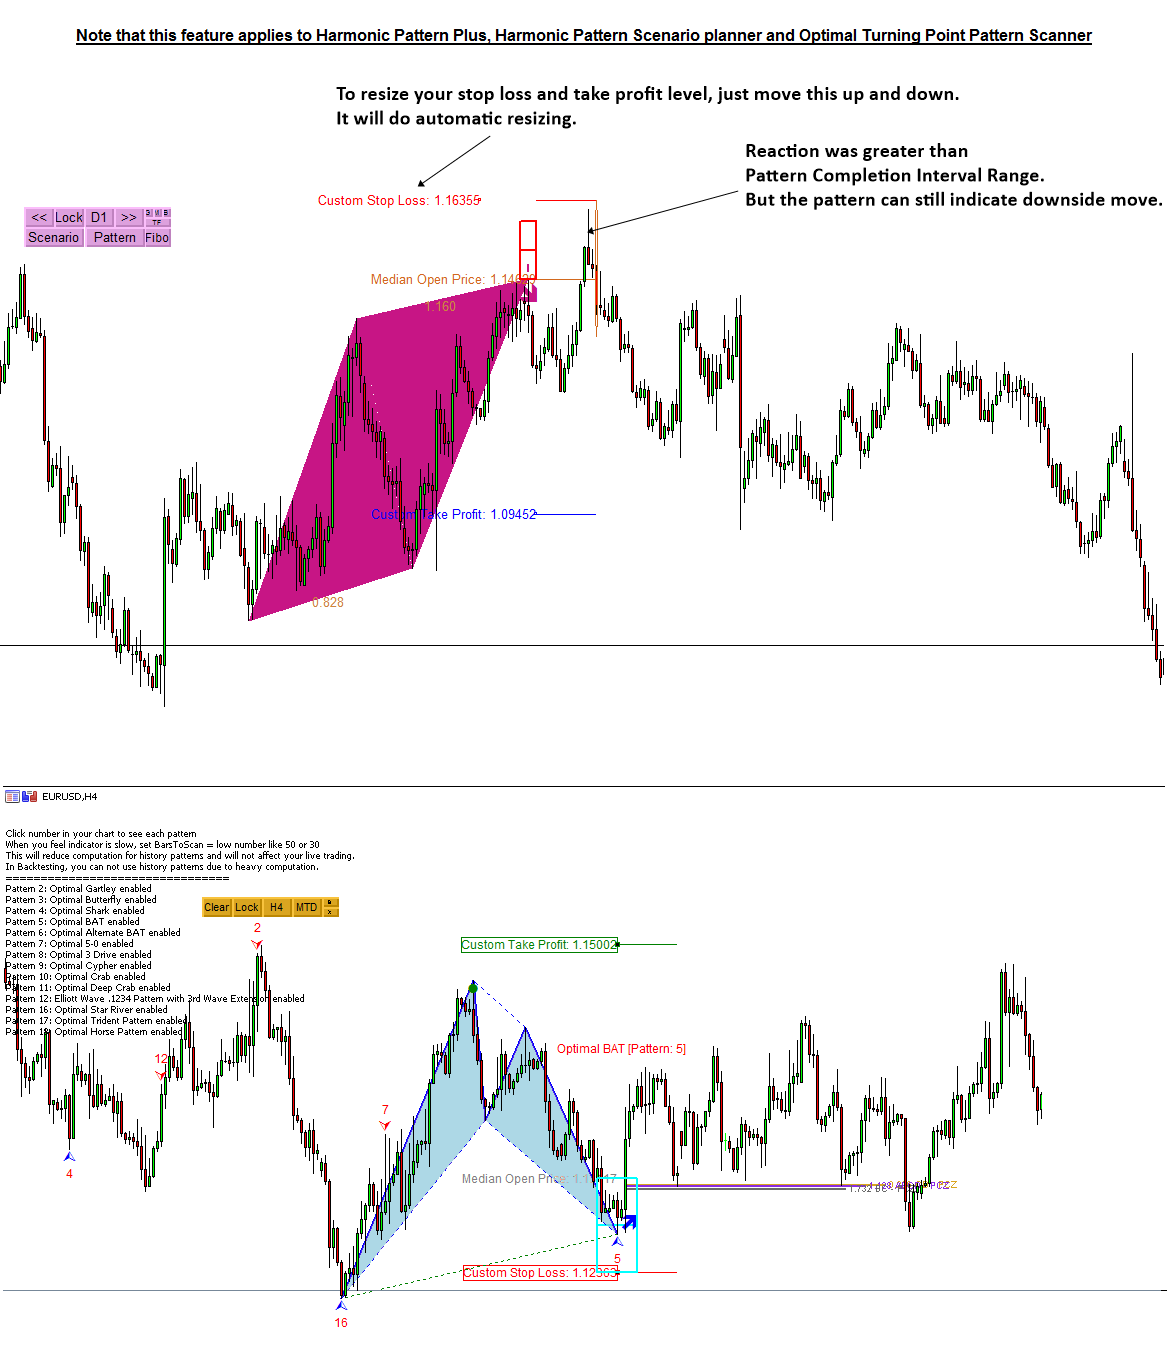
Having understood all the concept behind the Pattern Completion Interval, you might observe that sometime price can react outside the pattern completion interval. Sure, there is nothing perfect in the world. As long as you understand the pros and cons of using large stop loss size, it is still fine to control your own stop loss size.
However, we still prefer to express stop loss size in terms of pattern completion interval range for convenience. For example, if the original stop loss size was equal to 1 x pattern completion interval, you can certainly use 1.5 x pattern completion interval or 2 x pattern completion interval.
Another consideration before you are using pattern completion interval, if you can enter the market at the competitive price, then you can feel less guilty when you increase your stop loss size because you are still remaining good rewards/Risk ratio. On the other hands, if you have entered market at not so competitive price, then you might be cautious when you increase your stop loss size.
The same feature applies to X3 Chart Pattern Scanner (Non Repainting and Non Lagging Harmonic Pattern and Elliott Wave pattern scanner.)
Harmonic Pattern Plus
https://www.mql5.com/en/market/product/4488
https://www.mql5.com/en/market/product/4475
https://algotrading-investment.com/portfolio-item/harmonic-pattern-plus/
Harmonic Pattern Scenario Planner
https://www.mql5.com/en/market/product/6101
https://www.mql5.com/en/market/product/6240
https://algotrading-investment.com/portfolio-item/harmonic-pattern-scenario-planner/
X3 Chart Pattern Scanner
https://www.mql5.com/en/market/product/41993
https://www.mql5.com/en/market/product/41992
https://algotrading-investment.com/portfolio-item/profitable-pattern-scanner/

Young Ho Seo
Science of Fibonacci Analysis in Forex and Stock Market
Fibonacci Analysis in Forex and Stock market is an important technique for your trading although it is hard to find out any scientific reference to its usage. However, for sure, you will often find that the price reaction around the Fibonacci ratio is the key to successful trading as well as the profit taking. At the same time, understanding the Fibonacci analysis open up your knowledge gate for Harmonic Pattern, Elliott Wave and X3 Chart Pattern as well as other price pattern.
A Fibonacci analysis is a popular tool among technical traders. It is based on the Fibonacci sequence numbers identified by Leonardo Fibonacci, the Italian mathematician, in the 13th century. The Fibonacci sequence numbers are: 0, 1, 1, 2, 3, 5, 8, 13, 21, 34, 55, 89,144, 233, 377, 610, 987, 1597, 2584, 4181, 6765, ………………… As the Fibonacci number become large, the constant relationship is established between neighbouring numbers. The relationship converges to the Golden ratio, 0.618 (or 1.618).
Although the Fibonacci Analysis are the key to successful trading, no book or article will really pin down the science behind the Fibonacci Analysis. The book: Science Of Support, Resistance, Fibonacci Analysis, Harmonic Pattern, Elliott Wave and X3 Chart Pattern (In Forex and Stock Market Trading) is exactly the book dedicated for this topic. This book will tell you the untold story of the Fibonacci Analysis, which will become the valuable wisdom for Forex and Stock market trading.
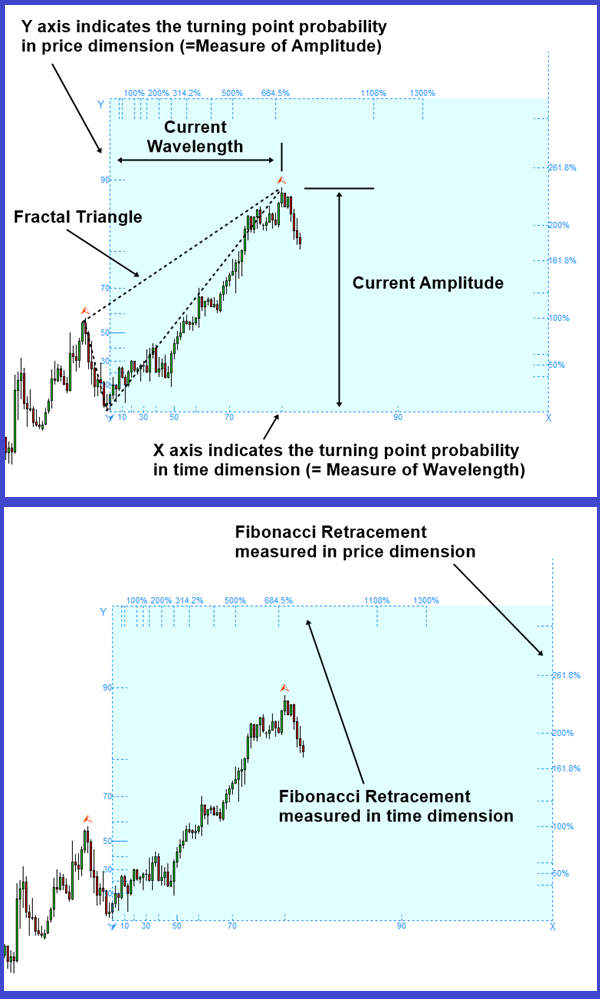
Understanding the scientific principle always help you to bring it further than other traders. In this book, we shows the Fibonacci Retracement in price dimension and Fibonacci Retracement in time dimension. Using the Fibonacci-Probability Graph, you will find the ways to combine the turning point probability with the Fibonacci Retracement in price dimension and Fibonacci Retracement in time dimension.
The book can be found in all the major book distributors in the world. Please choose the best book distributor you like from the link below including amazon.com, Google Play Book, scribd.com, Apple Book and so on.
https://algotrading-investment.com/portfolio-item/science-of-support-resistance-fibonacci-analysis-harmonic-pattern/
https://play.google.com/store/books/details?id=MME3EAAAQBAJ
https://www.amazon.com/dp/B0993WZGZD
Fibonacci-Probability graph is exclusively available from Fractal Pattern Scanner in MetaTrader 4 and MetaTrader 5. It could be used to identify the turning point and breakout opportunity. Below is the landing page for Fractal Pattern Scanner in MetaTrader version.
https://www.mql5.com/en/market/product/49170
https://www.mql5.com/en/market/product/49169
https://algotrading-investment.com/portfolio-item/fractal-pattern-scanner/

Young Ho Seo
Powerful Non Repainting Supply Demand Zone MetaTrader Indicator
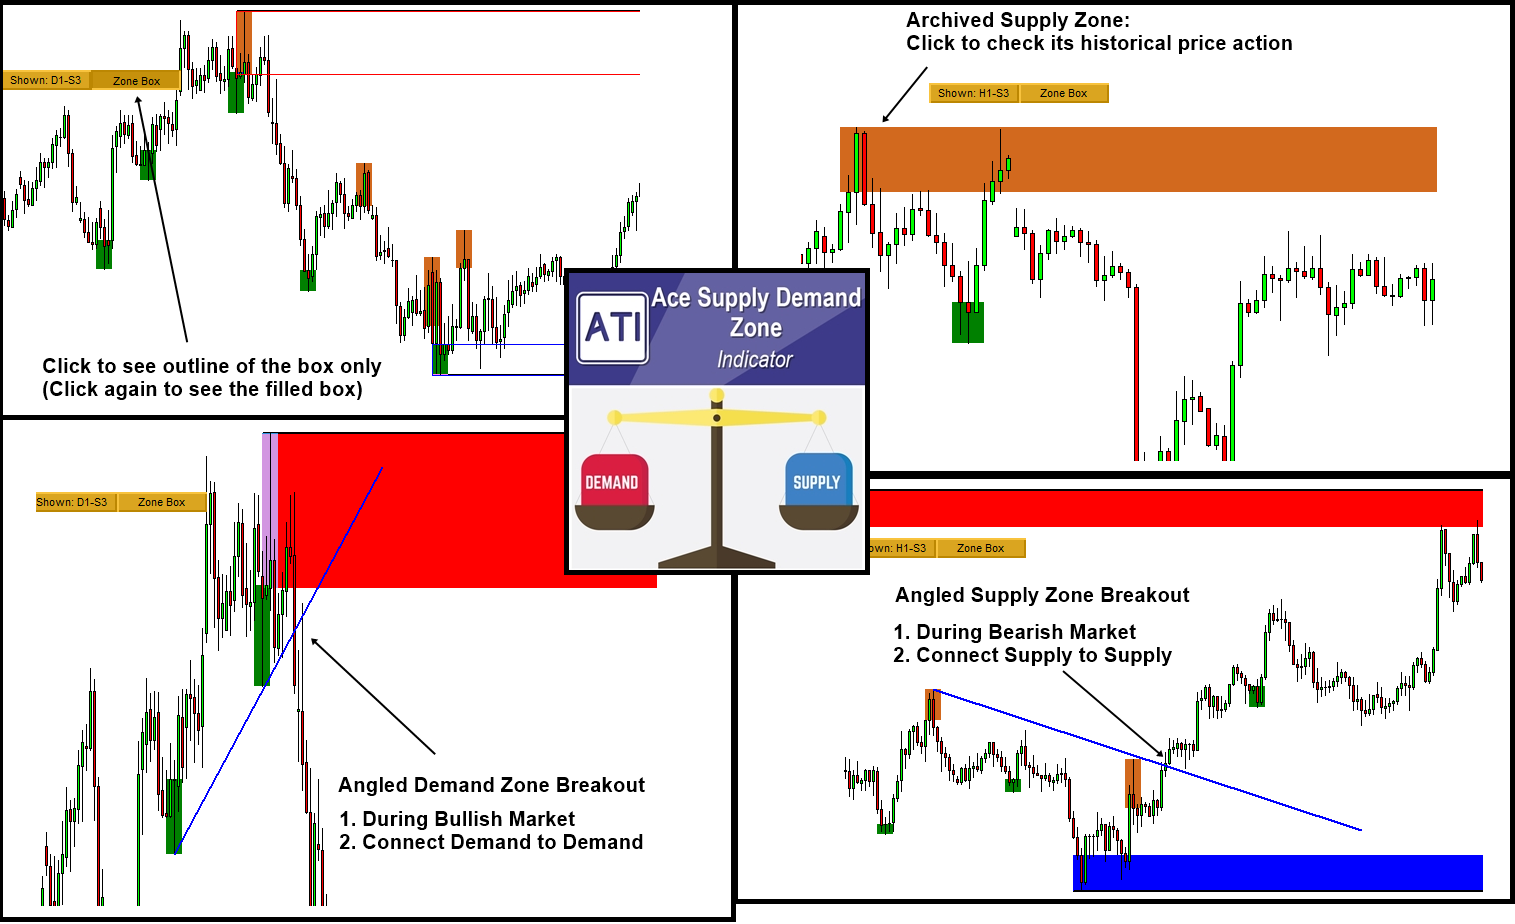
Ace Supply Demand Zone is specially designed non-repainting Supply Demand indicator. Since you have an access to fresh supply and demand zone as well as archived supply demand zone, you can achieve much better profiling on price movement in Forex market.
With the Ability to trade the original supply demand zone trading, you can also perform highly accurate Angled Supply Demand zone trading as a bonus. With a lot of sophisticated gadgets built inside, Ace Supply Demand Zone indicator will provide you unmatched performance against other Supply Demand zone indicator out there.
Here is the link to Ace Supply Demand Zone Indicator.
https://www.mql5.com/en/market/product/40076
https://www.mql5.com/en/market/product/40075
https://algotrading-investment.com/portfolio-item/ace-supply-demand-zone/

Young Ho Seo
Repainting and Non Repainting Harmonic Pattern Indicator
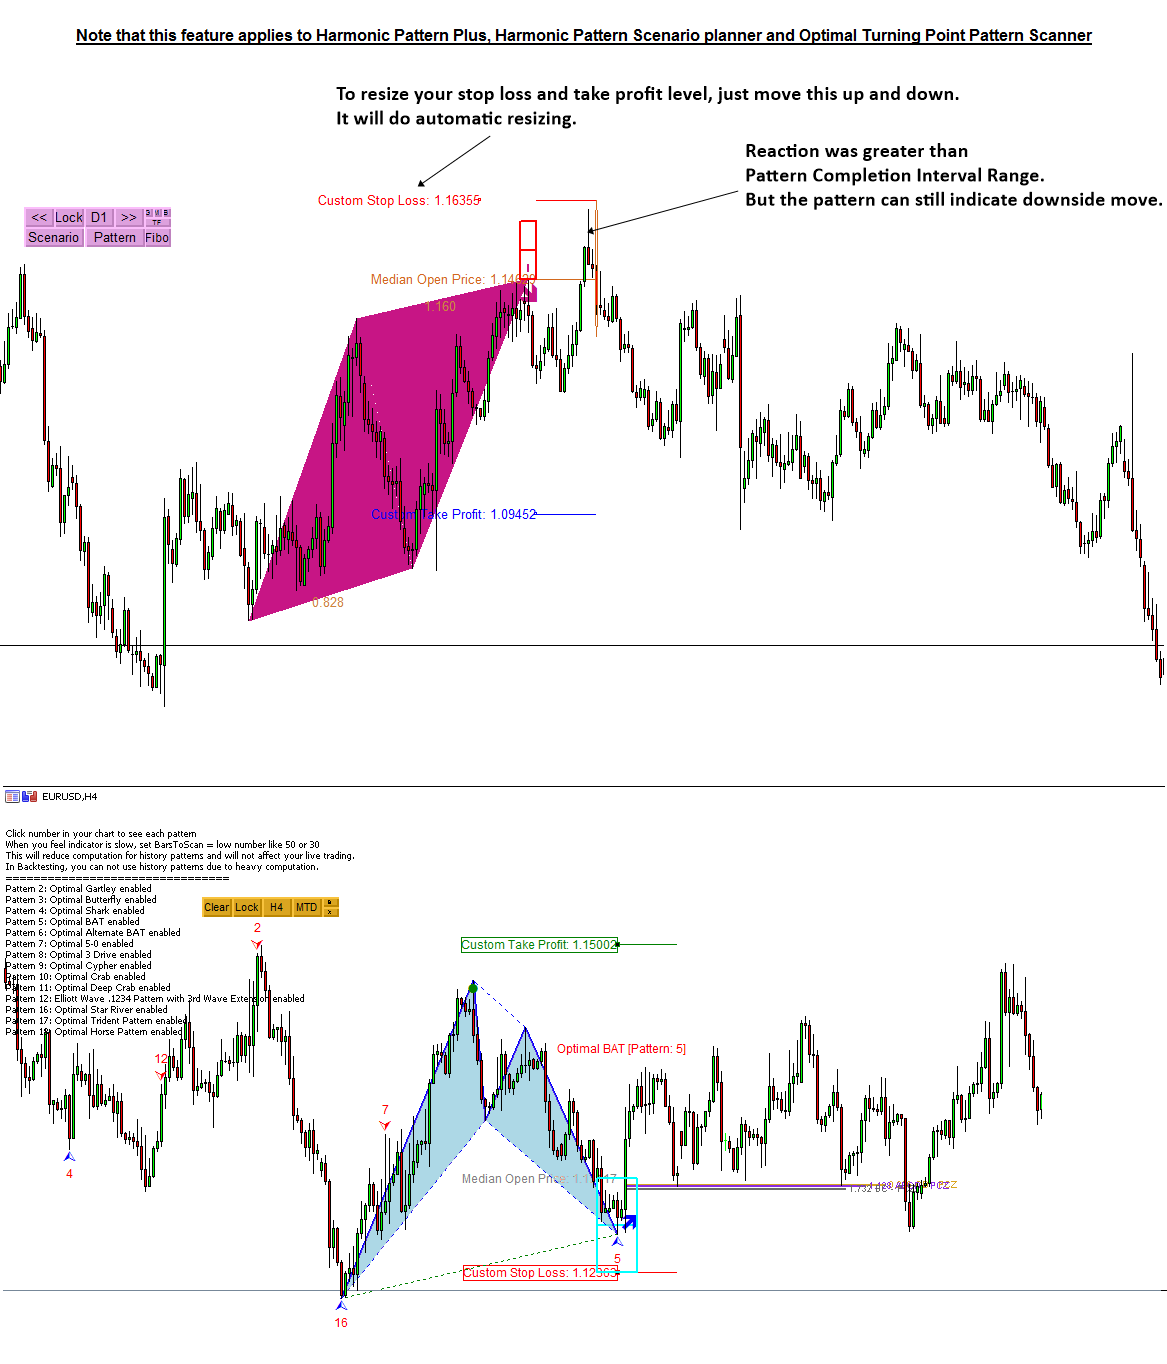
Here is some quick guide on repainting and non repainting Harmonic Pattern indicators. Pattern Scanner based on Fractal Wave detection algorithm can be either repainting or non repainting one. In our products, we provide two choices between repainting and non repainting. Their capability and their price is different.
For Harmonic Pattern Scanner,
Harmonic Pattern Plus (and also Harmonic Pattern Scenario Planner) is the powerful but they are the repainting Harmonic Pattern Scanner. At the same time, they are cheaper. Below is links for them.
https://www.mql5.com/en/market/product/4488
https://www.mql5.com/en/market/product/4475
https://algotrading-investment.com/portfolio-item/harmonic-pattern-plus/
X3 Chart Pattern Scanner is non repainting and non lagging Harmonic Pattern and X3 pattern Scanner. Below is links for them.
https://www.mql5.com/en/market/product/41993
https://www.mql5.com/en/market/product/41992
https://algotrading-investment.com/portfolio-item/profitable-pattern-scanner/
Typically it is easier to trade with non repainting and non lagging Harmonic Pattern indicator. Of course, the signal will be reserved once they are detected. Hence, if you do not mind the cost, we recommend to use X3 Chart Pattern Scanner since it is non repainting Harmonic Pattern and X3 pattern indicator.
However, if you do not mind repainting Harmonic Pattern Indicator and you want to have something cheaper, then use Harmonic Pattern Plus (or Harmonic Pattern Scenario Planner). Many traders are still do not mind to use the repainting Harmonic Pattern Indicator. They are cheaper too.
If you are starter, we do recommend using non repainting Harmonic Pattern Scanner like X3 Chart Pattern Scanner. It is easier to trade with non repainting indicator. At the same time, there are a lot of bonus features inside X3 Chart Pattern Scanner too.
For your information, we are the only one who supply non repainting and non lagging Harmonic Pattern Indicator in the world. Of course, the first one in the world too.

Young Ho Seo
Science of Support and Resistance
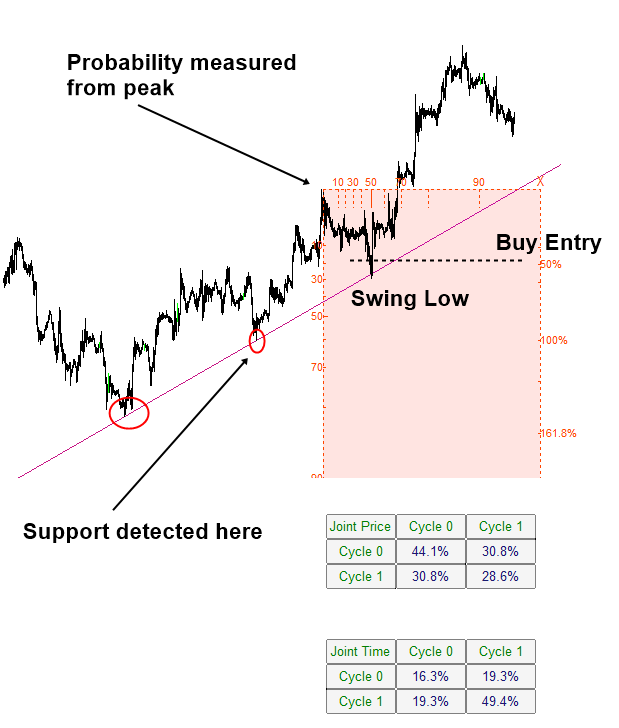
Have you ever thought what is the underlying science for Support and Resistance ? Without understanding the science of support and resistance, how can you improve your trading with support and resistance ? Although the support and resistance are the key to successful trading, no book or article will really pin down the science behind the support and resistance. The book: Science Of Support, Resistance, Fibonacci Analysis, Harmonic Pattern, Elliott Wave and X3 Chart Pattern (In Forex and Stock Market Trading) is exactly the book dedicated for this topic. This book will tell you the untold story of the support and resistance, which will become the valuable wisdom for Forex and Stock market trading.
First of all, when we want to improve anything in our life, it often requires to understand the science behind the subject. Likewise, the scientific understanding of the support and resistance can improve our practical trading marginally. The book will provide the intertwined illustration between trading strategy and the scientific theory. In addition, the book will also provide the many chart examples along with many useful contents towards your practical trading. We recommend reading this book as the first guide for every trader and investor in Forex and Stock market.
The book can be found in all the major book distributors in the world. Please choose the best book distributor you like from the link below including amazon.com, Google Play Book, scribd.com, Apple Book and so on.
https://algotrading-investment.com/portfolio-item/science-of-support-resistance-fibonacci-analysis-harmonic-pattern/
https://play.google.com/store/books/details?id=MME3EAAAQBAJ
Support is the price level at which buying is stronger than selling. Hence, the declining of the price below the support levels is often refused. Typically, support level is located below the current market price. Likewise, resistance is the price level at which selling is stronger than buying. Hence, the rising of the price above the resistance level is often refused. Typically, the resistance level is located above the current market price. In fact, several support and resistance techniques are the geometric pattern recognition derived from the fractal wave analysis. However, not all the support resistance techniques are the same cases.
When we say the support and resistance in the geometric pattern or chart pattern recognition, we are talking about identifying support and resistance line by connecting peak to peak or by connecting trough to trough in our chart. After the peak trough transformation is applied, the support line can be identified by connecting two or more number of troughs aligned horizontally. Conservative approach is connecting more than three troughs aligned horizontally. Price can make either a turning point or breakout around the support line. It is the area where the market energy is converging before exploding. With this potentially high energy, the support line often serves as an efficient trading entry as well as an exit. Whenever we recognize the important support line, we need to actively think about the market timing as well as the position size.
After understanding the science, we can improve your support and resistance trading of course in many different ways. One way we did it was to combine the turning point probability and trend probability with support and resistance. The direct representation of its principle can be found from our Fractal Pattern Scanner. You have the full access to the turning point probability and trend probability from Fractal Pattern Scanner to improve your support and resistance trading. Please have a look at the indicator.
Below is the landing page for Fractal Pattern Scanner in MetaTrader version.
https://www.mql5.com/en/market/product/49170
https://www.mql5.com/en/market/product/49169
https://algotrading-investment.com/portfolio-item/fractal-pattern-scanner/

Young Ho Seo
Scan and search future harmonic patterns with Harmonic Pattern Scenario Planner
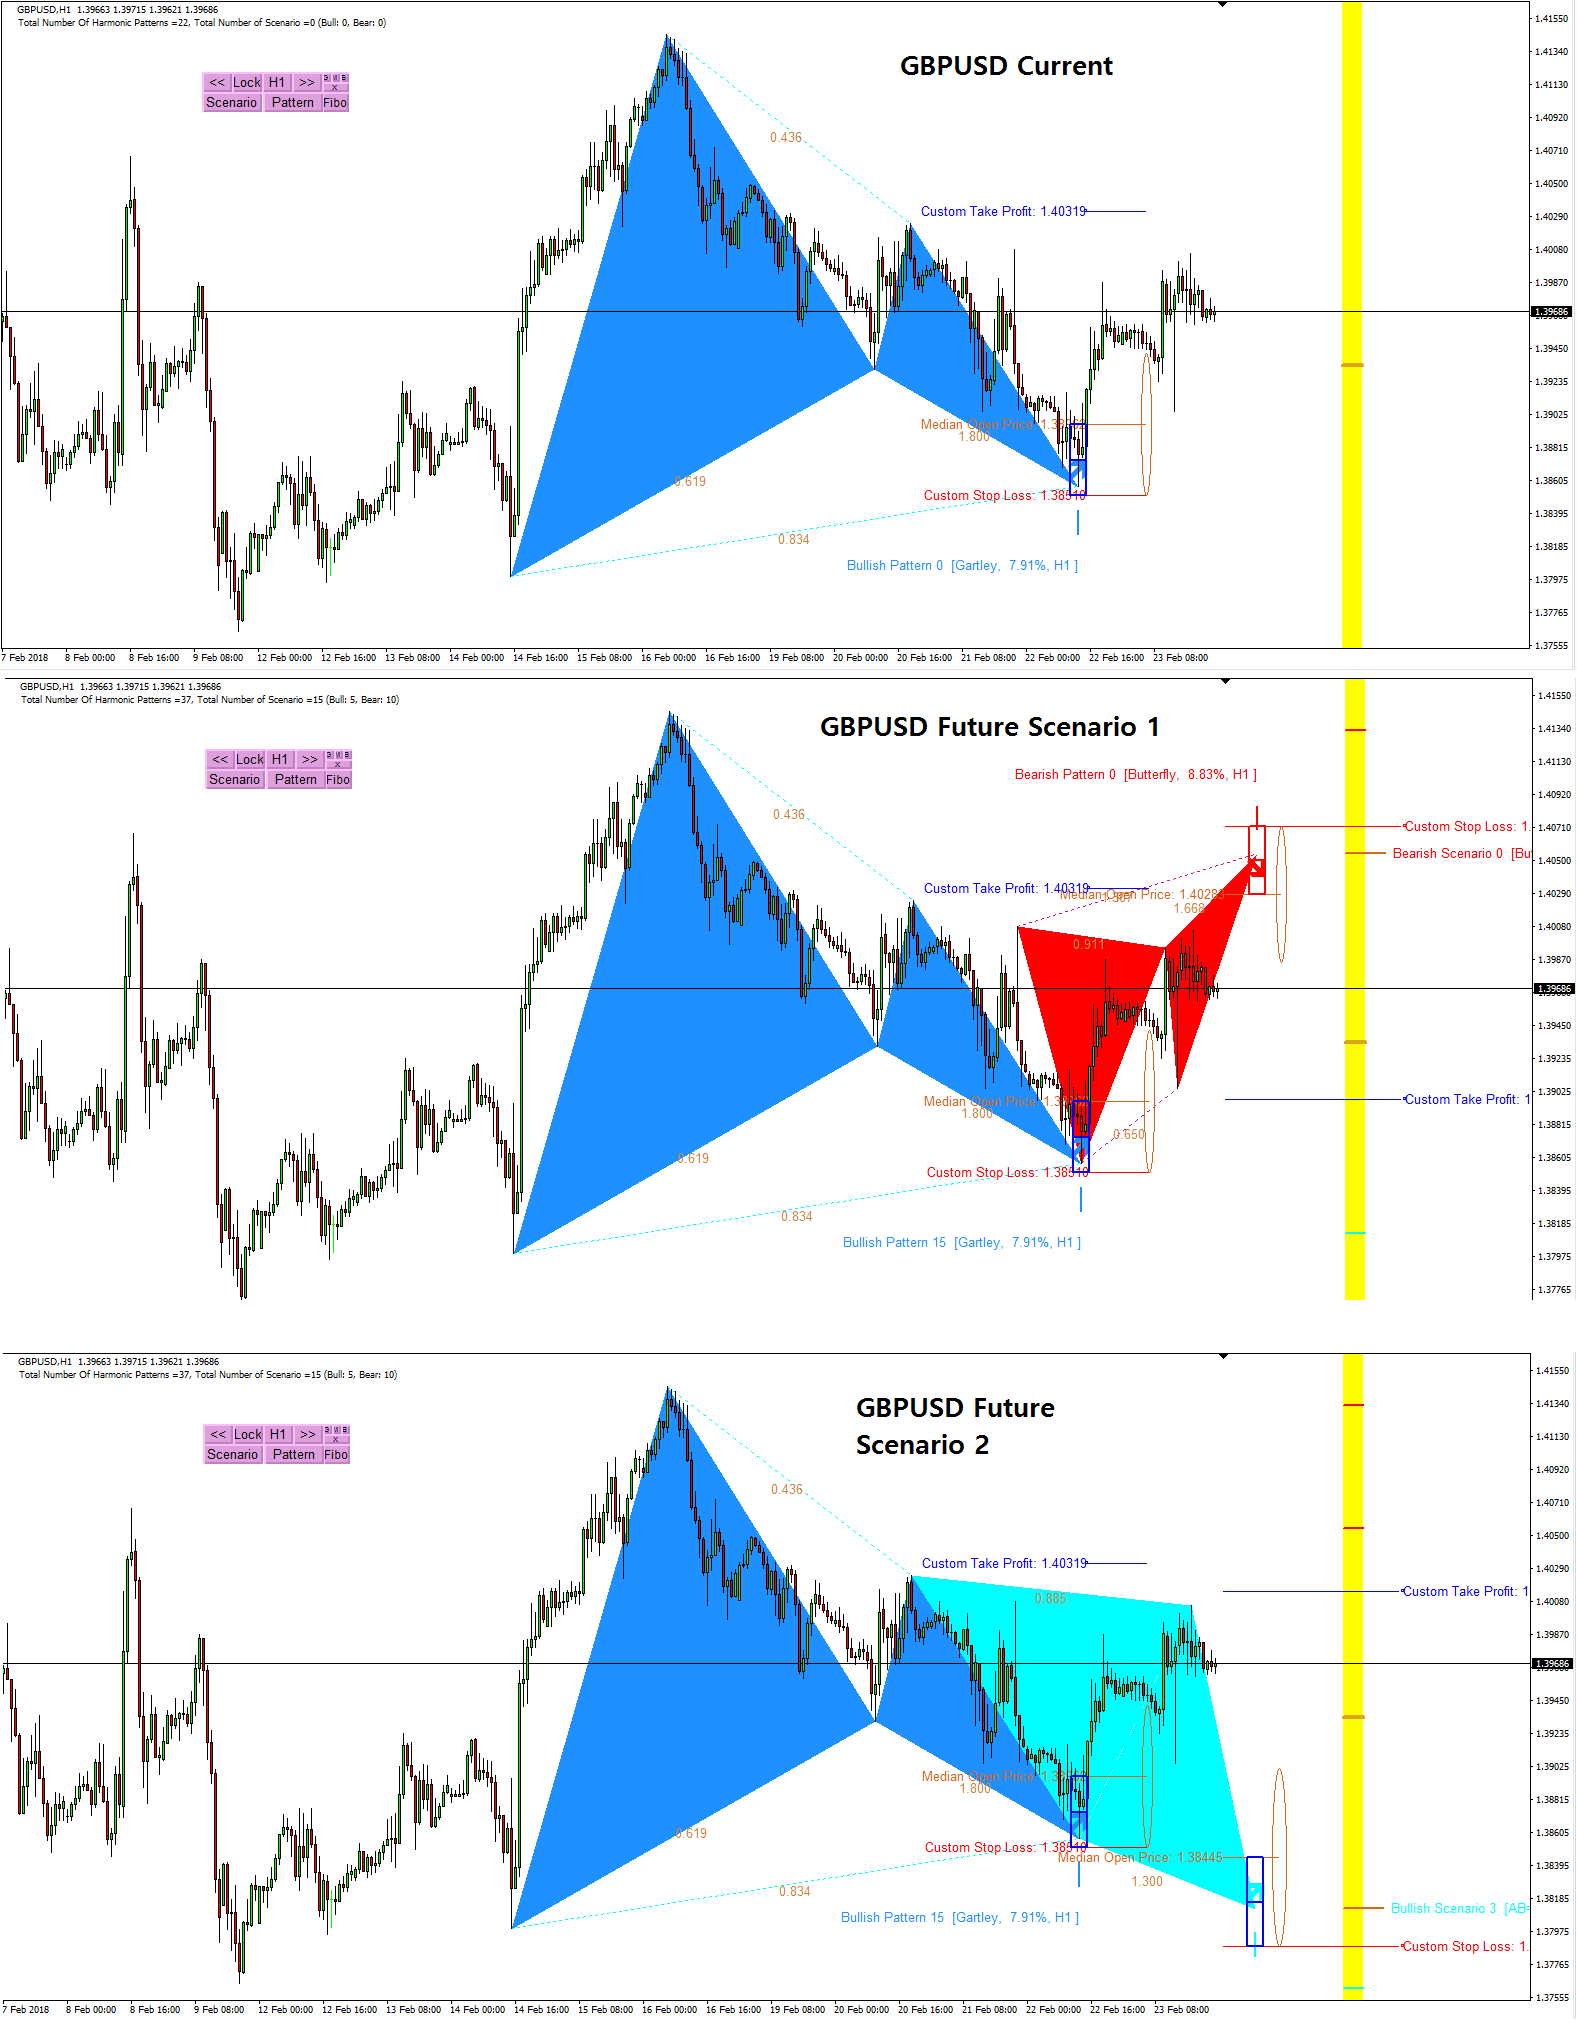
Harmonic Pattern Scenario Planner is a tool you can scan and search future harmonic patterns in just one button click. It would detect any potential future harmonic patterns in your search range using the algorithm like Monte Carlo simulation. You can even get the potential take profit and stop loss of the future patterns even before they form. What is even more, you can use all the features and functionality of harmonic pattern plus from your harmonic pattern scenario planner too.
Have watched this interesting movie called “Next” ? Check out the guy can see the few minutes into the futures. How powerful the 2 minutes vision for future is. Predicting future is very tactical game but it is hard because future keep changing based on the presents. However, it is definitely an interesting game. As a trader, you can gain a lot of advantage over other traders by predicting futures.
http://www.imdb.com/title/tt0435705/
This movie like predicting concept was equipped in our Harmonic Pattern Scenario Planner. check the power of predictive harmonic pattern for your trading. We are only one selling this future predictive harmonic pattern scanner in the universe.
https://algotrading-investment.com/portfolio-item/harmonic-pattern-scenario-planner/
https://www.mql5.com/en/market/product/6101
https://www.mql5.com/en/market/product/6240
Harmonic Pattern Scenario Planner is a tool you can scan and search future harmonic patterns in just one button click. It would detect any potential future harmonic patterns in your search range using the algorithm like Monte Carlo simulation. You can even get the potential take profit and stop loss of the future patterns even before they form. What is even more, you can use all the features and functionality of harmonic pattern plus from your harmonic pattern scenario planner too.
Have watched this interesting movie called “Next” ? Check out the guy can see the few minutes into the futures. How powerful the 2 minutes vision for future is. Predicting future is very tactical game but it is hard because future keep changing based on the presents. However, it is definitely an interesting game. As a trader, you can gain a lot of advantage over other traders by predicting futures.
http://www.imdb.com/title/tt0435705/
This movie like predicting concept was equipped in our Harmonic Pattern Scenario Planner. check the power of predictive harmonic pattern for your trading. We are only one selling this future predictive harmonic pattern scanner in the universe.
https://algotrading-investment.com/portfolio-item/harmonic-pattern-scenario-planner/
https://www.mql5.com/en/market/product/6101
https://www.mql5.com/en/market/product/6240

: