JCStatistics
- Indikatoren
- Version: 5.0
- Aktualisiert: 28 Juni 2023

JCStatistik
Vereinfachte und traditionelle Statistik
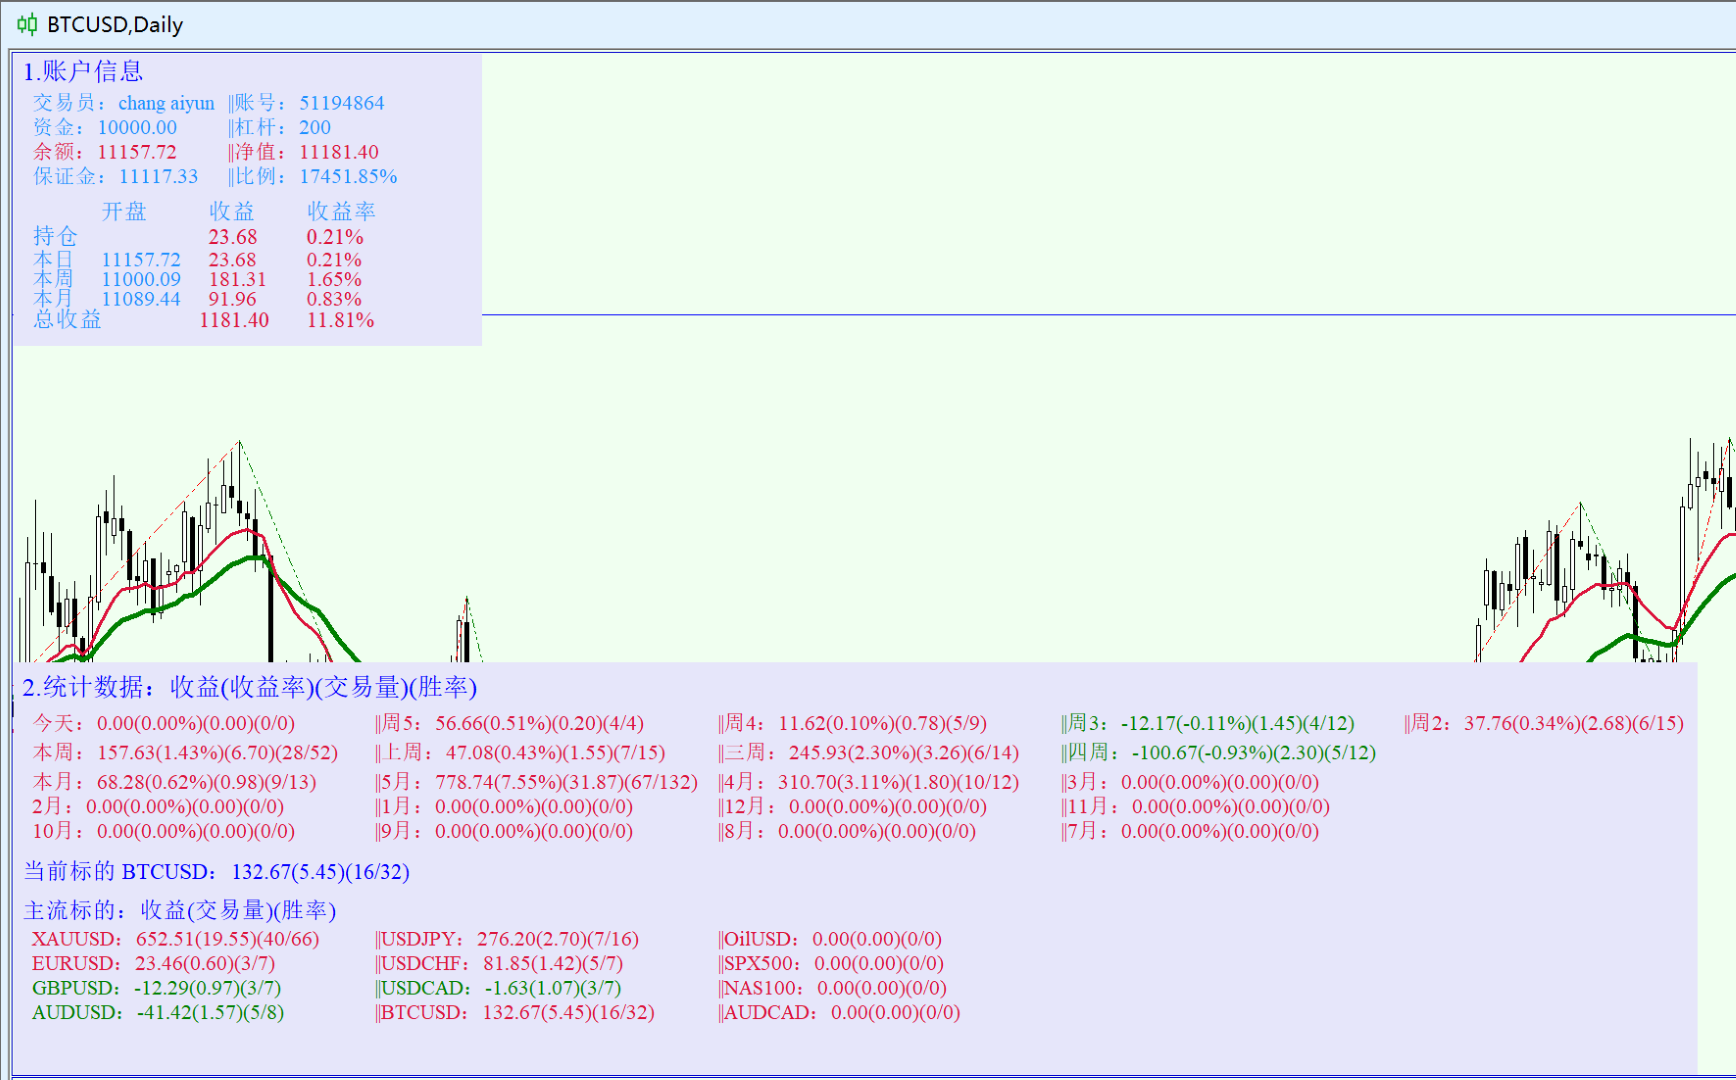
1. die Anzeige von Kontoinformationen: Inhaltsanzeige
Händler, Kontonummer, Kapital, Leverage, Margin, Margin Ratio, Saldo, Nettowert;
Täglicher, wöchentlicher und monatlicher Eröffnungssaldo, Positionsgewinn, Tagesgewinn, Wochengewinn und Monatsgewinn;
Rote Schrift wird angezeigt, wenn die Rendite positiv ist, und grüne Schrift, wenn die Rendite negativ ist;
CircuitBreak wird angezeigt, wenn die tägliche Rendite unter -5% liegt;
MarginCall wird angezeigt, wenn die Gesamtrendite weniger als -10% beträgt;
2. die Anzeige von Statistiken: Erträge (Rendite) (Volumen) (Gewinnrate)
5-Tage-Daten; 4-Wochen-Daten; 12-Monats-Daten;
3. aktuelle Gebotsstatistik: Symbol () Rendite (Volumen) (Gewinnrate)
4. aktuelle Gebotsstatistik: Ertrag (Volumen) (Gewinnrate)
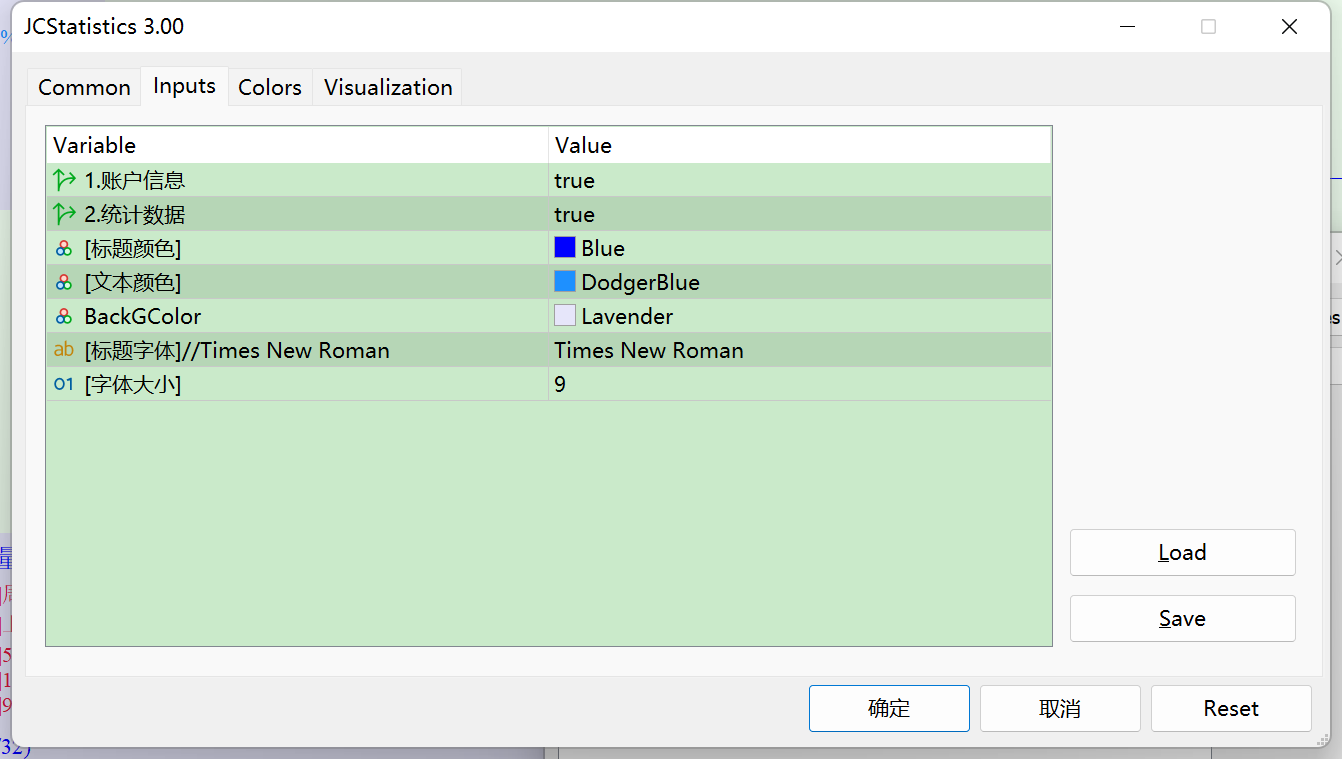
Sie können selektiv Kontoinformationen und Dateninformationen anzeigen, die Farbe der Anzeige anpassen, die Schriftart und die Schriftgröße einstellen.
Desktop-Text und -Hintergrund werden automatisch gelöscht, wenn der Indikator gelöscht wird.
Hinweis: Sollten Sie Probleme mit der Nutzung haben, wenden Sie sich bitte an 16692618587@qq.com.