The Toronto Stock Exchange Sessions Hours
- Indikatoren
- Version: 9.0
- Aktualisiert: 3 Juni 2021
Die Stunden der Toronto Stock Exchange Session
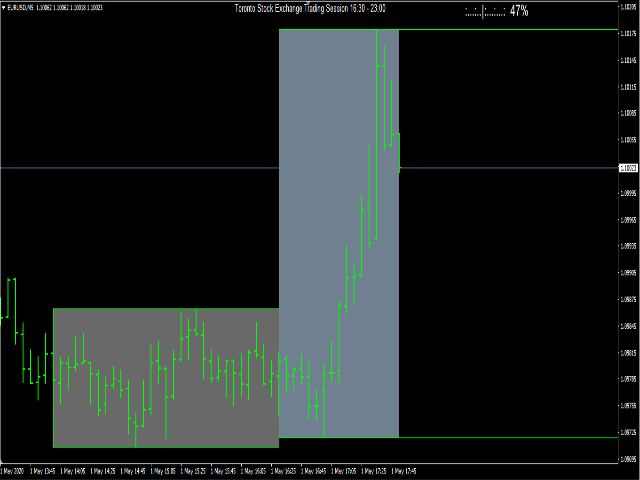
Mit diesem Indikator können Sie die Notierungen des Währungspaares während der folgenden Teile der Börsensitzung live verfolgen. Vor Beginn der Börsensitzung wird ein Rechteck auf dem Chart gezeichnet, das jedoch nicht mit Farbe ausgefüllt ist. Es bedeutet die Ausdehnung der Sitzungsdauer. Bevor der erste Balken in das Rechteck der Börsensitzung eintritt, werden wir durch ein akustisches Signal oder ein Pop-up-Fenster darauf hingewiesen, dass die Börsensitzung gerade beginnt. Wenn die Kursgrafik den Rand des Sitzungsrechtecks mit dem Verstreichen aufeinanderfolgender Minuten überquert, füllt sich das Rechteck stetig mit Farbe. Die häufige Eröffnung des Aktienmarktes gibt dem Devisenmarkt einen kräftigen Impuls, und diese grafische Schnittstelle erleichtert es, diesen Moment zu lokalisieren. Nachfolgende Rechtecke weiterer Teile der Sitzung erscheinen im Laufe der Zeit und die Beschriftung am oberen Rand des Chartfensters nimmt den Titel der aktuellen Sitzung auf. Nach der Sitzung informiert uns die Beschriftung darüber, dass der Markt bis zur angegebenen Uhrzeit des nächsten Tages geschlossen ist. In der ersten Zeile der Indikatoreigenschaften können Sie angeben, wie viele Tage rückwärts der Indikator die Fenster der vorherigen Sitzungen anzeigen soll, um die Auswirkungen auf die Notierungen der Währungspaare zu überprüfen. Alle Farben und Beschriftungen können von Ihnen selbst bestimmt werden. Die Sitzungszeiten werden in der Ortszeit des jeweiligen Börsenplatzes aufgezeichnet. Sie müssen jedoch daran denken, die aktuelle Zeitdifferenz in Ihrer Ortszeit aufgrund der Sommer- und Winterzeitumstellung in verschiedenen Ländern der Welt einzugeben. Standardmäßig werden die Zeitunterschiede zur GMT + 1 eingegeben.