Cycles Predictor
- Indikatoren
- Version: 1.200
- Aktualisiert: 26 Juni 2024
- Aktivierungen: 5

Zyklen-Vorhersage-Indikator
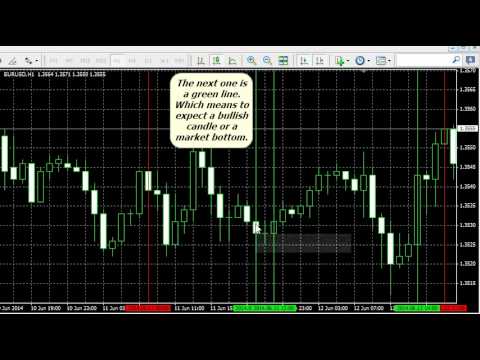
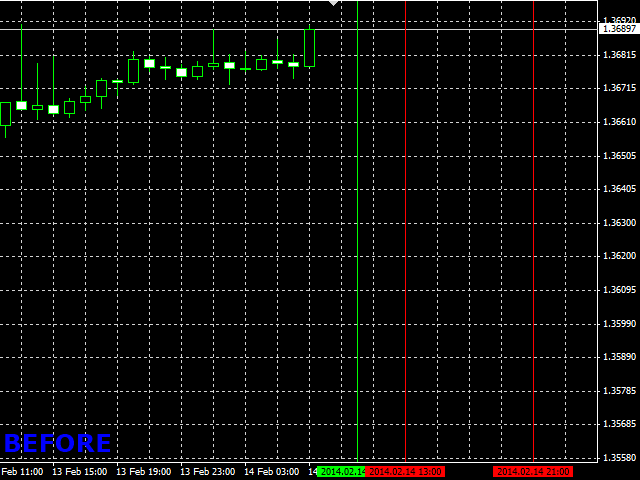
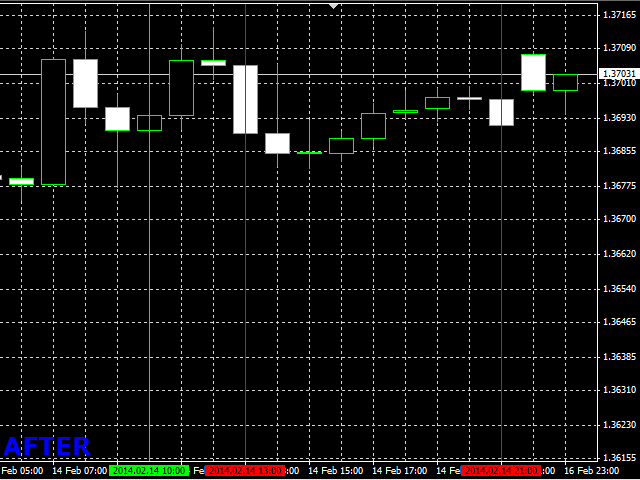
Dieser Indikator nutzt vergangene Marktzyklen, um künftige Kursbewegungen vorherzusagen. Der Indikator durchsucht vergangene Daten und berücksichtigt Kombinationen von Zyklen. Wenn die Zyklen zum gleichen Zeitpunkt in der Zukunft zusammentreffen, wird dies als gültige Vorhersage für die Zukunft betrachtet. Die Vorhersagen werden als vertikale Linien auf der rechten Seite des Diagramms in der Zukunft eingezeichnet. Eine Vorhersage führt oft dazu, dass sich genau zu diesem Zeitpunkt eine bestimmte Art von Kerze (z. B. Bulle oder Bär) und/oder ein Umkehrpunkt (z. B. unten oder oben) bildet. Die Linien werden weit im Voraus gezeichnet, was diesen Indikator einzigartig macht.
- Der Indikator malt keine Linien neu, verschiebt oder löscht sie nicht! Es gibt auch keine Verzögerungen, da die Linien viele Balken im Voraus gezeichnet werden.
- Er kann für den Forex-Handel und möglicherweise für den Handel mit binären Optionen verwendet werden.
- Dieser Indikator kann für News-Trading-Strategien verwendet werden, da die von ihm gezeichneten zukünftigen Zeiten oft zu einer hohen Volatilität führen. Es ist also ähnlich wie bei Nachrichtenzeiten, die ebenfalls im Voraus bekannt sind und oft zu einer hohen Volatilität führen.
- Es ist nicht notwendig, den Chart ständig zu beobachten, da alle Linien im Voraus gezeichnet werden und die zukünftigen Zeiten deutlich markiert sind.
- Stärkefaktor - Dieser Faktor steuert die Zuverlässigkeit und die Anzahl der Vorhersagen. Je höher die Zahl ist, desto zuverlässiger sind die zukünftigen Linien, aber desto weniger Linien werden gezeichnet. Bei einer niedrigeren Einstellung verhält es sich umgekehrt.
- Lookback Candles - Hier wird die Anzahl der vergangenen Kerzen festgelegt, die der Indikator bei der Suche nach vergangenen Zyklen berücksichtigt. Je höher die Zahl ist, desto mehr Zyklen werden verwendet und desto größer ist die Chance, dass zukünftige Linien gezeichnet werden, aber desto langsamer wird der Indikator sein. Bei einer niedrigeren Einstellung verhält es sich umgekehrt.
- Farbe der Kauflinie - Diese Einstellung steuert die Farbe der vom Indikator gezeichneten vertikalen Aufwärtslinie.
- Farbe der Verkaufslinie - Diese Einstellung steuert die Farbe der vertikalen Baisse-Linie, die vom Indikator gezeichnet wird.
- Je höher die Zahl für den"Stärkefaktor", desto besser. Je niedriger die"Lookback Candles", desto besser. Wenn Sie feststellen, dass zu viele Linien auf dem Chart gezeichnet werden, passen Sie die Einstellungen strenger an, bis nur noch wenige Linien gezeichnet werden. Diese werden dann stärkere Zyklen sein. Sie sollten also die 2 Einstellungen mit diesem Tipp im Hinterkopf abgleichen.
- Der Indikator zeichnet zukünftige Kauf- und Verkaufssignale mit unterschiedlichen Farben. Der Indikator verwendet vergangene Zyklen, um die zukünftigen Vorhersagen zu zeichnen. Wenn die vorhergehenden Zyklen bullische Zyklen waren, wird der Indikator ein zukünftiges Kaufsignal einzeichnen. Und andersherum. Es ist wichtig zu beachten, dass die Richtung der vergangenen Zyklen (Hausse oder Baisse) nicht immer mit dem zukünftigen Ergebnis korreliert. Manchmal führt der künftige Zyklus nur zu einer größeren Volatilität. Die zukünftigen Linien sind also nur auf der Grundlage der vergangenen Zyklen eingefärbt, die zur Erstellung der Vorhersage verwendet wurden, aber die Richtung ist nicht immer genau. Was Sie jedoch mit ziemlicher Sicherheit erwarten sollten, ist, dass es zu den vorhergesagten Zeitpunkten eine Marktumkehr und/oder größere Volatilität geben wird.
- Dies ist ein Indikator, der auf Zyklen basiert. Wenn Sie Zykluslinien nicht mögen oder sie nicht verstehen, sollten Sie ihn nicht kaufen. Sich zu beschweren, dass dieser Indikator nicht funktioniert, ist wie die Behauptung, Zyklen würden nicht funktionieren.
- Dieser Indikator funktioniert mit jedem MT4-Broker und jedem Chart.
- Die folgenden Beispiele stammen aus echten Live-Charts.
- WICHTIG: Besuchen Sie unsere Website über den Link in meinem Profil, um KOSTENLOSE Indikatoren und EAs zu finden!
Not accurate at all