Consolidation box Generator
- Indikatoren
-
IVAN ASTAFUROV
 We are a community of traders, we trade, educate, share experience. Here we post our developments that may be of interest to the MQL community.
Products: - Version: 1.1
- Aktivierungen: 5
Neue Version des Indikators Consolidation box Generator. Die vorherige Version finden Sie hier. Beispiele von Einstellungen für den Indikator hier.
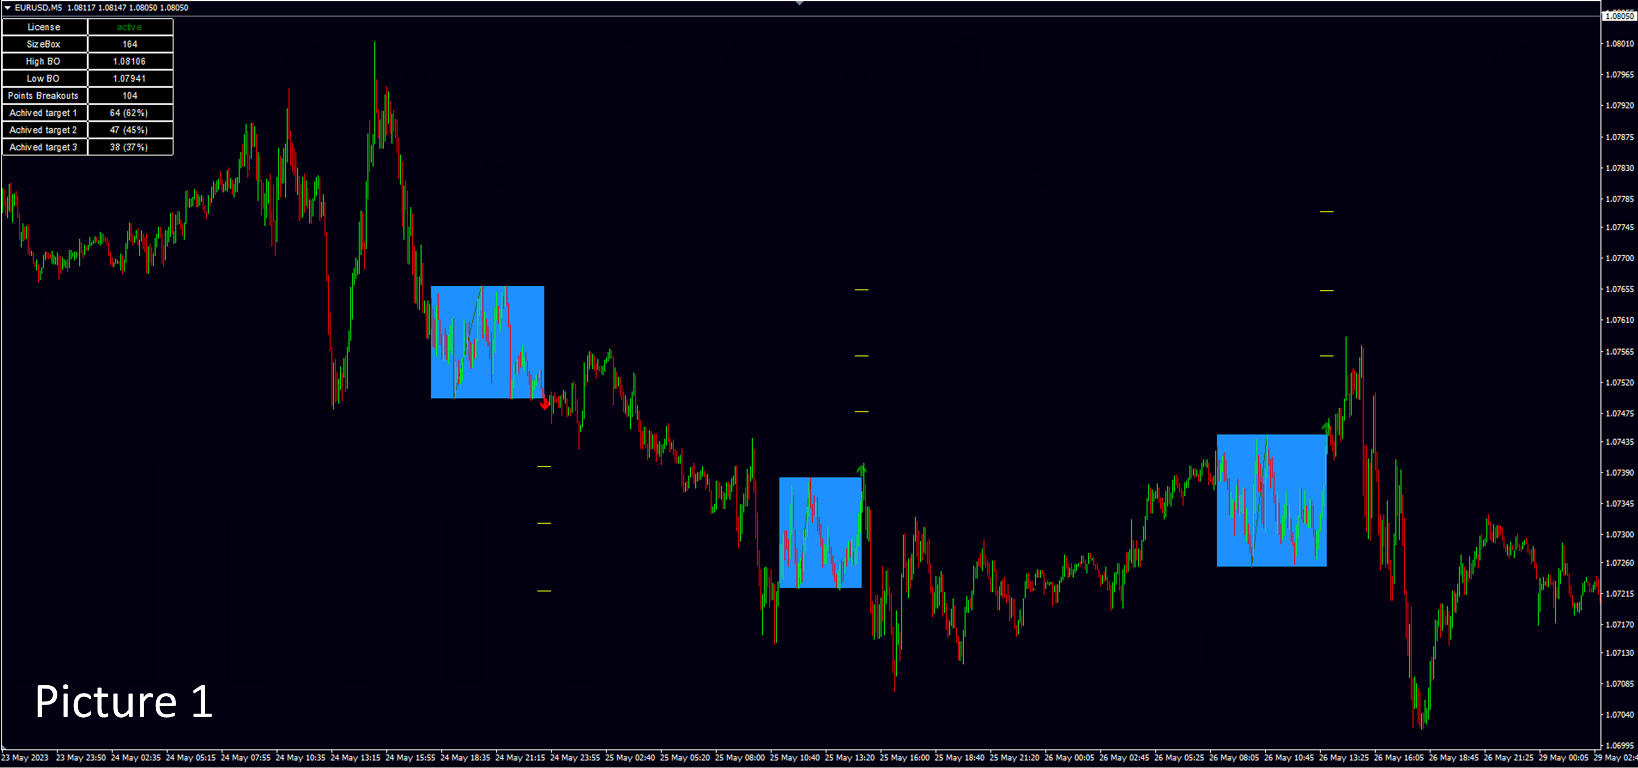
Was genau Sie auf dem Kurschart sehen werden, wenn Sie mit dem Indikator arbeiten.
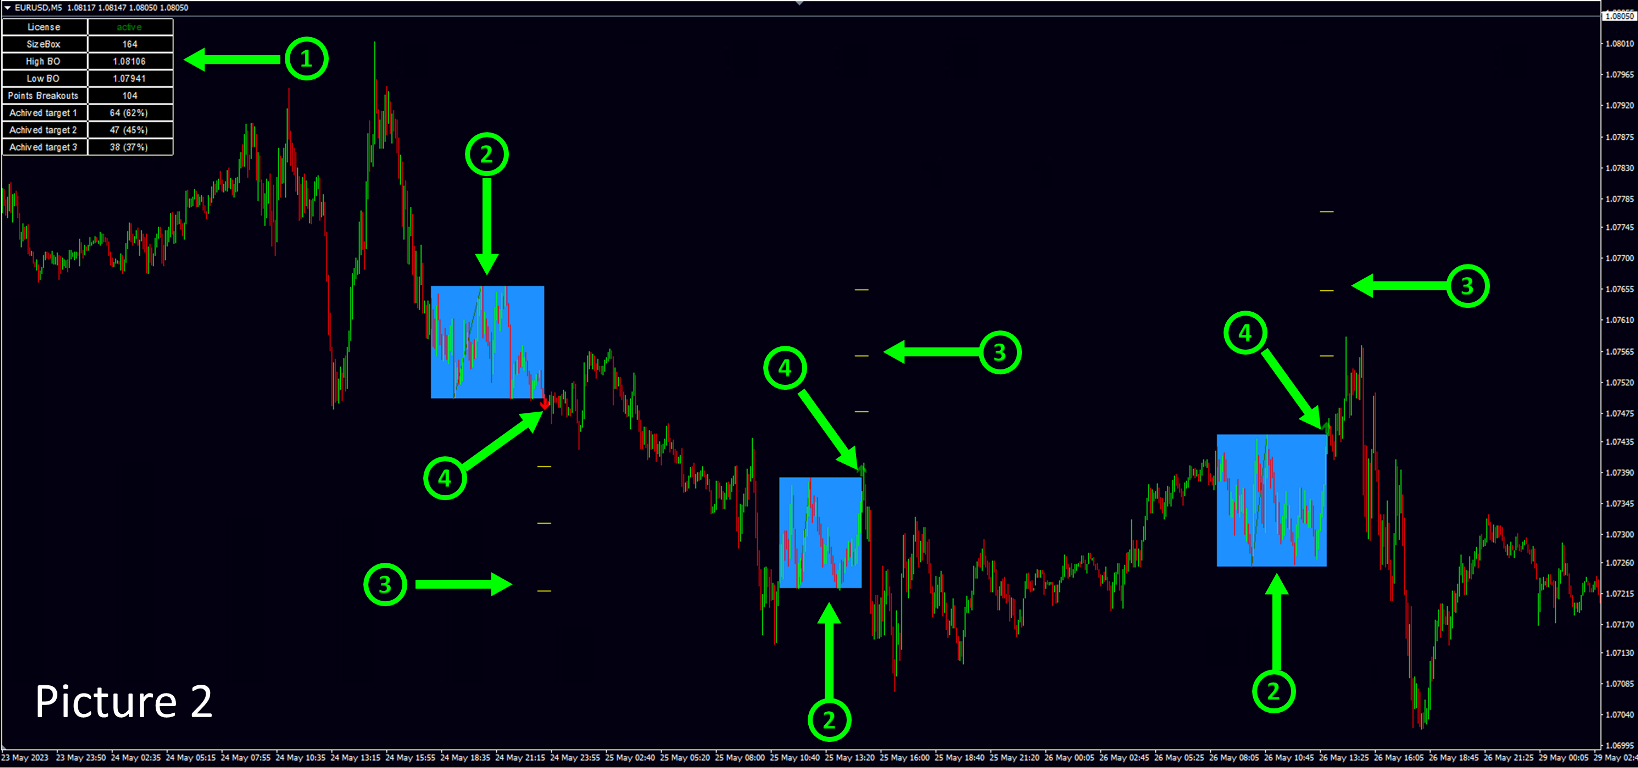
Abbildung 2 zeigt alle Objekte, die der Indikator dem Benutzer während der Initialisierung anzeigt.
1. - Statistikblock, Beschreibung unten.
2. - Konsolidierungen, die der Indikator im automatischen Modus findet.
3. - Ziele oder Zielvorgaben, die der Benutzer selbständig in den Einstellungen des Indikators festlegt, der Indikator spiegelt die Statistik der auslösenden Ziele auf dem ausgewählten Intervall der Geschichte.
4. - Anzeige mit einem Pfeil, in welche Richtung der Händler ein Geschäft zum Zeitpunkt des Konsolidierungsausbruchs eröffnen sollte, wenn die Strategie "Breakout" - Konsolidierungsausbruch - in den Einstellungen des Indikators eingestellt ist.
Senden von Meldungen der Indikatorsignale.
Der Indikator sendet Nachrichten, wenn die Signale erscheinen. Der Versand kann an die E-Mail, an das Handelsterminal und
in Form von Push-Benachrichtigungen an ein Smartphone. Es gibt verschiedene Arten von Nachrichten:
Wenn der Handelsmodus "Breakout"eingeschaltet ist:
Erste Nachricht.
ROBOT N4 TRADE N4 Коробка консолидации построена NZDUSD BUY STOP|0.61026|StopLoss|0.60839|Target:1|0.61123|2|0.61227|3|0.61330| SELL STOP|0.60839|StopLoss|0.61026|Target:1|0.60742|2|0.60638|3|0.60535|
ROBOT - wenn der Indikator für mehrere Währungspaare konfiguriert ist, können Sie jeden Indikator in den Einstellungen nummerieren, um Verwirrung beim Kopieren von Signalen auf Ihr Handelskonto zu vermeiden.
TRADE - jeder Indikator zählt die Trades, die er erzeugt hat, auch um Verwirrung bei den gesendeten Signalen zu vermeiden.
Consolidation box is built - diese Aufschrift bedeutet, dass sich zu diesem Zeitpunkt eine Konsolidierungsbox auf dem Preisdiagramm gebildet hat. Danach folgen die Parameter für den Handel. Bei der Strategie "Breakout" empfiehlt es sich, zwei Aufträge für den Ausbruch der Konsolidierung zu erteilen. Nach dem Ausbruch aus der Konsolidierung wird die zweite schwebende Order entfernt, wenn der Ausbruch nach oben erfolgte, wird der SELL STOP entfernt. Wenn der Ausbruch nach unten erfolgte, wird der BUY STOP gelöscht.
Als nächstes folgen die Parameter der Pending Orders, die Sie einstellen müssen, wenn Sie diese Empfehlung in Ihrem Handel verwenden möchten.
Zweite Nachricht.
ROBOT N4 TRADE N4 NZDUSD BUY |0.61026|StopLoss|0.60839|Target:1|0.61123|2|0.61227|3|0.61330
Nachdem der Ausbruch aus der Konsolidierungsbox stattgefunden hat, bedeutet dies, dass Ihre Pending Order ausgeführt wurde. Sie müssen also die zweite schwebende Order löschen.
MIT TRADING MODE"false breakout"ON:
Erste Meldung.
ROBOT N1 TRADE N31 XRPUSDT POSSIBLE FALSE BREAKOUT SELL |0.5168|StopLoss|0.5199|Target:1|0.5153|2|0.5137|3|0.5122|
Wenn der Modus "Falscher Ausbruch" aktiviert ist, erscheint die Handelsnachricht in einer anderen Form, seien Sie also vorsichtig. Vor allem, wenn Sie zwei Indikatoren für denselben Vermögenswert haben, von denen einer Konsolidierungsausbrüche und der zweite falsche Konsolidierungsausbrüche analysiert.
POSSIBLE False Breakout - diese Meldung bedeutet, dass sich auf dem Chart eine Situation gebildet hat, die sich zu einem falschen Ausbruch entwickeln kann. In der technischen Analyse ist es unmöglich, das Auftreten eines falschen Ausbruchssignals vorherzusagen, ein falscher Ausbruch kann nur in dem Moment erkannt werden, in dem er sich tatsächlich auf dem Chart bildet.
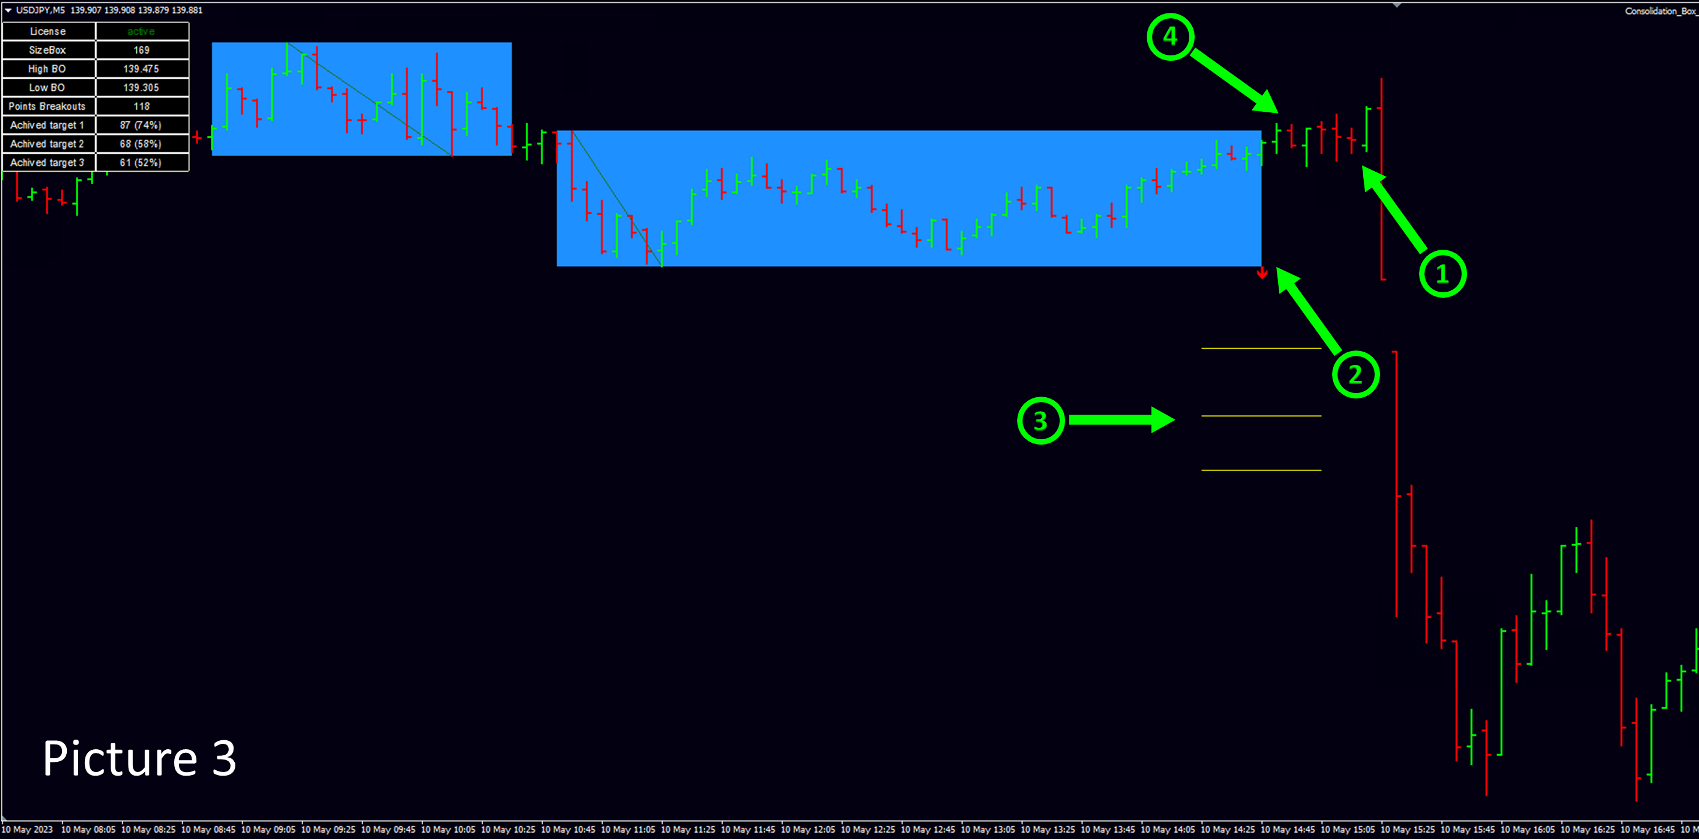
Abbildung 3 ist ein Beispiel für einen falschen Ausbruch.
1 - Falscher Ausbruch.
2.- Pfeil, der anzeigt, in welche Richtung der schwebende Auftrag hätte platziert werden müssen.
3 - Gelbe parallele Linien - Ziele, die Sie in den Einstellungen des Indikators festgelegt haben.
4. - Der Zeitpunkt, zu dem der Indikator eine Meldung über das wahrscheinliche Auftreten eines falschen Ausbruchs generiert, so dass der Händler Zeit hat, eine Pending Order zu platzieren.
Die Formulierung "kann" wird hier verwendet, weil Sie bei der Verwendung dieses Indikators mit schwebenden Aufträgen handeln und die Empfehlung des Indikators, einen schwebenden Auftrag zu erteilen, vor dem tatsächlichen Auftreten eines falschen Ausbruchs erfolgt. Der "falsche Ausbruch" kann also entweder eintreten, in diesem Fall wird Ihre Pending Order ausgeführt. In diesem Fall wird Ihre schwebende Order ausgeführt, oder die Situation tritt nicht ein, und Sie müssen Ihre schwebende Order löschen.
Die zweite Meldung, wenn der falsche Ausbruch stattgefunden hat, wie in diesem Beispiel, sendet der Indikator die folgende Meldung. Zufälligerweise auf dem Eintrag "...ROBOT N1 TRADE N31..." . Wenn Sie eine Pending Order gemäß der Empfehlung aus dem Beispiel setzen, dann ist Ihr Trade bereits in Betrieb .
ROBOT N1 TRADE N31 XRPUSDT SELL |0.5168|StopLoss|0.5199|Target:1|0.5153|2|0.5137|3|0.5122|
Dies sind die Meldungen, die kommen, wenn der falsche Ausbruch schließlich scheitert.
ROBOT N3 TRADE N37 ADAUSDT POSSIBLE False BUY |0.2731|StopLoss|0.2708|Target:1|0.2743|2|0.2754|3|0.2766
ROBOT N3 TRADE N37 ADAUSDT CANCELLED False BUY |0.2731|StopLoss|0.2708|Target:1|0.2743|2|0.2754|3|0.2766|
Die erste Meldung des Extrembeispiels signalisiert dem Händler, dass er eine Pending Order setzen soll. Die zweite Meldung signalisiert, dass das "false breakout"-Signal fehlgeschlagen ist. Es wird also empfohlen, die Pending Order zu löschen.
Statistik-Block.
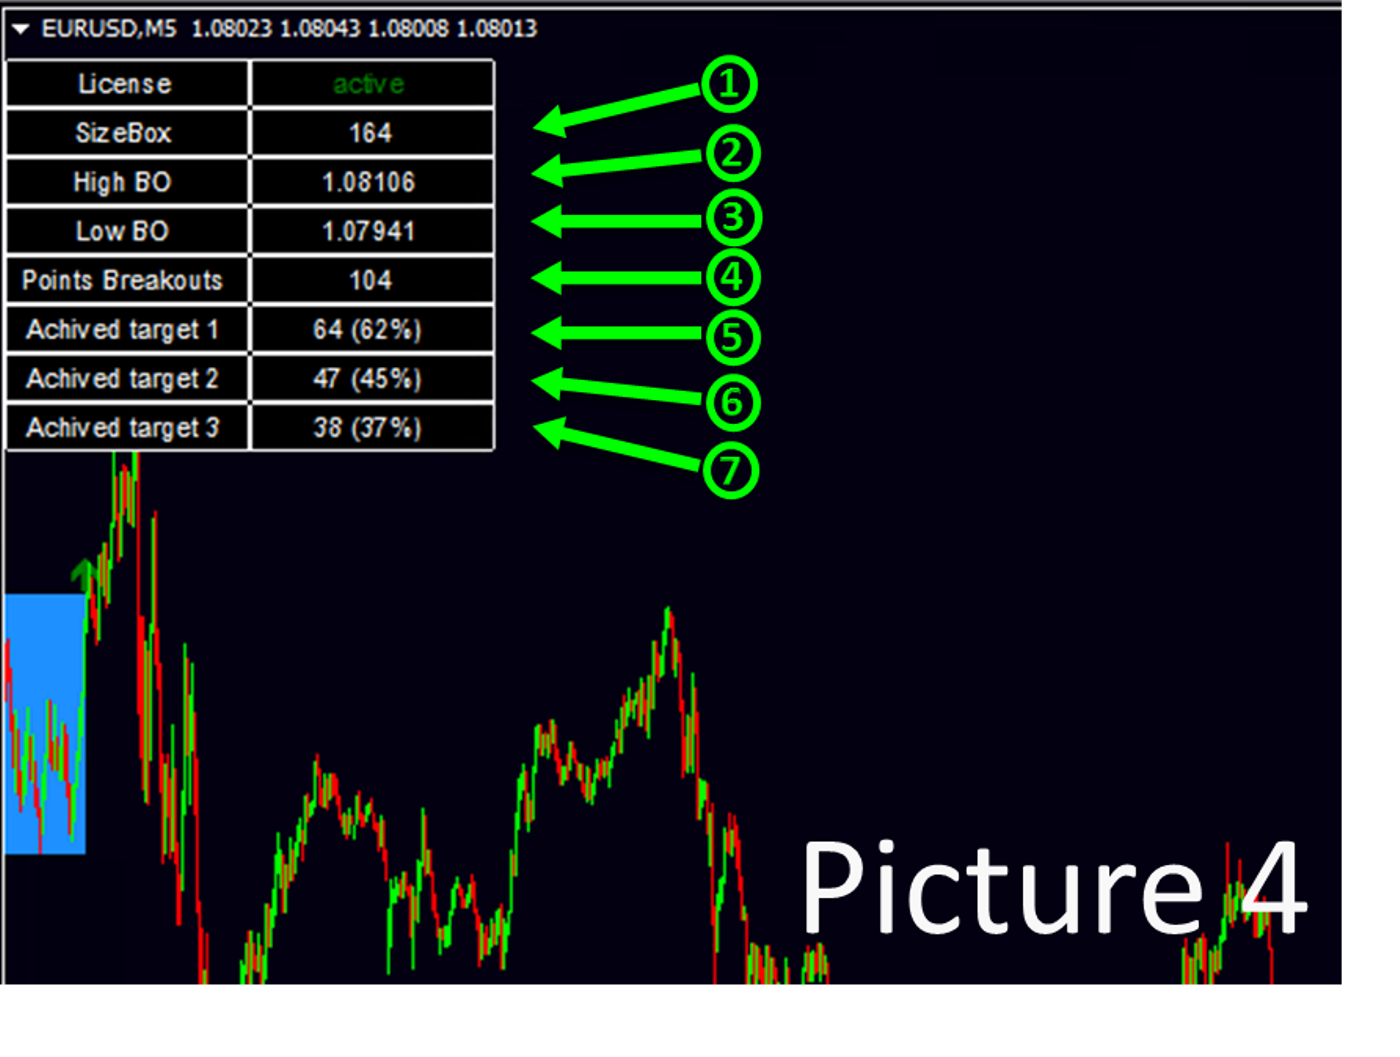
Abbildung 4 zeigt die im "Statistikblock" enthaltenen Informationen.
1. - Die Größe, Höhe, der zuletzt gebildeten Konsolidierungsbox in Pips.
2. - Der Preis der oberen Begrenzung der zuletzt gebildeten Konsolidierungsbox in Pips.
3. - Preis der unteren Begrenzung der zuletzt gebildeten Konsolidierungsbox.
4. - Anzahl der gefundenen Konsolidierungsboxen für den vom Benutzer ausgewählten Zeitraum (beantwortet durch Days Back)
5. - Anzahl der Konsolidierungen, die das erste "Ziel 1" erreicht haben, Anzahl/%, Wahrscheinlichkeit eines positiven Ergebnisses beim Setzen des Take Profit auf "Ziel 1"
6. - Anzahl der Konsolidierungen, bei denen das zweite "Ziel 2" erreicht wurde, Anzahl/%, Wahrscheinlichkeit eines positiven Ergebnisses beim Setzen des Take-Profits auf "Ziel 2".
7. - Anzahl der Konsolidierungen, bei denen das dritte "Ziel 3" erreicht wurde, Anzahl/%, Wahrscheinlichkeit eines positiven Ergebnisses beim Setzen des Take-Profits auf "Ziel 3".
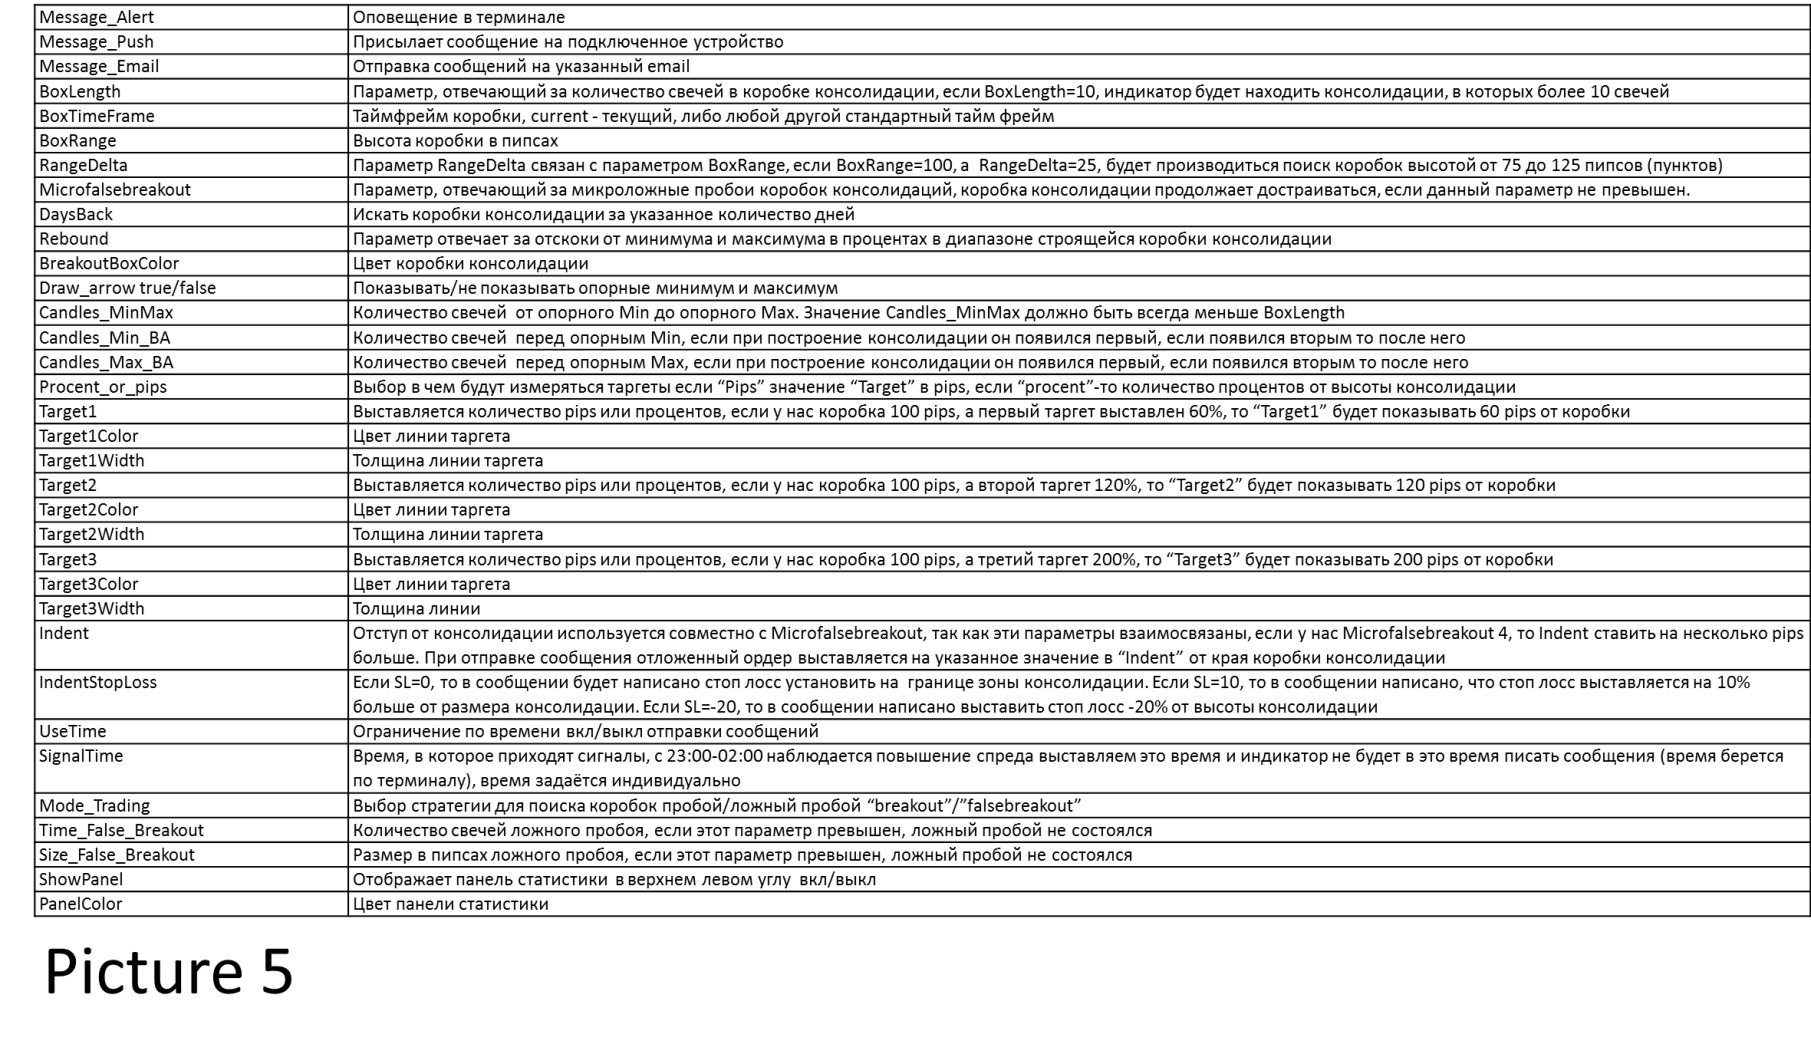
Beschreibung der Parameter Bild 5
Wenn Sie Ihre eigenen Parameter finden wollen.
Zur Zeit gibt es Diskrepanzen zwischen der Initialisierung des Indikators und der Arbeit in Echtzeit bzw. der Ausführung im Strategietester. Wir empfehlen daher die folgende Reihenfolge bei der Arbeit mit dem Indikator.
1. Wählen Sie den gewünschten Vermögenswert aus und ändern Sie die Einstellungen durch manuelle Auswahl, bis Sie die Statistik der Konsolidierungsdurchbrüche oder falschen Konsolidierungsdurchbrüche erhalten, die Sie interessiert.
2. Um sich zu vergewissern, dass die gefundenen Parameter funktionieren, führen Sie einen Testlauf im Strategie-Tester durch. Die empfohlene Abweichung der Statistiken bei der Initialisierung und bei der Ausführung im Tester beträgt nicht mehr als 3% im Guten wie im Schlechten.
Wir planen eine Aktualisierung des Indikators, bei der wir versuchen werden, die Unterschiede bei der Suche nach Konsolidierungen zum Zeitpunkt der Initialisierung und bei der Arbeit in Echtzeit oder beim Ausführen im Strategietester zu minimieren.