Consolidation box Generator

Новая версия индикатора консолидаций Consolidation box Generator. Предыдущая версия тут. Примеры настроек на индикатор тут.

На данный момент этот инструмент анализа рынка уже нельзя назвать просто индикатором. Потому как это торговая стратегия. Наше ноу-хау заключается в том, что данный индикатор не требует огромного количества тестов в тестере стратегий. В индикаторе реализован блок статистики - при нанесении на график вам сразу будет видна результативность работы стратегии. Вы можете настроить данный индикатор на любой интересующий вас рынок, а именно: валютный, сырьевой, крипто, акции. Главное использовать терминал мт4 или мт5. После того как все настройки на индикаторе произведены, работать по индикатору сможет любой человек, даже без углубленных знаний рынка. Достаточно уметь работать с отложенными ордерами в терминале мт4 и мт5.  В индикатор встроенно две стратегии торговли: стратегия "breakout" - "пробой консолидации", стратегия "false breakout" "ложный пробой консолидации". Индикатор не прогнозирует, но отражает статистику по ложным пробоям и простым пробоям. Изменяя параметры индикатора вы будете сразу видеть статистику по тем консолидациям, которые вы настраиваете. На picture 1 показан график цены с настроенным индикатором. 


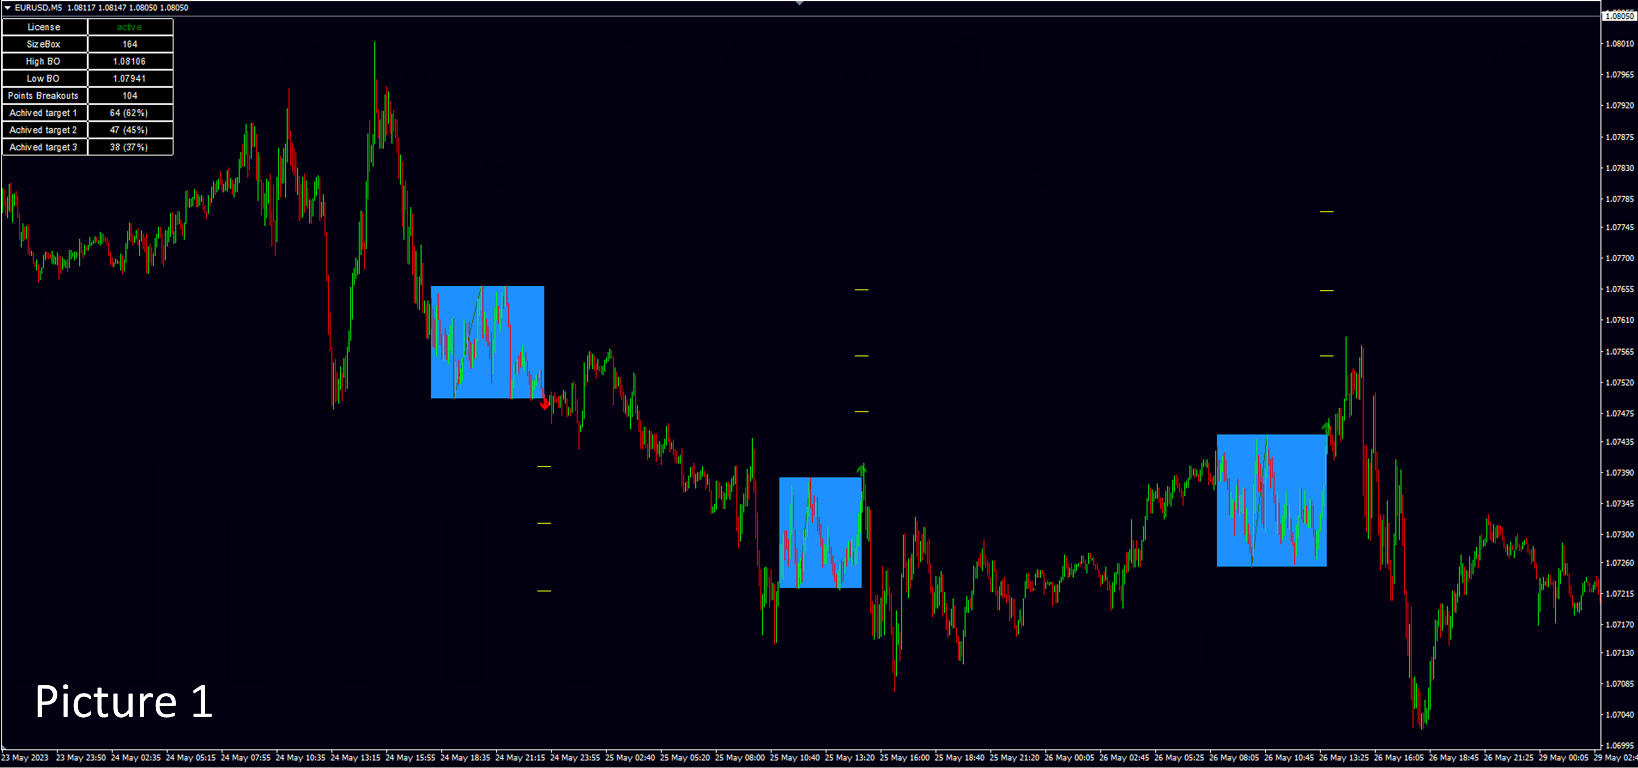
Что именно вы будете видеть на графике цен при работе с индикатором. 

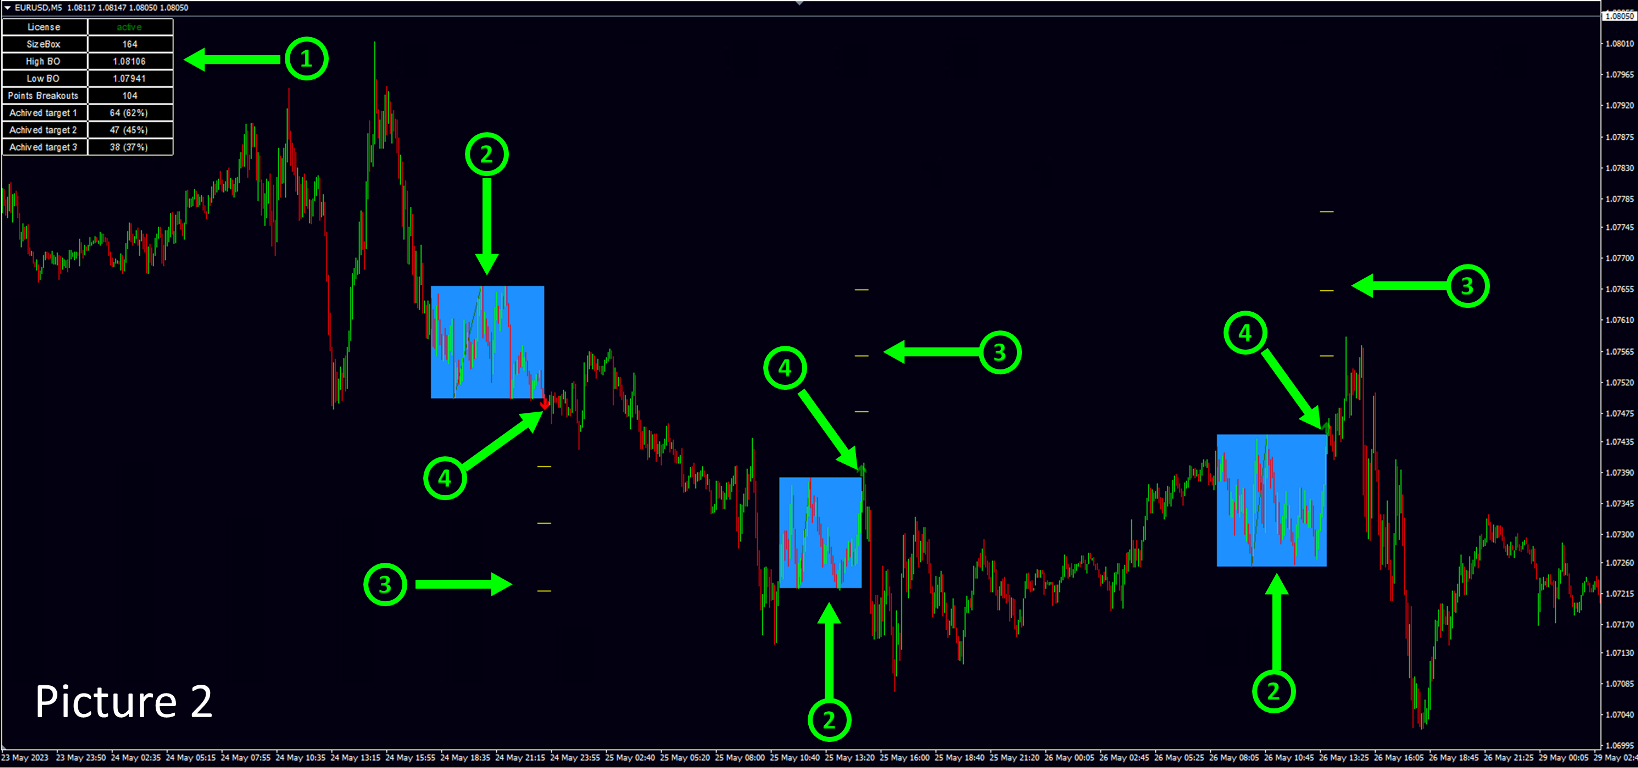
На picture 2 показаны все объекты, которые индикатор показывает пользователю при инициализации.

1. - Блок статистики, описание далее.

2. - Консолидации, которые индикатор находит в автоматическом режиме.

3. - Таргеты или targets, которые пользователь задаёт самостоятельно в настройках индикатора, индикатор отражает статистику срабатывания targets на выбранном промежутке истории.

4. - Указание стрелочкой в какую сторону трейдер должен был открыть сделку в момент пробоя консолидации, если в настройках индикатора установлена стратегия "breakout" - пробой консолидации.  


Отправка сообщений сигналов индикатора. 

Индикатор отправляет сообщения при появлении сигалов. Отправка может быть на почту, в торговый терминал и

в виде push уведомлений на смартфон. Сообщения бывают нескольких видов:

ПРИ ВКЛЮЧЕННОМ РЕЖИМЕ ТОРГОВЛИ "breakout":

Первое сообщение.

ROBOT N4 TRADE N4 Коробка консолидации построена NZDUSD BUY STOP|0.61026|StopLoss|0.60839|Target:1|0.61123|2|0.61227|3|0.61330| SELL STOP|0.60839|StopLoss|0.61026|Target:1|0.60742|2|0.60638|3|0.60535|

ROBOT - если индикатор настроен на несколько валютных пар, вы можете пронумеровать каждый индикатор в настройках, чтобы устранить путаницу при копировании сигналов на свой торговый счет.

TRADE - каждый индикатор считает сделки, которые он сгенерировал, также чтобы устранить путаницу в присылаемых сигналах.

Коробка консолидации построена - это надпись означает, что на данный момент времени на графике цены образовалась коробка консолидации. После идут параметры сделки. При стратегии  "breakout" рекомендуется устанавливать два ордера на пробой консолидации. После того как состоится пробой консолидации второй отложенный ордер удаляется, если пробой был вверх, удаляется  SELL STOP. Если пробой был вниз удаляется BUY STOP.

Далее идут параметры отложенных ордеров, которые вам необходимо установить, если вы хотите использовать данную рекомендацию в своей торговле.

Второе сообщение. 

ROBOT N4 TRADE N4 NZDUSD BUY |0.61026|StopLoss|0.60839|Target:1|0.61123|2|0.61227|3|0.61330

Приходит после того как пробой коробки консолидации состоялся, это значит, что ваш отложенный ордер исполнился. Значит вам необходимо удалить второй отложенный ордер. 

ПРИ ВКЛЮЧЕННОМ РЕЖИМЕ ТОРГОВЛИ "false breakout":

Первое сообщение.

ROBOT N1 TRADE N31 XRPUSDT ВОЗМОЖЕН ЛОЖНЫЙ ПРОБОЙ SELL |0.5168|StopLoss|0.5199|Target:1|0.5153|2|0.5137|3|0.5122|

При включенном режиме  "false breakout" сообщение о сделке приходит другого вида, будьте внимательны. Особенно если у вас на одном активе стоит два индикатора, один из которых анализирует пробои консолидаций, а второй ложные пробои консолидаций. 

ВОЗМОЖЕН ЛОЖНЫЙ ПРОБОЙ - это сообщение означает, что на графике сформировалась ситуация, которая может стать ложным пробоем. В техническом анализе невозможно предсказать появление сигнала ложный пробой, ложный пробой можно обнаружить только в тот момент, когда он фактически сформировался на графике.

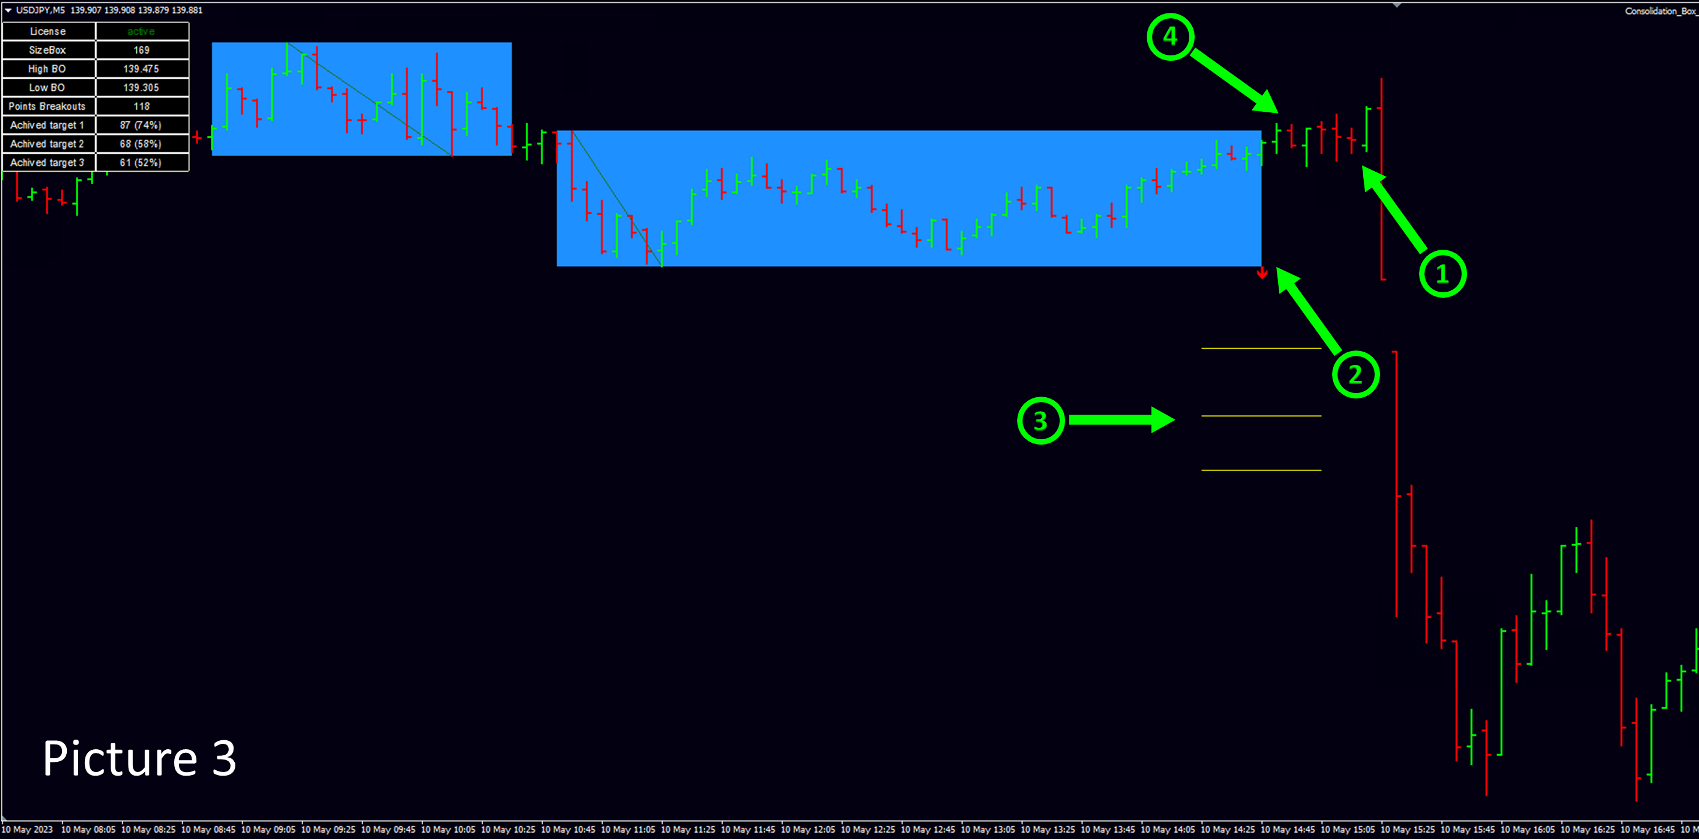
На picture 3 пример состоявшегося ложного пробоя.

1.- Ложный пробой.

2.- Стрелочка, показывающая в какую сторону нужно было установить отложенный ордер.

3.- Желтые параллельные линии - targets, которые вы устанавливаете в настройках индикатора.

4. - Момент времени, когда индикатор сгенерирует сообщение о вероятном появлении ложного пробоя, чтобы трейдер успел выставить отложенный ордер.

Формулировка "может" здесь применяется потому, что используя данный индикатор в своей торговле, вы торгуете отложенными ордерами, и рекомендация по установке отложенного ордера от индикатора приходит еще до фактического появления ложного пробоя. Отсюда, ситуация "ложный пробой" может либо состоятся, в таком случае ваш отложенный ордер будет исполнен. Либо ситуация не состоится, тогда вам нужно удалить свой отложенный ордер.

Второе сообщение, если ложный пробой состоялся, как в данном примере, индикатор присылает сообщение такого вида. По совпадению на записи "...ROBOT N1 TRADE N31..."  вверху и внизу, вы видите что это одна и та же сделка.  Если вы устанавливали отложенный ордер по рекомендации из примера, значит ваша сделка уже в работе. 

ROBOT N1 TRADE N31 XRPUSDT SELL |0.5168|StopLoss|0.5199|Target:1|0.5153|2|0.5137|3|0.5122|


Вот такие сообщения приходят, если ложный пробой в итоге пробой не состоялся. 

ROBOT N3 TRADE N37 ADAUSDT ВОЗМОЖЕН ЛОЖНЫЙ ПРОБОЙ BUY |0.2731|StopLoss|0.2708|Target:1|0.2743|2|0.2754|3|0.2766

ROBOT N3 TRADE N37 ADAUSDT ОТМЕНА ЛОЖНОГО ПРОБОЯ BUY |0.2731|StopLoss|0.2708|Target:1|0.2743|2|0.2754|3|0.2766|

Первое сообщение из крайнего примера сигнализирует трейдеру об установке отложенного ордера. Второе сообщение сигнализирует о том, что сигнал "ложный пробой" не состоялся. Значит рекомендуется удалить отложенный ордер. 


Блок статистики. 

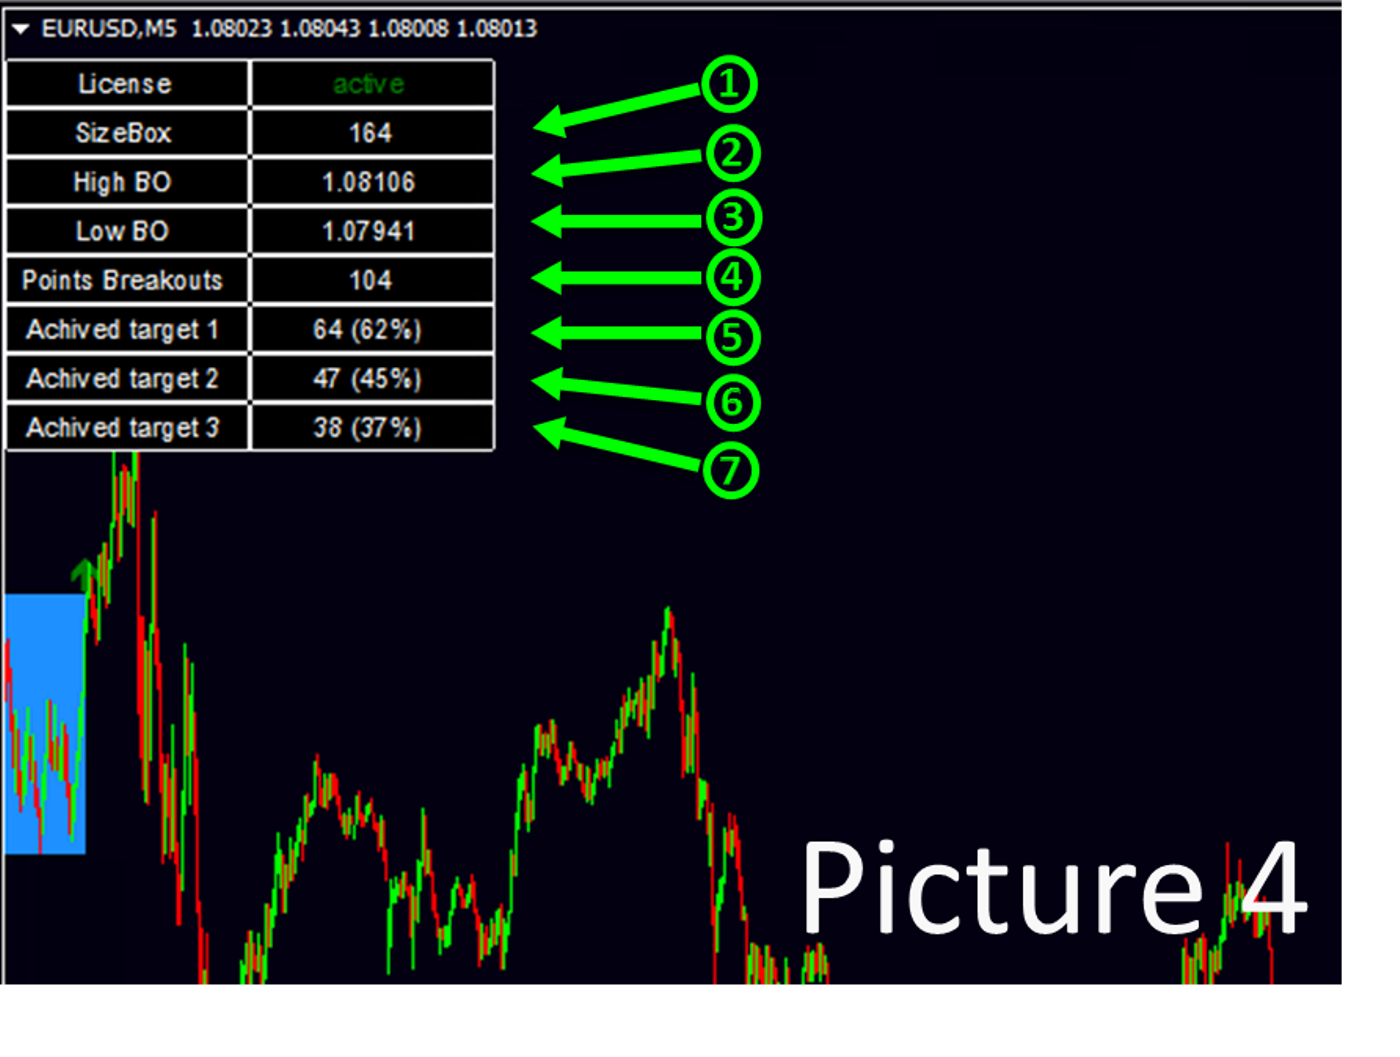
На рисунке picture 4 расписана информация, которую содержит "блок статистики".

1. - Размер, высота, последней построенной коробки консолидации в пипсах.

2. - Цена верхней границы последней построенной консолидации. 

3. - Цена нижней границы последней построенной консолидации.

4. - Количество найденных коробок консолидаций за выбранный пользователем период (отвечает Days Back) 

5. - Количество консолидаций, в которых достигли первого "target 1", количество/%, вероятность положительно исхода при установке take profit на  "target 1"

6. - Количество консолидаций, в которых достигли второго "target 2", количество/%, вероятность положительно исхода при установке take profit на  "target 2"

7. - Количество консолидаций, в которых достигли третий "target 3", количество/%, вероятность положительно исхода при установке take profit на  "target 3"


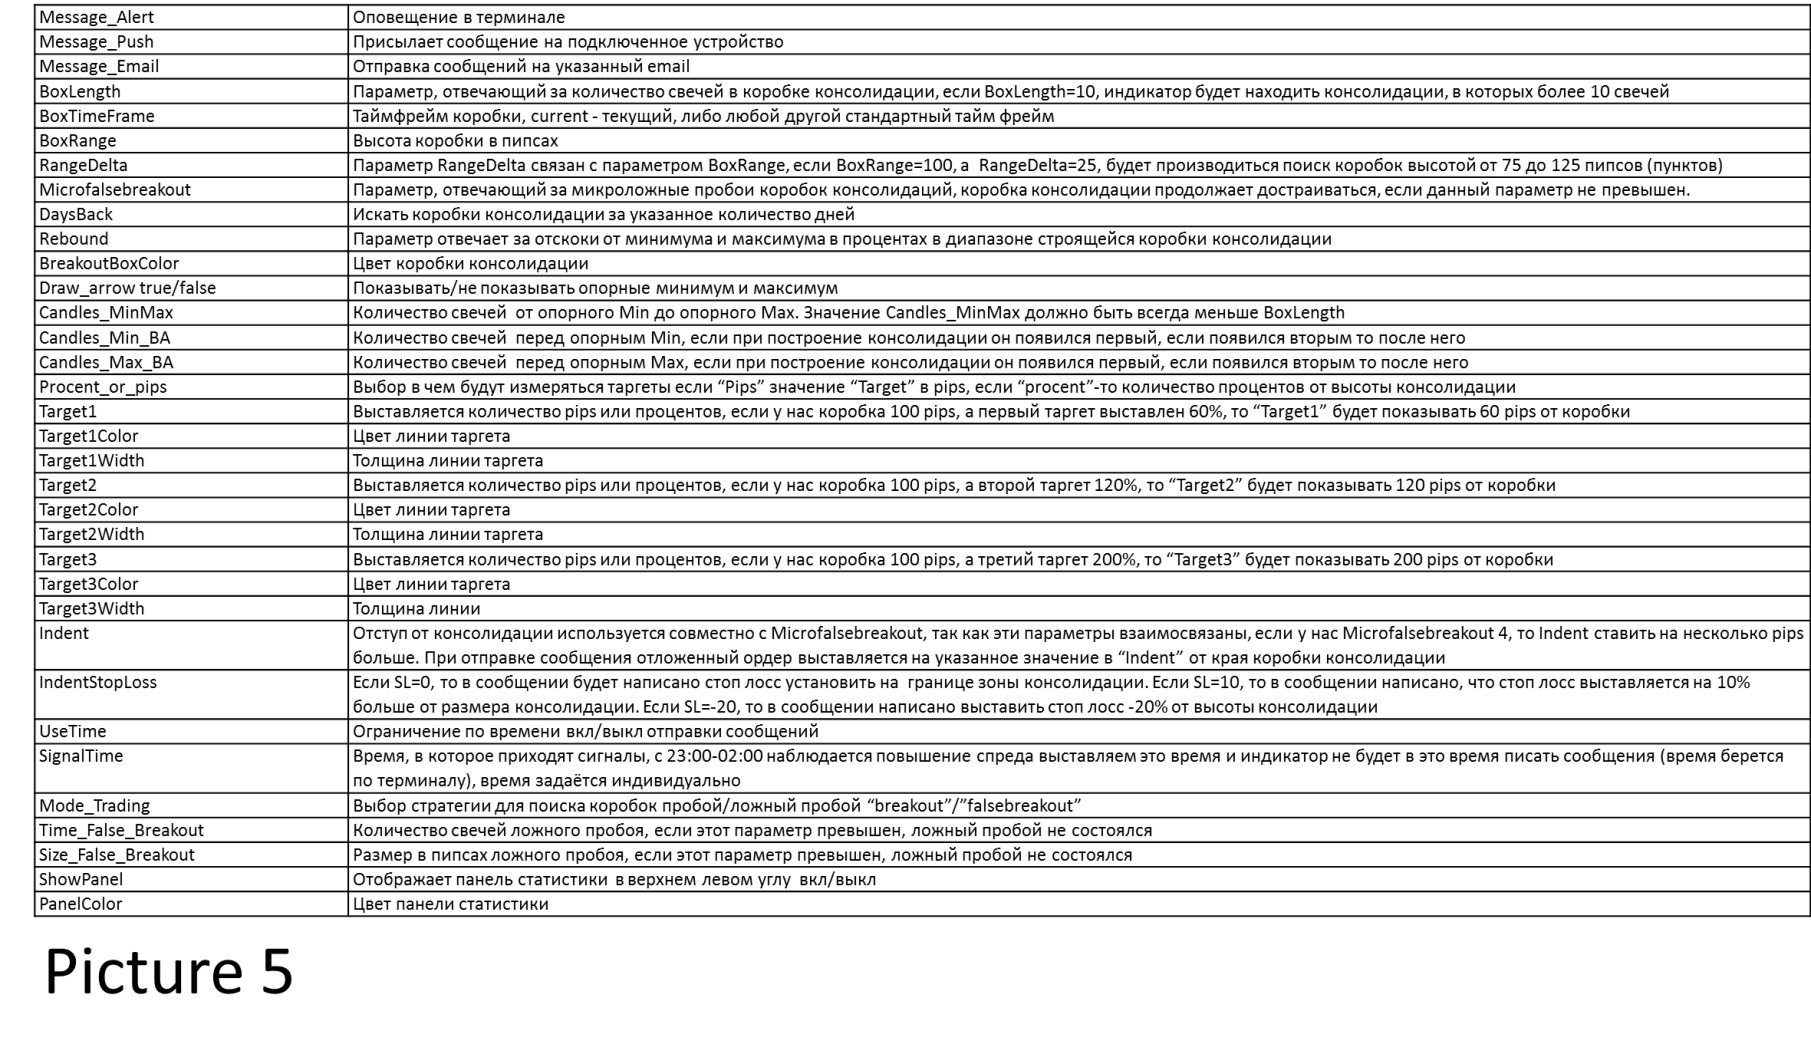
Описание параметров picture 5


Если вы хотите найти собственные параметры.

На данный момент есть расхождения при инициализации индикатора и при работе в режиме реального времени, или при прогоне в тестере стратегий. Поэтому мы рекомендуем следующий порядок работы с индикатором.

1. Выбрать интересующий актив и методом ручного подбора изменять настройки до тех пор, пока не получите интересующую вас статистику пробоев консолидаций или ложных пробоев консолидаций.

2. Для того чтобы удостовериться в работоспособности найденных параметров сделаете контрольный прогон в тестере стратегий. Рекомендуемое отклонение статистики при инициализации и при прогоне в тестере не более 3% в лучшую или в худшую сторону.

Планируем обновление индикатора, в котором постараемся свести к минимуму расхождения по поиску консолидаций в момент инициализации и при работе в режиме реального времени, или при прогоне в тестере стратегий.

추천 제품
Smart Reversal Signal
Evgeny Belyaev
3 (2)
Smart Reversal Signal  is a professional indicator for the MetaTrader 4 platform; it has been developed by a group of professional traders. This indicator is designed for Forex and binary options trading. By purchasing this indicator, you will receive: Excellent indicator signals. Free product support. Regular updates. Various notification options: alert, push, emails. You can use it on any financial instrument (Forex, CFD, options) and timeframe. Indicator Parameters Perod - indicator calculat
This indicator is designed for scalping on low timeframes (M1-M15) in volatile markets like major forex pairs (e.g., EURUSD, GBPUSD). It generates non-repainting buy (green up arrow) and sell (red down arrow) signals based on EMA crossover confirmed by RSI momentum and MACD crossovers, minimizing false signals in ranging markets. How to Use: Attach the indicator to your MT4 chart. Look for arrows on the chart: Buy on green up arrow, Sell on red down arrow. Signals appear at the open of the new
BinaryScalping
Andrey Spiridonov
BinaryScalping is a professional indicator for trading binary options and scalping. The algorithm of the indicator is based on the calculation of pivot points for each time period separately, the location of the price of the trading instrument relative to the pivot points is analyzed and the probability of a trading operation is calculated. The indicator has a built-in filter of trading signals based on the global trend. The indicator is installed in the usual way and works with any trading inst
Smooth price for Monarch MT4
Konstantin Gruzdev
3.67 (3)
The Smooth Price technical indicator is used for plotting a smoothed line as close to the price of the financial instrument as possible, and serves to eliminate its noise components. The indicator is part of the Monarch trading system, but here it is presented as an independent technical analysis tool. The indicator is based on the cluster digital filter , which, unlike the ClusterSMA , is applied directly to the price time series. Smooth Price does not redraw (except the very last, zero bar) an
BinaryUniversal
Andrey Spiridonov
BinaryUniversal is a signal indicator for binary options and Forex. In its work, the indicator uses a complex algorithm for generating signals. Before forming a signal, the indicator analyzes volatility, candlestick patterns, important support and resistance levels. The indicator has the ability to adjust the accuracy of the signals, which makes it possible to apply this indicator for both aggressive and conservative trading. The indicator is set in the usual way, it works on any time period and
BinaryIndicator
Andrey Spiridonov
BinaryIndicator is a highly accurate indicator for trading binary options. It shows excellent results in scalping. This indicator is based in multifactor analysis of trend indicators, as well as confirmation oscillators, which in the end gives an increased accuracy of signals. Advantages of the indicator Increased accuracy of signals. Excellent results when trading binary options with a short expiration time from M30 to M1 . It works on any timeframes. Works with any trade symbols. Parameters
Owl smart levels
Sergey Ermolov
4.24 (37)
MT5 버전  |   FAQ Owl Smart Levels Indicator 는   Bill Williams 의 고급 프랙탈, 시장의 올바른 파동 구조를 구축하는 Valable ZigZag, 정확한 진입 수준을 표시하는 피보나치 수준과 같은 인기 있는 시장 분석 도구를 포함하는 하나의 지표 내에서 완전한 거래 시스템입니다. 시장과 이익을 취하는 장소로. 전략에 대한 자세한 설명 표시기 작업에 대한 지침 고문-거래 올빼미 도우미의 조수 개인 사용자 채팅 ->구입 후 나에게 쓰기,나는 개인 채팅에 당신을 추가하고 거기에 모든 보너스를 다운로드 할 수 있습니다 힘은 단순함에 있습니다! Owl Smart Levels   거래 시스템은 사용하기 매우 쉽기 때문에 전문가와 이제 막 시장을 연구하고 스스로 거래 전략을 선택하기 시작한 사람들 모두에게 적합합니다. 전략 및 지표에는 눈에 보이지 않는 비밀 공식 및 계산 방법이 없으며 모든 전략 지표는 공개되어 있습니다. Owl Smart Leve
Signal From Level
Yaroslav Varankin
Binary Options Support Resistance Indicator This indicator is designed for binary options trading and effectively shows retracements from support and resistance levels. Signals appear on the current candle. A red arrow pointing downwards indicates a potential selling opportunity, while a blue arrow pointing upwards suggests buying opportunities. All that needs adjustment is the color of the signal arrows. It is recommended to use it on the M1-M5 timeframes as signals are frequent on these timef
Alpha Trend sign has been a very popular trading tool in our company for a long time. It can verify our trading system and clearly indicate trading signals, and the signals will not drift. Main functions: Based on the market display of active areas, indicators can be used to intuitively determine whether the current market trend belongs to a trend market or a volatile market. And enter the market according to the indicator arrows, with green arrows indicating buy and red arrows indicating se
NostradamusMT4
Andrey Spiridonov
1 (1)
NostradamusMT4 is a powerful indicator from the set of professional trader. The indicator is based on Andrei Spiridonov's original price calculation method (ESTIMATED PRICE) for the current candle price. Advantages The indicator does not redraw. It works on any timeframes. Works with any trading instruments. Perfectly suitable for scalping and trading binary options. Parameters Color - color of the ESTIMATED PRICE FUTURE line. How to work with the indicator The indicator forms the ESTIMATED P
Insider Scalper Binary This tool is designed to trade binary options. for short temporary spends. to make a deal is worth the moment of receiving the signal and only 1 candle if it is m1 then only for a minute and so in accordance with the timeframe. for better results, you need to select well-volatile charts.... recommended currency pairs eur | usd, usd | jpy .... the indicator is already configured, you just have to add it to the chart and trade .... The indicator signals the next candle.
Power Renko MT4
Pierce Vallieres
Power Renko is an indicator which plots Renko bricks underneath the chart using a histogram. You can select the brick size and the timeframe of the Renko bricks as well as whether or not to use the close price or the high/low price of the candles. Renko bricks are based on price alone, not time, therefor the Renko bricks will not be aligned with the chart's time. They are extremely useful for trend trading and many different strategies can be formed from them. Buffers are provided allowing you t
WanaScalper MT4
Isaac Wanasolo
1 (1)
A scalping indicator based on mathematical patterns, which on average gives signals with relatively small SL, and also occasionally helps to catch big moves in the markets (more information in the video) This indicator has three main types of notifications: The first type warns of a possible/upcoming signal on the next bar The second type indicates the presence of a ready signal to enter the market/open a position The third type is for SL and TP levels - you will be notified every time price re
It will be the best tool for you to make a profit! Through unique algorithms You're going to see an amazing amount of right trading signals Make huge profits every day and realize more possibilities!   Like the car no money to buy it, the love of the girls dare not to pursue?Or the credit card bill is not paid, the rent does not have the extra money to settle?Or are you fed up with being bossed around by your boss and Hope to get more people's respect?Can't afford to buy the things you want ? wa
Limitless MT4
Dmitriy Kashevich
Limitless MT4 is a universal indicator suitable for every beginner and experienced trader. works on all currency pairs, cryptocurrencies, raw stocks Limitless MT4 - already configured and does not require additional configuration And now the main thing Why Limitless MT4? 1 complete lack of redrawing 2 two years of testing by the best specialists in trading 3 the accuracy of correct signals exceeds 80% 4 performed well in trading during news releases Trading rules 1 buy signal - the ap
Next level of trend trading here. Possibility 75%, the indicator analyzes the current market to determine short (small dot), middle (circle with a dot inside) and long (cross with a circle and a dot inside) trends.  Wingdings characters of  Aqua color represents the beginning of the UP trend. Wingdings characters of  Orange color represents the beginning of the DOWN trend. Possibility 75% Indicator will improve your trading in the world of forex, commodities, cryptocurrencies and indices.
Introduction It is common practice for professional trades to hide their stop loss / take profit from their brokers. Either from keeping their strategy to the themselves or from the fear that their broker works against them. Using this indicator, the stop loss / take profit points will be drawn on the product chart using the bid price. So, you can see exactly when the price is hit and close it manually.  Usage Once attached to the chart, the indicator scans the open orders to attach lines for t
Scalping Channel mq
DMITRII GRIDASOV
MT4용 Crypto_Forex 지표 "Scalping_Channel" - 스캘핑 채널에는 ATR 기반 변동성 경계가 있습니다. - 스캘핑 거래에 사용하기 좋습니다. - 중간선에서 조정 보류 제한 주문을 통해 거래를 시작합니다. - 녹색의 꾸준한 상승 채널이 나타나고 최소 1개의 캔들이 상단 경계선 위에서 마감되면 강세 진입을 고려합니다(그림 참조). - 빨간색의 꾸준한 하락 채널이 나타나고 최소 1개의 캔들이 하단 경계선 아래에서 마감되면 약세 진입을 고려합니다(그림 참조). ..................................................................................................................................................... // 뛰어난 트레이딩 로봇과 지표는 여기에서 확인할 수 있습니다: https://www.mql5.com/en/users/def1380/sel
Trendiness Index
Libertas LLC
5 (3)
"The trend is your friend" is one of the best known sayings in investing, because capturing large trendy price movements can be extremely profitable. However, trading with the trend is often easier said than done, because many indicators are based on price reversals not trends. These aren't very effective at identifying trendy periods, or predicting whether trends will continue. We developed the Trendiness Index to help address this problem by indicating the strength and direction of price trend
Powerful Binary Options
Ellan Dirgantara Tholkhah
This is the binary options signal you all have been looking for. This in a modified version of the Garuda Scalper, that has been modified for Binary Options traders. Signals are very unique! Why this is so effective for binary options is because  it is a trend following system, it understands that the trend is your friend. It takes advantage of the buying/selling after the pullback in continuation of the current trend wave.  Because  signals are generated after the pullback,   you can place shor
The Hurricane Cave Indicator shows different trade areas based on price action. It looks in the past and works out patterns that can enforce support and resistance as targets. When price breaks out of a trade area you can target just inside the next trade area. If you can't see the target just go to a slower time frame, it means the price hasn't been there for a long time. The Hurricane Cave Indicator is designed to be an add on to The Hurricane Forex Indicator also available in the Meta Trader
FREE
Super Reversal Pattern
Parfait Mujinga Ndalika
Super Reversal Pattern Indicator Unlock the power of advanced pattern recognition with our Super Reversal Pattern Indicator. Designed for traders seeking precision and reliability, this indicator identifies one of the most effective reversal patterns in technical analysis, offering a significant edge in your trading strategy. Key Features: Non-Repainting Accuracy: Enjoy the confidence of non-repainting technology. Once a Super Reversal Pattern is detected, it remains static, providing consiste
Auto Fibo Pro m
DMITRII GRIDASOV
"Auto FIBO Pro" Crypto_Forex 지표 - 거래에 유용한 보조 도구입니다! - 지표는 자동으로 Fibo 수준과 로컬 추세선(빨간색)을 계산하여 차트에 배치합니다. - Fibonacci 수준은 가격이 반전될 수 있는 주요 영역을 나타냅니다. - 가장 중요한 수준은 23.6%, 38.2%, 50%, 61.8%입니다. - 역전 스캘핑이나 존 그리드 거래에 사용할 수 있습니다. - Auto FIBO Pro 지표를 사용하여 현재 시스템을 개선할 수 있는 기회도 많습니다. - Info Spread Swap Display가 있습니다. 현재 Spread와 Swap이 부착된 외환 쌍을 표시합니다. - 디스플레이에는 계정 잔액, 자본 및 마진도 표시됩니다. - 차트의 어느 모서리에서나 Info Spread Swap Display를 찾을 수 있습니다. 0 - 왼쪽 상단 모서리, 1 - 오른쪽 상단, 2 - 왼쪽 하단, 3 - 오른쪽 하단. // 훌륭한 트레이딩 로봇과 지표는 여기
브레이크아웃 프로 스캘퍼 솔루션 이 표시기는 RPTrade Pro 솔루션 시스템의 일부입니다. Breakout Pro Scalper Solution은 Price Action, Dynamic Support 및 Resistance를 사용하는 일일 추세 지표입니다. 누구나 사용할 수 있도록 설계되었으며 거래의 절대 초보자도 사용할 수 있습니다. 다시 칠하지 마십시오. 표시는 닫기에서 닫기로 제공됩니다. 단독으로 사용하도록 설계되어 다른 표시기가 필요하지 않습니다. 당신에게 하루의 시작에 추세와 잠재적인 이익실현을 제공합니다. 특정 그래프는 이력 데이터에 따른 잠재적 이익을 보여줍니다. 어떻게 작동합니까 Breakout Pro Scalper Solution은 가격 조치 및 동적 지원 및 저항과 결합된 브레이크아웃 전략을 사용합니다. 야간 추세와 변동성은 다음날에 사용할 것으로 분석됩니다. 이 분석에서 브레이크아웃 한계(파란색 및 진한 주황색 선)와 이익실현(Take Profit)이
Gann Time Reversal Signals   are sophisticated trading concepts developed by Naveen Saroha using  W.D. Gann concepts that focus on predicting market turning points through the confluence of time cycles and price movements. Here are the key elements: Time-Balance : Gann famously stated, "When time is up, the market will reverse regardless of the price. This emphasizes that time cycles often take precedence over price levels in determining market reversals. Key Reversal Signals Price-Time Confluen
This indicator works on MT4 and is very easy to use. When you receive a signal from it, you wait for that candle with the signal to close and you enter your trade at the beginning of the next new candle . A red arrow means sell and a green arrow means buy. All arrows comes with Alert  like for easy identification of trade signal. Are you okay with that? 1 minute candle 1 minute expire
Towers
Yvan Musatov
Towers - Trend indicator, shows signals, can be used with optimal risk ratio. It uses reliable algorithms in its calculations. Shows favorable moments for entering the market with arrows, that is, using the indicator is quite simple. It combines several filters to display market entry arrows on the chart. Given this circumstance, a speculator can study the history of the instrument's signals and evaluate its effectiveness. As you can see, trading with such an indicator is easy. I waited for an a
Advanced Trend Regime
Shellard Securities (Pty) Ltd
The indicator has been designed to function on any time-frame and any pair.   This regime filter will help the trader better evaluate whether the current market is trending, and in which direction. It quickly reacts to changes in market dynamics using a series of advanced calculations. The user is able to select whether the calculation remains standard, or if a further filter constraint is added to the calculation.   A Yellow moving average of the signal has been included for the trader to smoot
Line Magnit
Aleksey Trenin
The LineMagnit Indicator for MT4 is a highly precise tool that builds support and resistance levels which magnetically attract prices. This feature allows traders to easily determine the most probable entry and exit points in the market, as well as identify the market's directional forces, as levels are based on capital inflows into the instrument. Equipped with an intuitively understandable graphical interface, the LineMagnit Indicator enables users to quickly locate and analyze support and res
A Boss Stats
Anthonius Soruh
Hi Trader, We are strategy development for Binary and Forex tools, our product have success for binary trading 1 min - 2 min experation. At the moment I build indicator for trading all day, not like Bonosu series with specific time. We launch A-Boss Stats Indicator for trading 1 minute to 5 minutes experation is mean can trade from 1 minutes - 5 minutes. Specification of A Boss Stats trading binary option: Work with all MT4 broker. Chart Time Frame M1 only, can use M5 Experation time for contact
이 제품의 구매자들이 또한 구매함
#EasyWayTradePanel indicator for #MetaTrader4 , is trade assistants for manual trading in any #currency in #FOREX , #CRYPTOCURRENCY as #Bitcoin , #Ethereum , #Lightcoin and more. Also is EasyWay to use for #COMMODITY as #Gold , #Silver , #Oil , #Gas ...... and #CFDs . When installed on the chart in your chosen time frame and trading tool, the indicator automatically draws the following custom indicators used in the EasyWayTradePanel trading strategy. 1) Zigzag_Extreme_Indicator, 2) Regression_C
Hit Rate Top Bottom Signal
Martin Alejandro Bamonte
히트율 탑 바텀 신호 히트율 탑 바텀 신호 히트율 탑 바텀 신호 는 완전히 혁신적인 접근 방식을 제공합니다. 특정 TP-SL과 PAIR/TF에서 어떤 성과를 내는지 미리 평가하고자 하는 분들께 이상적입니다. 전략 히트율 탑 바텀 신호 는 모든 트레이더와 모든 거래 유형 에게 필수적인 도구입니다. 이 전략은 정확한 리페인트 없는 신호 를 제공하여 언제 어떤 방향으로 거래해야 할지를 명확하게 제시할 뿐만 아니라 각 페어와 TF에 대한 상세한 성공률 기록 을 제공합니다. 사전 정의된 테이크 프로핏(TP)과 스톱 로스(SL)을 통해 신호의 효율성을 미리 알 수 있습니다 , 이는 효과적인 리스크 관리와 정확한 거래에 매우 중요합니다. 이 전략의 특징은 전체 움직임이 아닌 임펄스 내의 반전 지점을 감지하는 데 중점을 두고 있어 전통적인 탑-바텀보다 신호 발생 빈도가 높고, 시장의 주요 변동에서 핵심 순간을 포착하는 데 집중합니다. 이 전략은 SL/TP 비율과 결합된 신호의 과거 성과를
Dual Momentum
Adolfina Denysenko
Dual Momentum is a modern arrow indicator for MetaTrader 4, created specifically for the accurate detection of market reversals and strong impulse movements. The indicator is based on a combination of two powerful oscillators – Williams %R and RSI, which allows you to filter noise and generate more reliable signals. Thanks to this, Dual Momentum indicates only key entry points when the probability of a successful trade is highest. Key advantages: No redrawing – signals remain on the cha
Predictive Levels
Satya Prakash Mishra
Market predictive price levels are key technical analysis tools is my finest invention through mathematics to predict automatically next price is where to reach after break any levels. A unique name quality it automatically calculate price range its my own invention according price value to predict what's is next price came than after it not fixed levels like Fibonacci or pivots Its Naveen's Predictive Levels .used to forecast where an asset's price might find support (stop falling) or resistanc
Support and Resistance Levels is an intelligent indicator that displays horizontal support and resistance levels, suitable for traders of different trading frequencies. You can select your preferred trading frequency, and the indicator will automatically calculate the support and resistance levels relevant to that frequency. Among these, the Bull-Bear Line is an interval used to distinguish the strength of bullish and bearish forces, and is an important level. You can combine it with other ind
FFx Engulfing Setup Alerter gives trade suggestions with Entry, Target 1, Target 2 and StopLoss. Below are the different options available: Entry suggestion - pips to be added over the break for the entry 3 different options to calculate the SL - by pips, by ATR multiplier or at the pattern High/Low 3 different options to calculate the 2 TPs - by pips, by ATR multiplier or at Risk/Reward Offset the dashboard - any place on the chart Remove the suggestion once the price reached the SL line Lines
FFx InsideBar Setup Alerter gives trade suggestions with Entry, Target 1, Target 2 and StopLoss. Below are the different options available: Entry suggestion - pips to be added over the break for the entry Minimum candle size - to avoid too close buy/sell entry suggestions 3 different options to calculate the SL - by pips, by ATR multiplier or at the pattern High/Low 3 different options to calculate the 2 TPs - by pips, by ATR multiplier or at Risk/Reward Offset the dashboard - any place on the c
FFx OutsideBar Setup Alerter gives trade suggestions with Entry, Target 1, Target 2 and StopLoss. Below are the different options available: Entry suggestion - pips to be added over the break for the entry. 3 different options to calculate the SL - by pips, by ATR multiplier or at the pattern High/Low. 3 different options to calculate the 2 TPs - by pips, by ATR multiplier or at Risk/Reward. Offset the dashboard - any place on the chart. Remove the suggestion once the price reached the SL line.
FFx PinBar Setup Alerter gives trade suggestions with Entry, Target 1, Target 2 and StopLoss. Below are the different options available: Entry suggestion - pips to be added over the break for the entry Minimum candle size - to avoid too small candles 3 different options to calculate the SL - by pips, by ATR multiplier or at the pattern High/Low 3 different options to calculate the 2 TPs - by pips, by ATR multiplier or at Risk/Reward Offset the dashboard - any place on the chart Remove the sugges
Lineverse Trendlines
Arkady Segal
5 (1)
Automatic, live & interactive picture of all trendlines. Assign push, email and sound alerts to the lines of your choice and be informed about price rollback, breakout, rollback after breakout, number of rollbacks, line expiration by double breakout. Correct, drag or delete the lines and interactively tune the line system. https://youtu.be/EJUo9pYiHFA . Chart examples https: //www.mql5.com/en/users/efficientforex Price Interaction Events All events are effective immediately and only after one
FFx MACD Divergences
Eric Venturi-Bloxs
The purpose of this new version of the MT4 standard indicator provided in your platform is to display in a sub-window multiple timeframes of the same indicator with its divergences. See the example shown in the picture below. But the display isn't like a simple MTF indicator. This is the real display of the indicator on its timeframe. Here's the options available in the FFx divergences indicator: Select the timeframes to be displayed (M1 to Monthly) Define the width (number of bars) for each tim
FFx RSI Divergences
Eric Venturi-Bloxs
The purpose of this new version of the MT4 standard indicator provided in your platform is to display in a sub-window multiple timeframes of the same indicator with its divergences. See the example shown in the picture below. But the display isn't like a simple MTF indicator. This is the real display of the indicator on its timeframe. Here's the options available in the FFx divergences indicator: Select the timeframes to be displayed (M1 to Monthly) Define the width (number of bars) for each tim
FFx CCI Divergences
Eric Venturi-Bloxs
The purpose of this new version of the MT4 standard indicator provided in your platform is to display in a sub-window multiple timeframes of the same indicator with its divergences. See the example shown in the picture below. But the display isn't like a simple MTF indicator. This is the real display of the indicator on its timeframe. Here's the options available in the FFx divergences indicator: Select the timeframes to be displayed (M1 to Monthly). Define the width (number of bars) for each ti
The FFx Dashboard MTF alerter will show you on a single chart all the timeframes (M1 to Monthly) with their own status for the indicator. 2 Alert Options: Single timeframe: each selected timeframe alert separately when a signal occurs Multi timeframes: all selected timeframes must agree for an alert to be triggered Both options have an input to select the timeframes to be used for the alert(s). How to Understand the Status: Green/Red square: histogram above/below 0 line Green square + Red bord
The FFx Dashboard MTF alerter will show you on a single chart all the timeframes (M1 to Monthly) with their own status for the indicator. 2 Alert Options: Single timeframe: each selected timeframe alert separately when a signal occurs Multi timeframes: all selected timeframes must agree for an alert to be triggered Both options have an input to select the timeframes to be used for the alert(s). How to understand the status: Green/Red square: RSI above/below 50 line Green square + Red border: R
The FFx Dashboard MTF alerter will show you on a single chart all the timeframes (M1 to Monthly) with their own status for the indicator. 2 Alert Options: Single timeframe: each selected timeframe alert separately when a signal occurs Multi timeframes: all selected timeframes must agree for an alert to be triggered Both options have an input to select the timeframes to be used for the alert(s). How to understand the status: Green/Red square: Stoch above/below 50 line Green square + Red border:
The FFx Dashboard MTF alerter will show you on a single chart all the timeframes (M1 to Monthly) with their own status for the indicator. 2 Alert Options: Single timeframe: each selected timeframe alert separately when a signal occurs Multi timeframes: all selected timeframes must agree for an alert to be triggered Both options have an input to select the timeframes to be used for the alert(s). How to understand the status: Green/Red square: Price above/below Cloud (Kumo) Green square + Red bo
The FFx Dashboard MTF alerter will show you on a single chart all the timeframes (M1 to Monthly) with their own status for the indicator. 2 Alert Options: Single timeframe: each selected timeframe alert separately when a signal occurs Multi timeframes: all selected timeframes must agree for an alert to be triggered Both options have an input to select the timeframes to be used for the alert(s). How to understand the status: Green/Red square: MA pointing Up/Down Green square + Red border: MA po
The FFx Dashboard MTF alerter will show you on a single chart all the timeframes (M1 to Monthly) with their own status for the indicator. 2 Alert Options: Single timeframe: each selected timeframe alert separately when a signal occurs. Multi timeframes: all selected timeframes must agree for an alert to be triggered. Both options have an input to select the timeframes to be used for the alert(s). How to understand the status: Green square: Price above PSAR Red square: Price below PSAR Options
The FFx Dashboard MTF alerter will show you on a single chart all the timeframes (M1 to Monthly) with their own status for the indicator. 2 Alert Options: Single timeframe: each selected timeframe alert separately when a signal occurs Multi timeframes: all selected timeframes must agree for an alert to be triggered Both options have an input to select the timeframes to be used for the alert(s). How to understand the status: Green/Red square: CCI above/below levels (ie. 100/-100) Grey square: C
The FFx Dashboard MTF alerter will show you on a single chart all the timeframes (M1 to Monthly) with their own status for the indicator. 2 Alert Options: Single timeframe: each selected timeframe alert separately when a signal occurs Multi timeframes: all selected timeframes must agree for an alert to be triggered Both options have an input to select the timeframes to be used for the alert(s). How to understand the status: Green/Red square: ADX above level Grey square: ADX below level Red bor
The FFx Dashboard MTF alerter will show you on a single chart all the timeframes (M1 to Monthly) with their own status. 2 Alert Options: Single timeframe: each selected timeframe alert separately when a signal occurs Multi timeframes: all selected timeframes must agree for an alert to be triggered Both options have an input to select the timeframes to be used for the alert(s). How to understand the status: Green/Red square: bullish/bearish candle Options available in the FFx Dashboard Alerter
The indicator of a Professional Trader is an arrow indicator for predicting the direction of price movement. I have been working on this indicator since 2014. You can use this indicator as your main indicator, use its entry signals, and use it as your only indicator to find entry points. About the product: Recommended TF [H4-D1-W1]   . The indicator predicts the direction of the next candle. Fits a variety of tools; Flexibility in settings for different instruments and intervals through the MO
THE GRAFF III
Antonin Skaryd
The [GRAFF] III manual trading system is based on multiple MetaTrader (MT4) indicators. Together, the entire PACK of GRAFF III indicators makes an advanced trading tool. The system consists of over 20 different custom-built indicators which have been carefully selected and tested in the long term to produce strong and efficient trading signals. The particular indicators are based on different mathematical formulas, so the entire system is calibrated to remove false signals from its own indicator
FFx Universal Strength Meter PRO is more than a basic strength meter. Instead of limiting the calculation to price, it can be based on any of the 19 integrated strength modes + 9 timeframes. With the FFx USM, you are able to define any period for any combination of timeframes. For example, you can set the dashboard for the last 10 candles for M15-H1-H4… Full flexibility! Very easy to interpret... It gives a great idea about which currency is weak and which is strong, so you can find the best pai
A simplistic indicator informing a user on RSI divergence by sending messages to mobile device and email. The indicator draws 2 vertical lines, marking two RSI extrema that formed the divergence. You get the alert, open the charts and make a decision. The indicator does not show past divergences, thus when you attach it to a chart for the first time you see nothing. Graphics and alerts will appear as soon as divergences do. Drop it in Tester to see how it works. Parameters: RSIPeriod - number of
Pan PrizMA CD Phase is an analogue of the МetaТrader 5 indicator , and is an option based on the Pan PrizMA indicator. Details . Averaging by a quadric-quartic polynomial increases the smoothness of lines, adds momentum and rhythm. Extrapolation by the sinusoid function near a constant allows adjusting the delay or lead of signals. The value of the phase - wave status parameter (which is close in meaning to the trigonometric phase or the angle of the radius-vector rotation in the trigonometric p
Green Wall Arrows
Daniel Luchinger
1 (1)
The Name Green Wall : Arrows hits a lot of TP, by changing the idea of non using SL as something bad, but instead use Small TP and a lot of free Margin and Patience. Use micro TP and a lot of Free Margin with this indicator on Forex. It also can be used with Binary Options. This strategy is intended to be traded Manually. This Indicator runs on Open Bar, arrows will delete when price are against it. The only Indicator Parameter is Alerts true/false, all the rest is included inside the code. Arro
제작자의 제품 더 보기
Perhaps you have previously read in technical analysis books about such a concept as "market slope", or "trend slope". Metatrader has such a tool as "trend line by angle". But when working on auto-scaled charts, this tool becomes completely abstract, and as a consequence, useless. The idea of this new parameter, included in the AllAverages_Speed indicator, is to give such a concept as "trend slope" specific numerical values, as well as the further use of the new parameter in work.     Modifica
필터:
리뷰 없음
리뷰 답변