Neue technische Indikatoren für den MetaTrader 4 - 60
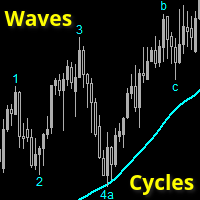
Wellen- und Zykluszähler , der sofort anzeigt, wie weit der laufende Trend fortgeschritten ist.
Niedrige Zahlen: Der Trend hat gerade erst begonnen, folgen Sie dem Trend. Höhere Zahlen: Der Trend ist "älter", achten Sie auf Umkehrungen
Dieser Indikator ist zu 100 % mit der fantastischen TopDog-Handelsstrategie kompatibel.
(Ich werde KEINE Einzelheiten über diese TopDog-Strategie nennen)
Die Trendrichtung wird durch einen SMA-Wert (oder einen anderen MA) bestimmt, den Sie einstellen können.
Die

Der Candle Timer zeigt die verbleibende Zeit bis zum Schließen des aktuellen Balkens an, während sich ein neuer Balken bildet.
Funktion einfach zu bedienen . keine Verzögerung . Position, Farbe und Schriftgröße können angepasst werden. Serverzeit, nicht Ortszeit.
Eingaben
- Position * Neben der aktiven Kerze ( Standard ) * Rechts oben * Oben oben * Rechts Unten * Unten anheben - Schriftgröße * 14 (Standard) - Farbe * SpringGreen (Standard)
FREE

MACD Farbe für GOLD Verwenden Sie diese Funktion, um die Bewegung des Graphen zu beobachten und zu prüfen, ob Sie kaufen oder verkaufen wollen. Einfach zu erkennen an der Farbe der Kurve. Rot ist abwärts / Blau ist aufwärts. Kann mit jedem Zeitrahmen verwendet werden durch 1. Long-Trade: Verwenden Sie es mit dem Zeitrahmen H1 / H4 / Daily 2. Short Trade: Verwenden Sie es mit dem Zeitrahmen M5 / M15 / M 30 / H1 und Sie können sehen, wann Sie die Aufträge öffnen oder schließen werden, indem Sie di

Dies ist ein Werkzeug, um die Geschwindigkeit des Preises zu messen. Es ist völlig kostenlos, Sie können es herunterladen und benutzen. "Weg: Entfernung des Preises nach einem Tick." "Geschwindigkeit: Geschwindigkeit des Preises nach einem Tick." p/s: Die Zeit für den Preis zu springen 1 Tick wird nicht festgelegt werden, sollten Sie dies wissen. Wenn Way > 0 ist, ändert der Indikator seine Farbe in Grün. Wenn Way < 0 ist, ändert der Indikator seine Farbe in Rot. || Ich bin 3D-Künstler und lieb
FREE

MACD (kurz für Moving Average Convergence/Divergence ) ist ein beliebter Handelsindikator, der in der technischen Analyse von Wertpapierkursen verwendet wird. Er wurde entwickelt, um Veränderungen in der Stärke, Richtung, Dynamik und Dauer eines Trends im Preis eines Wertpapiers zu erkennen.
Geschichte Gerald Appel entwickelte die MACD-Linie in den späten 1970er Jahren. Thomas Aspray fügte dem MACD von Appel 1986 die Histogramm-Funktion hinzu.
Die drei Hauptkomponenten und ihre Formel 1. Die

OB Breakout ist ein Warnindikator, der anzeigt, wann sich ein Trend oder eine Preisbewegung der Erschöpfung nähert (Angebot und Nachfrage) und zur Umkehr bereit ist. Er macht Sie auf Veränderungen in der Marktbewegung aufmerksam, die typischerweise auftreten, wenn eine Umkehr oder größere Rückschläge bevorstehen oder bereits stattgefunden haben. Der Indikator identifiziert Ausbrüche und Preisimpulse zunächst immer dann, wenn sich ein neuer Höchst- oder Tiefststand in der Nähe eines möglichen Ang

Schlüssel-Level Key Level ist ein MetaTrader 4-Indikator, der einen proprietären Algorithmus verwendet, der auf der Price Retracement/Breakout-Methode basiert, um die Einstiegslinie für Ihren Handel anzuzeigen.
Stattdessen analysiert er die Marktdaten und identifiziert Einstiegspunkte und Gelegenheiten. (Price Retracement / Price Breakout)
Es ist auch ein Handelswerkzeug, das zum Üben und Verbessern Ihrer manuellen Handelsfähigkeiten verwendet werden kann.
Key Level ist ein erstaunliches Werkzeu

Momentum Breakout Finder (MoBlast) ist ein Indikator, der auf dem Volumen basiert, um herauszufinden, wann das aktuelle Paar ausbricht und wann der Markt in einem bestimmten Bereich liegt. Oszillator-Indikatoren wie RSI und MACD , die für ein bestimmtes Marktintervall gut funktionieren, erzeugen keine profitablen Signale, wenn sich die Marktbedingungen ändern, und produzieren daher falsche Signale, was zu großen Verlusten führt. Dieser Indikator implementiert einen Volumenlogik-Algorithmus, der
Moderner Indikator für das Key-Pivot-Muster. Er verfügt über Zeitrahmeneinstellungen. Sie können die Anzahl der Balken festlegen, die der Indikator auf dem Chart anzeigen soll. Der Indikator wird vorzugsweise auf dem Stunden-Zeitrahmen und darüber verwendet, funktioniert aber auch darunter. Er kann mit jeder Strategie verwendet werden. Anzeigebedingung: Welcher Zeitrahmen wird in den Einstellungen angegeben, markieren Sie das Kontrollkästchen auf der Registerkarte Anzeige. Sie können einen gleit

Moderner Indikator der PinBar-Muster von RAIT Handelsstrategie. Funktioniert im Trend und ohne Trend. Er verfügt über Zeitrahmeneinstellungen für die Anzeige. Sie können die Anzahl der Balken für die Anzeige des Indikators auf dem Chart einstellen. Es werden mehrere PinBar-Muster verwendet. Der Indikator wird vorzugsweise auf dem Stunden-Zeitrahmen und darüber verwendet, funktioniert aber auch darunter . Muster: PinBar, InsPinBar, PinInside. Wird mit einem einzelnen Pfeil angezeigt.
RumahForexID Momentum Scalping Indicator ist der beste Momentum-Indikator, der jemals entwickelt wurde, und warum ist das so? Der Indikator funktioniert auf allen Zeitrahmen und Vermögenswerte, der Indikator ist nach 6 Jahren Erfahrung in Forex gemacht. Sie wissen, dass viele Momentum-Indikatoren im Internet sind nicht hilfreich, und schwer zu handeln, aber RumahForexID Momentum Scalping Indicator ist anders, Der Indikator zeigt Welle Momentum, wenn der Markt im Begriff ist, Trend oder Konsolid

Dieser Indikator ist eine hervorragende Kombination aus unseren 2 Produkten Advanced Currency IMPULSE with ALERT + Currency Strength Exotics .
Es funktioniert für alle Zeitrahmen und zeigt grafisch Impulse der Stärke oder Schwäche für die 8 wichtigsten Währungen plus ein Symbol!
Dieser Indikator ist darauf spezialisiert, die Beschleunigung der Währungsstärke für beliebige Symbole wie Gold, Exotische Paare, Rohstoffe, Indizes oder Futures anzuzeigen. Als erster seiner Art kann jedes Symbol

MT5 version | Owl Smart Levels Indikator | Owl Smart Levels-Strategie | FAQ
Der Fractals Indikator ist eines der Elemente der Handelsstrategie des Autors von Bill Williams . Es wird verwendet, um nach Preisumkehrpunkten auf dem Preisdiagramm und folglich nach Unterstützungs- und Widerstandsniveaus zu suchen. Der Full Fractals Indikator ist ein verbesserter Fractals, der im Toolkit fast aller Handelsterminals verfügbar ist. Der einzige Unterschied besteht darin, dass wir zum Erstellen ei
FREE

MT5-Version | Trend Monitor VZ-Indikator | Owl Smart Levels-Indikator | Owl Smart Levels-Strategie | FAQ Die Elliott-Wellentheorie ist eine Interpretation von Prozessen an den Finanzmärkten, die auf einem visuellen Wellenmodell in den Preisdiagrammen beruht. Der Valable ZigZag Indikator zeigt die Wellenstruktur des Marktes an, auf die Sie sich verlassen können, um Handelsentscheidungen zu treffen. Der Valable ZigZag-Indikator ist stabiler und ändert seine Richtung nicht oft wie d
FREE
Verbessern Sie Ihr Price-Action-Trading mit dem Higher Highs and Lows MT4-Indikator, einem robusten Tool, das Fraktal-Analyse nutzt, um Schlüssel-Swing-Punkte zu lokalisieren und trenddefinierende Muster wie Higher Highs (HH), Lower Highs (LH), Lower Lows (LL) und Higher Lows (HL) zu identifizieren, für klare Einblicke in die Marktrichtung. Basierend auf grundlegenden Price-Action-Prinzipien, die in der Dow-Theorie aus den frühen 1900er Jahren verwurzelt sind und im modernen Trading durch Expert
FREE
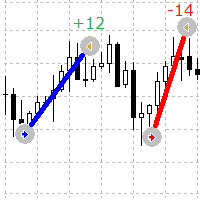
Ein einfacher, aber nützlicher Indikator, um die Ein- und Ausstiegspunkte von Aufträgen auf dem Chart visuell zu sehen
Dieser Indikator zeigt aktuelle offene Orders und abgeschlossene Orders auf dem Symbol
Indikatorparameter
Lines Buy color - gibt die Farbe der Linien für Kaufaufträge an Lines Sell color - legt die Farbe der Linien für Verkaufsaufträge fest Lines Width - legt die Linienbreite fest, funktioniert für Solid-Stiltypen Lines style - legt den Linienstil fest Lines positive profit
FREE

Der R Delta RSI-Indikator zeichnet ein farbiges Kauf- und Verkaufshistogramm basierend auf dem Crossover eines schnellen RSI (Periode 14) und eines langsamen RSI (Periode 50) zusammen mit einem Signalpegel.
Ein rot gefärbtes Histogramm zeigt an, dass der Trend bullisch ist (Kaufsignal). Ein grün gefärbtes Histogramm zeigt an, dass der Trend rückläufig ist (Verkaufssignal). Ein graues Histogramm zeigt an, dass der Trend flach oder bereichsgebunden ist (kein Signal).
Dieser Forex-Indikator kann
UR-Bänder (mit einer Formel, die in maschinellen Lernsystemen verwendet wird)
UR Bands ist ein Indikator, der durch eine Formel abgeleitet wird, die die Marktvolatilität berücksichtigt und im Prinzip denen ähnelt, die in maschinellen Lernsystemen verwendet werden. Diese mathematische Darstellung der Marktbedingungen bietet eine präzise Analyse von Preistrends und -dynamiken unter Berücksichtigung der inhärenten Volatilität der Finanzmärkte. Durch die Einbeziehung der Volatilität als Variable b

Der Forex-Indikator R Ease Of Movement Metatrader 4 ist ein blauer EMZ-Handelsoszillator. Es ist ein Forex-Indikator vom Oszillatortyp, der einen bullischen und bärischen Handelsbereich erzeugt. Werte über dem Nullniveau werden als bullish bezeichnet, während Werte unter dem Nullniveau als bearish bezeichnet werden.
Der R Ease Of Movement-Oszillator liefert allein keine guten Ergebnisse, er muss in Verbindung mit einem trendfolgenden technischen Indikator gehandelt werden. Gute Forex-Trendindi

UR PulseScalp Ein kalibrierter Handelsindikator für Scalper, die den ultimativen Vorteil in schnelllebigen Märkten suchen
UR PulseScalp ist eine hochmoderne Handelslösung für Scalper, die den ultimativen Vorteil in schnelllebigen Märkten suchen. Dieser innovative Indikator basiert auf einer wissenschaftlich kalibrierten Formel, die die Kraft von Volatilität, MoneyFlow und Relative Strength kombiniert, um ein hochpräzises und zuverlässiges Signal zu erzeugen.
Vorteile der Verwendung von UR Pu

Der R Show Ticks-Indikator für Metatrader 4 zeigt die Aufwärts-/Abwärts-Ticks in Echtzeit im Haupthandelsfenster.
Die zentralen Thesen Ein weißer Pfeil ist ein Aufwärtstrend. Ein roter Pfeil ist ein Abwärtsstrich. Der Indikator funktioniert für jedes Währungspaar und jeden Zeitrahmen Ihrer Wahl.
Indikatorspezifikationen Handelsplattform: Entwickelt für Metatrader 4 (MT4)
Währungspaare: Funktioniert für jedes Paar
Zeitrahmen: Funktioniert für jeden Zeitrahmen
Eingabeparameter: Eingabesymbol
FREE

Kontaktieren Sie mich nach der Bezahlung , damit ich Ihnen das Benutzerhandbuch als PDF-Datei zusenden kann. Harmonischer Handel Das Geheimnis sind die Fibonacci. Es ist an den Märkten bewiesen, dass der Preis immer auf Fibonacci-Levels reagiert. Fibonacci-Levels sind einer der wichtigsten Indikatoren für Kursveränderungen. Manchmal bildet die Abfolge der Reaktionen auf diese Niveaus im Chart geometrische Formen, die als harmonische Muster bezeichnet werden. Der Preis erzeugt mit seinen Schwank

Dieser Indikator ist ein echter Momentum-Oszillator im Sinne der wahren Definition von "Momentum", wie er durch die Techniken der digitalen Filterung realisiert wird. (Hinweis : Laden Sie hier einen vollständigen Satz echter Momentum-Oszillatoren herunter ). Eine wissenschaftliche Abhandlung des derzeitigen Entwicklers zu diesem Thema finden Sie hier , aber in dieser Beschreibung werden wir nur das Minimum an konzeptionellem und mathematischem Rahmen verwenden. Dabei entlarven wir einige seit la
FREE
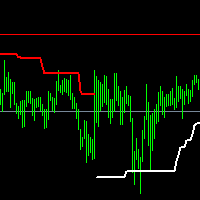
SPT ist ein Trendindikator Er wird auf der Grundlage von ATR geschrieben, mit klaren Trendlinien, die die laufende Richtung anzeigen, Unterschiedliche Trader verstehen diesen Indikator für zwei verschiedene Zwecke Trendorientierte Trader führen einen Trendhandel durch, wenn sich die Trendlinie ändert, Händler, die auf einen respektvollen Schock setzen, handeln in einer Handelsspanne, die sich an der endgültigen Unterstützungs- oder Widerstandslinie orientiert, die dieser Indikator markiert.
Die

RSI-DIVERGENZ-INDIKATOR
Die RSI-Divergenz ist ein sehr aussagekräftiges Muster, das oft verwendet wird, um eine starke Trendumkehr zu erkennen. Sie zeigt auch die Abschwächung eines starken Signals an. Daher möchten einige Händler sie als Ausstiegskriterium verwenden. Dieser Indikator funktioniert in allen Zeitrahmen und sendet Benachrichtigungen, Alarme oder E-Mails an den Benutzer. Er zeigt auch das Muster der höheren Hochs und niedrigeren Tiefs mit der entsprechenden RSI-Divergenz an. Dieser
FREE

Letzte Änderungen in 1.6 : Eingang für Signalmodi hinzugefügt. Modus 1 : HPF positiv geht lang blau, HPF negativ geht kurz rot. Modus 2 : nur langsame Hüllkurve, HPF oberhalb der oberen Hüllkurve geht lang blau, HPF unterhalb der unteren Hüllkurve geht kurz rot. Modus 3 : HPF oberhalb beider oberer Hüllkurven - langes Blau, HPF unterhalb beider unterer Hüllkurven kurzes Rot. Modus 4 : Long blau gehen, wenn HPF oberhalb der oberen langsamen Hüllkurve liegt, aber die obere schnelle Hüllkurve soll
FREE

Der True Hero Oscillator Indikator ist für den Signalhandel konzipiert. Dieser Indikator erzeugt Trendsignale.
Er verwendet viele Algorithmen und Indikatoren, um diese Signale zu erzeugen. Er versucht, Signale von den Punkten mit dem höchsten Trendpotenzial zu erzeugen.
Dieser Indikator ist ein vollständiges Handelsprodukt. Dieser Indikator benötigt keine zusätzlichen Indikatoren. Dieses Produkt verwendet 3 Hauptindikatoren und viele Algorithmen.
Der Indikator wird nie neu gezeichnet. Der Pu
"WENN SIE EINEN EINZIGARTIGEN HANDELSINDIKATOR SUCHEN... ZU EINEM ERSCHWINGLICHEN PREIS... DANN SIND SIE HIER GENAU RICHTIG!" Zusätzlicher Bonus: Sie erhalten den Forex Trend Commander Indicator absolut kostenlos! Erfolgreiche Trader können jedes nicht so gute Handelssystem in ein profitables verwandeln, indem sie das Geld richtig verwalten! Mit zwei eingebauten Systemen generiert DayTradingArrow v1 einen hohen Prozentsatz an erfolgreichen Trades. Der Indikator gibt jedem, der ihn benutzt, eine

aktualisiert versteckte Markt Unterstützung und Widerstand. Dieser Indikator ist für neue aktuelle Markt, die neue Unterstützung und Widerstand, dass einige Händler kämpfen zu sehen hat gemacht. Der Indikator funktioniert auf allen Zeitrahmen von der 1-Minuten-Zeitrahmen, um die monatliche Ein Trading-Tipp zur Verwendung Wenn sich der Kurs am Widerstand befindet und der Indikator erscheint, warten Sie auf den Abschluss einer bärischen Kerze und handeln Sie dann mit einem Verkauf. Das Gleiche
FREE

Dieser Indikator behebt einen unerkannten Fehler im Commodity Channel Index Oscillator (CCI). Der CCI basiert auf einem Hochpassfilter, der berechnet wird, indem der einfache gleitende Durchschnitt einer p-Periode eines Preissignals (normalerweise ein typischer Wert) vom Preissignal selbst abgezogen wird. Anschließend wird das Ergebnis durch die absolute mittlere Abweichung desselben Zeitraums geteilt. Der Frequenzgang eines Signals abzüglich seines einfachen gleitenden Durchschnitts ist im erst
FREE
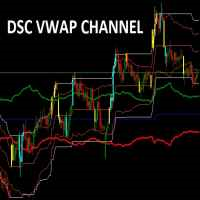
Corretora recomendada para usar esse indicador: https://tinyurl.com/5ftaha7c
Indikator für die Anzeige von Widerstandspunkten im Bild. Funktioniert in allen Bereichen und Zeiträumen.
Erkennen Sie genau die Eingangs- und Ausgangspunkte Ihrer Operationen. S EHEN SIE UNSERE ERGEBNISSE AUF INSTAGRAM: https: //www.instagram.com/diogo.cansi/ TELEGRAMMGRUPPE = https://t.me/robosdsc Mehr Informationen per E-Mail dscinvestimentos@gmail.com oder per Whatsapp 55-991372299
FREE

Dieser Indikator wendet den Biquad-Hochpassfilter auf die Preisdiagrammdaten an und zeigt die Filterausgabe für den OHLC als Kerzenständer an. Die Candlesticks entsprechen den tatsächlichen Berechnungen des Filterwerts während der Bildung jedes Kursbalkens (nicht aus allen historischen Höchst-, Tiefst- oder Schlusskursen). Die Form der Balken entspricht daher direkt der Form der einzelnen Kursbalken. Hochpassfilter sind ein unterschätzter Oszillatortyp, der in der technischen Analyse nur selten
FREE
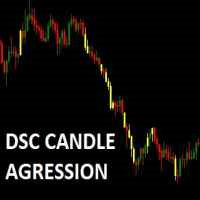
Corretora recomendada para usar esse indicador: https://tinyurl.com/5ftaha7c Indikator, der die Kerze in Phasen großer Bewegung auf dem Markt anzeigt. Sobald sich der Markt bewegt, wird die Kerze in die Höhe schnellen. Gültig für alle Märkte und alle Zeitrahmen. S EHEN SIE SICH UNSERE ERGEBNISSE AUF INSTAGRAM AN: https://www.instagram.com/diogo.cansi/ TELEGRAM GROUP =. https://t.me/robosdsc Mehr Informationen per E-Mail dscinvestimentos@gmail.com oder per Whatsapp 55-991372299
FREE
AC Pivot Panel - Ihr ultimatives Pivot-Handelswerkzeug Das AC Pivot Panel ist ein leistungsstarker und dennoch benutzerfreundlicher Pivot-Indikator, der Händlern hilft, wichtige Unterstützungs- und Widerstandsniveaus leicht zu erkennen. Ob Sie Anfänger oder erfahrener Trader sind, dieser Indikator vereinfacht den Pivot-Handel und verbessert Ihren Entscheidungsprozess. Hauptmerkmale : Interaktive Auswahltafel : Passen Sie die Pivot-Einstellungen mit Hilfe eines kompakten und intuitiven Panels di
FREE

Die Abweichung hat einen Kauf- und Verkaufseingang. Finden Sie die Zahl heraus, nach der Sie handeln sollen. Sie entspricht dem MACD. Studieren Sie die Werte der Vergangenheit, um Eingaben für den Handel zu erhalten. Verwenden Sie den Indikator in Aufwärts- oder Abwärtstrends und folgen Sie dem größeren Trend für Einstiegspunkte oder Umkehrungen. Verwenden Sie andere Filter oder Strategien, um den Indikator für den Erfolg einzusetzen. - ist kaufen und + ist Verkaufen. Handeln Sie auf Zeitrahmen
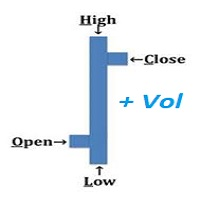
Ein "Intraday"-Indikator macht oberhalb von H1 keinen Sinn mehr !! VOHLC wird nach folgender Formel berechnet: VOHLC= ( Preis * Volumen ) / Volumen Wobei Preis= ( Open + High + Low + Close ) / 4 Volumen= Tick-Volumen Dieser Indikator hilft uns, die aktuelle Richtung des Trends im ausgewählten Zeitraum zu verstehen. In der Regel wird der Indikator für einen Tag berechnet, so dass es keinen Grund gibt, ihn auf Zeitrahmen zu verwenden, die größer sind als der H1-Zeitrahmen.
Dies ist ein Breakout-Indikator für MT4, mit dem Sie Trades eröffnen können, nachdem ein Breakout stattgefunden hat. Dieser Indikator zeichnet blaue Boxen auf dem Chart. Sie müssen einfach dem Preis folgen, bis er aus der Box ausbricht und sicherstellen, dass die Kerze über dem Ausbruch geschlossen hat, wenn es sich um einen Kauf handelt, und die Kerze muss darunter schließen, wenn es sich um einen Verkauf handelt. Es erscheint nun eine Warnung mit einem vorgeschlagenen Einstiegskurs und einem S

UR Vortex
Die probabilistische UR Vortex-Formel: Ein genaues System zur vorausschauenden Marktanalyse unter Verwendung von Volatilitäts- und Standardabweichungsberechnungen. Der UR Vortex-Indikator ist ein technisches Analyseinstrument, das Volatilitäts- und Standardabweichungsberechnungen verwendet, um potenzielle Höchst- und Tiefststände eines Marktes vorherzusagen. Er misst die Stärke eines Trends, indem er den Abstand zwischen dem aktuellen Kurs und einem gleitenden Durchschnitt berechnet un

Vorperiode Hoch-Tief . Dieser Indikator zeigt die Höchst- und Tiefstwerte des vorangegangenen Tages, der Woche, des Monats und des Jahres an. Er ist ideal für Preisaktionsstrategien. : Bietet klare und sichtbare Brüche in der Struktur. : Leicht zu erkennende Ausbruchsniveaus. : Einfaches Erkennen von Lücken zwischen früheren Höchst- und Tiefstständen nach Ausbrüchen. Der Indikator funktioniert auf jedem Zeitrahmen. Es können mehrere Zeiträume ausgewählt und auf demselben Diagramm angezeigt werde

Dieser Indikator verwendet mehrere Indikatoren, um hochgewinnende Signaltrades zu generieren Der R-Signals-Indikator ist ein komplettes FX-Handelssystem, das genaue Kauf- und Verkaufspfeile auf dem Chart druckt.
Der Indikator erscheint im Hauptfenster des MT4-Charts als farbige grüne und rote Pfeile.
Die Verwendung von Signalen, die von einem einzelnen Indikator generiert werden, kann beim Handel riskant sein. Dies liegt daran, dass die Verwendung von nur einem Indikator für den Handel mehr f

Ein genauer CCI-Indikator ist verfügbar.
Dashboard Trendleiste Smart Level 9TF Double CCI. Doppelter CCI, d.h. Fast CCI & Slow CCI Warum brauchen Sie ein zweites CCI? Die Verwendung zusätzlicher Indikatoren wird uns im Live-Handel mehr überzeugen 9TF Fast CCI-Kurve 9TF Langsame CCI-Kurve 9TF Echtzeit-CCI-Winkel 9TF Echtzeit-CCI-Wert 9TF Echtzeit-CCI-Richtung/Phase 9TF Trendleiste Neuer Algorithmus bei der Berechnung des Trendbalkens An / aus Schalter. Sehr nützlich, um den Indikator mit nur ei
ALL MOVING AVERAGES: Der ultimative benutzerdefinierte Indikator für vielfältige Strategien Der benutzerdefinierte Indikator ALL MOVING AVERAGES ist Ihr unverzichtbares Werkzeug für eine umfassende technische Analyse, mit einer beeindruckenden Sammlung von über 31 der beliebtesten gleitenden Durchschnitte . Dieser Indikator wurde sowohl für erfahrene Trader als auch für Anfänger entwickelt und bietet eine unvergleichliche Flexibilität, die es Ihnen ermöglicht, Ihre gleitenden Durchschnitte perfe
FREE

Ein genauer RSI-Indikator ist verfügbar.
Dashboard Trendleiste Smart Level 9TF Double RSI. Doppelter RSI, d.h. schneller RSI & langsamer RSI Warum brauchen Sie einen zweiten RSI? Die Verwendung zusätzlicher Indikatoren wird uns im Live-Handel mehr überzeugen 9TF Schnelle RSI-Kurve 9TF Langsame RSI-Kurve 9TF Echtzeit-RSI-Winkel 9TF Echtzeit-RSI-Wert 9TF Echtzeit RSI Richtung/Phase 9TF Trendleiste Neuer Algorithmus bei der Berechnung des Trendbalkens An / aus Schalter. Sehr nützlich, um den Indi

Ein genauer MACD-Indikator ist verfügbar.
Dashboard Trend Bar Smart Level 9TF Double MACD. Dual MACD, d.h. schnell (MACD 1) & langsam (MACD 2) Warum brauchen Sie einen zweiten MACD? Die Verwendung zusätzlicher Indikatoren wird uns im Live-Handel mehr überzeugen 9TF Fast MACD 1-Kurve 9TF Langsame MACD 2-Kurve 9TF MACD-Winkel in Echtzeit 9TF MACD-Wert in Echtzeit 9TF-Echtzeit-MACD-RichtungEin genauer MACD-Indikator ist verfügbar.
Dashboard Trend Bar Smart Level 9TF Double MACD. Dual MACD, d.h.

Ein genauer stochastischer Indikator ist verfügbar.
Dashboard Trend Bar Smart Level 9TF Dual Stochastic. Dual Stochastic, d. h. Fast Stochastic & Slow Stochastic Warum brauchen Sie die zweite Stochastik? Die Verwendung zusätzlicher Indikatoren wird uns im Live-Handel mehr überzeugen 9TF Fast Stochastic-Kurve 9TF Langsame stochastische Kurve 9TF Stochastischer Winkel in Echtzeit 9TF Echtzeit-Stochastikwert 9TF Echtzeit Stochastische Richtung/Phase 9TF Trendleiste Neuer Algorithmus bei der Berec

UR-Gamma (unterstützt durch ähnliche Berechnungen, die in maschinellen Lernsystemen zu finden sind)
UR Gamma ist ein hochmodernes Finanzanalysetool, das eine neue und verbesserte Interpretation des klassischen WaveTrend-Indikators bietet. Durch die Integration fortschrittlicher digitaler Signalverarbeitungstechniken adressiert UR Gamma einige der Einschränkungen traditioneller WaveTrend-Algorithmen und bietet einen genaueren, robusteren und dynamischeren Ansatz zur Identifizierung und Messung

Der R 2EMA Color Indikator für MT4 liefert solide Handelssignale basierend auf dem Crossover von 2 EMAs.
Wichtige Punkte Wenn der Preis die beiden grünen EMAs kreuzt und über ihnen schließt, erzeugt dies ein Kaufhandelssignal. Wenn der Preis die beiden roten EMAs kreuzt und über ihnen schließt, entsteht ein Verkaufssignal. Der R 2EMA Color Forex Indikator macht es noch einfacher festzustellen, wann es Zeit zum Kaufen und Verkaufen ist
Ein Kaufsignal tritt auf, wenn die 2 EMA-Linien grün werde
FREE

Der R Silver Trend Indikator ist ein trendfolgender Handelsindikator, der den aktuellen Trend direkt auf dem Aktivitätsdiagramm von Metatrader 4 anzeigt.
Es zeichnet zwei Arten von Kerzen: Blau steht für bullische Kursbewegungen. Rot für rückläufige Preisbewegung.
Der Handel mit dem R Silver Trend Indikator ist selbst für absolute Anfänger recht einfach und kann für Scalping (M1, M5), Daytrading (M5, M15, M30) und Swingtrading (H1, H4, D1) Währungen verwendet werden.
Grundlegende Handelssign
FREE

Der R Alligator Indikator wurde von Bill Williams eingeführt, er folgt dem Trend mit Hilfe von 3 geglätteten gleitenden Durchschnitten.
Standardmäßig werden die folgenden Werte verwendet: Der geglättete gleitende Durchschnitt über 13 Perioden (bekannt als Jaw) Der geglättete gleitende Durchschnitt über 8 Perioden (bekannt als die Zähne) Der geglättete gleitende Durchschnitt über 5 Perioden (bekannt als Lips)
Der R Alligator Indikator reduziert die Anzahl der falschen Trend Trades durch die Ve
FREE

Der R Var Moving Average Indicator ist ein Trendfolgeindikator, der für eingefleischte Trendfolger entwickelt wurde.
Es ist ein sehr beliebter Devisenhandelsindikator unter Aktienhändlern sowie Rohstoffhändlern, und seine Popularität ergibt sich aus seiner Fähigkeit, seinen Benutzern echte Signale zum Geldverdienen zu liefern.
Der Indikator besteht aus grünen und roten Punkten, die auf einer Sienna-Linie platziert sind. Der grüne Punkt zeigt auf ein bullisches Signal, während der rote Punkt e
FREE

Der R Wolfe Wave-Indikator analysiert die Preisbewegung und wandelt die gesammelten Daten in ein leistungsstarkes technisches Werkzeug für Wolfe Wave-Chartmuster um. Im Wesentlichen kann das R-Wolfe-Wellen-Chartmuster entweder zinsbullisch oder bärisch sein und Händlern helfen, Kauf- und Verkaufsgeschäfte ohne nachlaufende Indikatoren zu eröffnen.
Wichtige Punkte Identifiziert starke Wolfe Wave-Muster Für fortgeschrittene Trader Funktioniert für jedes Währungspaar Es lohnt sich, Ihre Indikator
FREE

Der R 3MA Cross-Indikator ist ein beliebter Trendindikator mit Warnungen, die auf dem Crossover von 3 gleitenden Durchschnitten basieren. Er besteht aus einem schnelleren, mittleren und langsameren gleitenden Durchschnitt.
Wichtige Punkte Ein Kaufalarm wird ausgelöst, wenn der schneller gleitende Durchschnitt sowohl den mittleren als auch den langsameren gleitenden Durchschnitt nach oben kreuzt.
Ein Verkaufsalarm wird ausgelöst, wenn der schneller gleitende Durchschnitt sowohl den mittleren a
Der Indikator R Stoploss Signals basiert auf einem Trend, der einem exponentiell gleitenden Durchschnitt folgt.
Dieser Forex-Indikator generiert Kauf- und Verkaufssignale in Form von blauen und roten Linien, die auf dem Aktivitätsdiagramm gezeichnet werden.
Blaue Linien zeigen an, dass der Trend nach oben geht, und dies ist ein Signal, das Währungspaar zu kaufen. Rot gefärbte Linien zeigen an, dass der Trend abwärts geht, und dies ist ein Signal, das Währungspaar zu verkaufen. Dieser Forex-In

Der R Wavy Dash Indikator verwandelt Preisdaten in einen hervorragenden Trendfolgesignalindikator, der für den Einstieg und Ausstieg aus dem Handel funktioniert. Es erscheint im Hauptdiagramm als farbige Signallinie und kann als eigenständiges Handelstool verwendet werden.
Der R Wavy Dash Indikator ist sehr zuverlässig, leicht und wird Ihre Handelsplattform nicht verlangsamen.
Wichtige Punkte Trendsignalanzeige Anfängerfreundlich Nicht neu lackieren Es lohnt sich, Ihre Indikatorsammlung zu er
FREE

Der R Inside Bar Indikator für Metatrader 4 bietet einfach zu verwendende Preisausbruchsniveaus basierend auf Inside Bars.
Es funktioniert mit reiner Preisaktion und wird überhaupt nicht neu gezeichnet und erscheint im Hauptfenster des MT4-Charts in Form von zwei farbigen horizontalen Linien über und unter der eigentlichen inneren Leiste.
Die grüne horizontale Linie fungiert als Widerstand und die rote Linie als Unterstützung.
Long- und Short-Trade-Idee Eröffnen Sie eine Kauforder, wenn der

Pivot Classic, Woodie, Camarilla, Fibonacci and Demark
Floor/Classic Pivot-Punkte oder einfach Pivots sind nützlich, um potenzielle Unterstützungs-/Widerstandsniveaus, Handelsspannen, Trendumkehrungen und die Marktstimmung zu identifizieren, indem sie die Höchst-, Tiefst- und Schlusswerte eines Vermögenswerts untersuchen. Die Floor/Classic Pivot Points können wie folgt berechnet werden. Pivot Point (P) = (High + Low + Close)/3 S1 = P * 2 - High S2 = P - (High - Low) S3 = Low – 2*(High - P) R1 =
FREE

Prometheus Trade Engine ist ein Indikator, der Preis-Aktion, Ratio-basierte Indikator mit benutzerdefinierten Indikatoren & andere Lagging-Indikatoren, um diese führende Indikator, der eine Multi-Timeframe-Ansatz für den Handel, so dass Sie in der Lage sind, um zu sehen, was andere Timeframes tun alle in einem Diagramm und geben Ihnen eine hohe Wahrscheinlichkeit Handel Setups, um Ihnen zu helfen, eine Vorhersage über das, was am wahrscheinlichsten ist, um in den Markt gehen vorwärts
Chart-Funk

Dieser Indikator verarbeitet nicht die Daten des Kurscharts und liefert keine Handelssignale. Stattdessen handelt es sich um eine Anwendung zur Berechnung und Anzeige der Frequenzantwort vieler herkömmlicher Indikatoren. Gleitende Durchschnitte wie der SMA, der LWMA und der EMA sowie Oszillatoren wie der MACD, der CCI und der Awsome Osc haben alle die Form von digitalen Filtern. Elektronikingenieure verwenden eine spezielle Methode zur Charakterisierung der Leistung dieser Filter, indem sie ihr
FREE
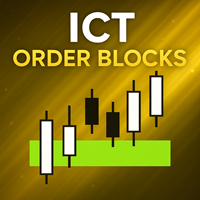
[ MT5 Version ] [ Kill Zones ] [ SMT Divergenzen ] Wie man mit Order Blocks handelt: Klicken Sie hier Erleben Sie die ultimative Handelspräzision mit dem Order Blocks ICT-Indikator, der Händlern unvergleichliche Einblicke in die Marktdynamik ermöglicht. Dieses fortschrittliche Tool nutzt die Orderflow- und Volumenanalyse, um den entscheidenden Kauf- und Verkaufsdruck aufzudecken, der das Kursgeschehen bestimmt. Warum sollten Sie sich für Order Blocks ICT entscheiden? Freisetzung von Markteinblic
Dieser Amazing Signal Entry Indikator ist für den Signalhandel konzipiert. Dieser Indikator erzeugt Trendsignale.
Er verwendet viele Algorithmen und Indikatoren, um diese Signale zu erzeugen. Er versucht, Signale von den Punkten mit dem höchsten Trendpotenzial zu erzeugen.
Dieser Indikator ist ein komplettes Handelsprodukt. Dieser Indikator benötigt keine zusätzlichen Indikatoren.
Der Indikator wird nie neu gezeichnet. Der Punkt, an dem das Signal gegeben wird, ändert sich nicht. Wenn das Si

SIE KÖNNEN JETZT KOSTENLOSE VERSIONEN UNSERER KOSTENPFLICHTIGEN INDIKATOREN HERUNTERLADEN. ES IST UNSERE ART DER RÜCKGABE AN DIE GEMEINSCHAFT! >>> HIER GEHT'S ZUM DOWNLOAD Das System ist ein kostenloses Open-Source-Kiefer-Skript, das ursprünglich auf TradingView von everget veröffentlicht wurde . Es wurde von Forex Robot Makers auf Mt4 konvertiert. Dieses System ist ein beliebter Trendindikator, der auf ATR (Average True Range), Moving Averages und dem Donchian Channel basiert.
System Hintergr
FREE

Dieser Indikator ist eines der nützlichen Werkzeuge für Händler, die mit Währungspaaren handeln und auf der Grundlage der Stärke der einzelnen Währungen eine korrekte Entscheidung oder Bestätigung der Positionen treffen können. Er wurde für alle vom Broker unterstützten Nebenwährungspaare berechnet und zeigt die Werte der Hauptwährungen an. Diese Währungen werden je nach Konfiguration des Händlers bei der Ausführung des Indikators horizontal oder vertikal angezeigt. Eine der möglichen Handelsst
FREE

MP Relative Bandwidth Filter (RBF) wurde entwickelt, um Ihre Handelszonen auf Basis der Volatilität zu identifizieren. Dieser einfach zu bedienende technische Indikator versucht, zwischen der Bandbreite höherer Länge und der ATR niedrigerer Länge zu vergleichen, um die Bereiche niedriger und hoher Volatilität zu identifizieren: Relative Bandbreite = Bandbreite / ATR Die Bandbreite basiert auf dem Bollinger Band, dessen Länge idealerweise höher sein sollte, während die ATR-Länge idealerweise nie
FREE

MT5 Version Kill Zones
Kill Zones ermöglicht es Ihnen, bis zu 3 Zeitzonen in den Chart einzufügen. Die visuelle Darstellung der Kill Zones im Chart zusammen mit einem Alarm- und Benachrichtigungssystem hilft Ihnen, falsche Handels-Setups zu ignorieren, die außerhalb der Kill Zones oder bestimmter Handelssitzungen auftreten. Die Verwendung von Kill Zones bei Ihrem Handel hilft Ihnen, Handels-Setups mit höherer Wahrscheinlichkeit herauszufiltern. Sie sollten Zeitbereiche auswählen, in denen der Ma
IconTradeSL: Möglichkeit, sl nach Stufen einzustellen. Der Indikator hat die Möglichkeit, die Historie der Levels auf dem Chart anzuzeigen. Möglichkeit, sl nach Levels zu setzen. Einstellungen des Indikators: COLOR_BAR - Farbe der Balken, für die wir nach SL suchen
COLOR_TEXT_BAR - Lila;//Farbe des aktuellen Balkens
BAR - Suche in den letzten BAR-Balken (200 standardmäßig)
show_bar - Balken anzeigen, für die wir nach SL suchen

Die Angebots- und Nachfragezonen sind das Herzstück des Handels mit Angebot und Nachfrage . Diese Zonen sind Bereiche, die Liquidität zu einem bestimmten Preis anzeigen. Die Angebotszone wird auch als Distributionszone bezeichnet, während die Nachfragezone als Akkumulationszone bezeichnet wird. Unser Indikator zeichnet automatisch Angebots- und Nachfragezonen in Metatrader 5. Er bietet die Möglichkeit, Handelszonen zu verstehen und Risiken zu vermeiden.

Erschließen Sie die Kraft des Marktes mit dem Investment Castle Multi Time Frame Moving Average Indicator. Vereinfachen Sie Ihre Handelsreise, indem Sie Trends und Pullbacks über mehrere Zeitrahmen auf einem praktischen Chart erkennen. Dieser Indikator ist ein unverzichtbares Werkzeug für jeden ernsthaften Trader. Erhältlich für MT4 und MT5 und exklusiv auf dem MQL5-Markt, passen Sie Ihre Erfahrung an, indem Sie so viele Indikatoren auf dem Chart hinzufügen, wie Sie benötigen, jeder mit seinem e

Dieser Indikator ist ein zu, der : Er berechnet die Positionsgröße auf der Grundlage des Kontostandes/Eigenkapitals, des Währungspaares, des Einstiegsniveaus, des Stop-Loss-Niveaus und der Risikotoleranz (entweder in Prozentpunkten oder in der Basiswährung festgelegt). Es zeigt das Verhältnis von Gewinn und Risiko auf der Grundlage des Take-Profits an. Zeigt das gesamte Portfoliorisiko auf der Grundlage offener Geschäfte und schwebender Aufträge an. Berechnet die für eine neue Position erforderl

Ein Top- und Bottom-Indikator, der intuitiv den Trend des Bandes erkennen kann. Er ist die beste Wahl für den manuellen Handel, ohne Redrawing oder Drifting. Wie Sie diesen Indikator kostenlos erhalten: Mehr erfahren Preiserhöhung von $20 alle 3 Tage, Preiserhöhungsprozess: 79--> 99--> 119...... Bis zu einem Zielpreis von $1000. Für alle Anfänger und Programmierung Trading-Freund, können Sie das Signal in den EA zu spielen frei zu schreiben. Array 3 und Array 4, zum Beispiel, 3>4 wird grün, 3<4
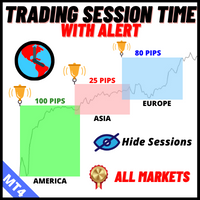
Der Trading-Sessions-Zeitindikator:
Der "Trading-Sessions-Zeitindikator" ist ein leistungsstarkes technisches Analysetool, das entwickelt wurde, um Ihr Verständnis der verschiedenen Handelssitzungen auf dem Devisenmarkt zu verbessern. Dieser nahtlos integrierte Indikator liefert wichtige Informationen über die Öffnungs- und Schließzeiten der Haupt-Handelssitzungen, einschließlich Tokio, London und New York. Mit automatischer Zeitzonenanpassung richtet er sich weltweit an Trader und hilft ihnen
FREE
MetaTrader Market bietet jedem Entwickler eine einfache und bequeme Plattform für den Verkauf von Programmen.
Wir unterstützen Sie bei der Veröffentlichung des Produkts und beraten Sie gerne, wie man eine Beschreibung für den Market vorbereitet. Alle Produkte, die im Market verkauft werden, sind durch eine zusätzliche Verschlüsselung geschützt und können nur auf dem Rechner des Kunden gestartet werden. Illegales Kopieren ist ausgeschlossen.
Sie verpassen Handelsmöglichkeiten:
- Freie Handelsapplikationen
- Über 8.000 Signale zum Kopieren
- Wirtschaftsnachrichten für die Lage an den Finanzmärkte
Registrierung
Einloggen
Wenn Sie kein Benutzerkonto haben, registrieren Sie sich
Erlauben Sie die Verwendung von Cookies, um sich auf der Website MQL5.com anzumelden.
Bitte aktivieren Sie die notwendige Einstellung in Ihrem Browser, da Sie sich sonst nicht einloggen können.