The Netsrac Correlation Trade Indicator (NCTI) was created to trade correlations between different assets. NCTI offers five different strategies to do this. Below you will find a detailed description of the functions and strategies of the indicator. I wish you success!
In this post, I would like to briefly talk about the visuals and variables of the indicator. If you have further questions, please contact me.
You find the free version of the indicator for MT4 here (https://www.mql5.com/de/market/product/39436) and the full featured version for MT4 here (https://www.mql5.com/de/market/product/39435).
You find the free version of the indicator for MT5 here (https://www.mql5.com/de/market/product/48468) and the full featured version for MT5 here (https://www.mql5.com/de/market/product/48472).
Visuals
| Element | Description |
|---|---|
 | This is the complete view, if you have activated "show profits" and "show strategy". Below you will find a description of the single elements. |
| | This element shows the name of the configured assets (NZDUSD in this case) and a suggested trade direction in front of the name (neutral in this case). This is a button. You can use it to open the chart of this asset (in new window or in the current window). |
| | This label shows the strategy, if the configured values for the used strategy are met. In this case you see a valid setup for "ThreeLeg Strategy" and the values for correlation between asset one and two (-80.4) and the correlation between asset one and three (0.5). |
| | In this case the calculated correlation values are not met the criteria for the used strategy. |
 | These labels shows the profit/lost of currently opened trades within the configured assets. In this case there are no trades open. |
 | In this case the labels are showing a lost for the first asset, a profit for the second asset and a profit for the total sum. |
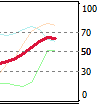 | You see four lines in this picture (it is the ThreeLeg Strategy, which is build from three assets). Every asset is represented by one line. The most important line is the red, thick line. This is the signal line, which shows you a valid setup and a valid exit. |
 | In this picture you see the signal line with a valid signal and activated "show arrows" function. You can use the arrows e.g. for visual backtesting. |
Variables (Symbols)
| Variable | Description |
|---|---|
| 1st symbol | This is the first symbol for the choosen trading strategy |
| 2nd symbol | This is the second symbol for the choosen trading strategy |
| 3rd symbol (only applicable with ThreeLeg strategy) | This is the third symbol for the choosen trading strategy (ThreeLeg) |
Variables (Correlation)
| Variable | Description |
|---|---|
| Choose actual correlation time frame | Timeframe for calculating the Correlation. Default is Daily. |
| Periods for calculation of correlation | Count of periods for calculating the correlation. Default is 100. |
| Minimum correlation setup value 1 in percent | The indicator calculates correlation values based on the choosen strategy and the assets. If this minimum value for correlation will not reached by this calculation - the indicator will show up a "no valid" setup. This is to prevent bad combinations of assets. Default is 80. |
| Maximum correlation setup value 2 in percent | This value is taken into account only in the ThreeLeg strategy (see strategies below). You need a uncorrelated pair for this strategy. Use this variable to set a maximum correlation. Default is 15. |
Variables (Signal)
| Variable | Description |
|---|---|
| Strategy | Choose one of the possible correlation trading strategies (see section "Trading strategies" below) |
| Periods for signal calculation | Periods for calculating the signal value. Default is 5. |
| Upper entry line | If the signal line is rising above this value, the indicator will trigger an alert based on your strategy. Default is 70. |
| Upper exit line | This is only a visual element to have a good exit point for your trades. No alert will be triggered at this point. Default is 50. |
| Bottom entry line | If the signal line is falling below this value, the indicator will trigger an alert based on your strategy. Default is 30. |
| Bottom exit line | This is only a visual element to have a good exit point for your trades. No alert will be triggered at this point. Default is 50. |
Variables (Alerts)
| Variable | Description |
|---|---|
| Screen alert | Send an alert to the screen, when configured thresholds are broken. Default is true. |
| Notification to mobile | Send an alert to the mobile MT4/MT5, when configured thresholds are broken (needs configuration in mobile MT4/MT5). Default is false. |
Variables (Colors/Fonts/Appearance)
| Variable | Description |
|---|---|
| different colors and font/fontsize | I think these are self explained variables (you can configure the appearance of the indicator. It is optimized for white background in default. |
| Show profits | If you set "true", the indicator will show you overall profits for trades with this asset and a defined magic number (0 for manual trades) - see variable below |
| Magicnumber (0 for manual) | If you show profits - the indicator watches trades with this magic number for displaying. If you are using an expert advisor to open trades - use the magic number of this EA. Default is 0. |
| Show setup | The indicator will compare your used setup with the configured thresholds for the correlations and gives you a confirmation, if the current correlation values match the setup. Default is true. |
| Show arrows | See section visuals. You can turn on or off the arrows with this variable. Default is false. |
Variables (Chart)
| Variable | Description |
|---|---|
| Chart template (if open new chart) | See section "visuals". When you click on a configured asset button on the left, you can open a new chart with this template name (set variable below to true) or you can open the asset in the chart of the indicator (set below variable to false) |
| Open new chart | See variable above. Opens a new chart with the configured template, when click on an asset button or opens the asset in the currently used chart. Default is false. |
Trading Strategies
The basic function of the indicator is the same with all four strategies. You set a threshold value at the top and a threshold value at the bottom. If this threshold is exceeded, the indicator shows the recommended trading direction for each asset and gives an alert (if alerts are activated). You find some set files for this strategies in the attachements.
HedgedCorrelation positive
You need two positive correlated pairs for this strategy. If they are moving similar, you don´t trade. If they are differ, you trade until the usual behaviour is back in place.
| Setup | Description | this is shown by the indicator |
|---|---|---|
| No setup | The two assets are moving nearly similar (signal around 50) | 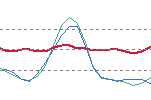 |
| Setup | One asset is in the overbought, the other is in the oversold area. Buy the asset, which is oversold (blue in the picture), sell the asset, which is overbought (green in the picture). The signal is above 70 and begins to fall or below 30 and begins to rise) | 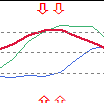 |
| Exit | Close all trades, if the signal line is touching the 50 |
HedgedCorrelation negative
You need two negative correlated pairs for this strategy. If they are moving reverse, you don´t trade. If they are moving nearly similar, you trade until the usual behaviour is back in place.
| Setup | Description | this is shown by the indicator |
|---|---|---|
| No setup | The two assets are moving nearly reversed (signal around 50) | 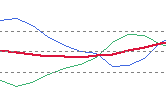 |
| Setup | Both assets are in the overbought or in the oversold area. Buy both assets, if they are oversold, sell both assets, if they are overbought (as in the picture). The signal is above 70 and begins to fall or below 30 and begins to rise) | 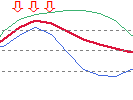 |
| Exit | Close all trades, if the signal line is touching the 50 |
TwoLeg positive
You need two positive correlated pairs for this strategy. If they are moving similar, and the signal is around 50 - you don't trade. If the signal is below 20 and begins to rise or above 80 and , you trade until the signal is around 50.
| Setup | Description | this is shown by the indicator |
|---|---|---|
| No setup | The two assets are moving nearly similar and they are not overbought/oversold (signal around 50) |  |
| Setup | Both assets are in the overbought or in the oversold area. Buy both assets, if they are oversold, sell both assets, if they are overbought (as in the picture). The signal is above 80 and begins to fall or below 20 and begins to rise) |  |
| Exit | Close all trades, if the signal line is touching the 50 |
TwoLeg negative
You need two negative correlated pairs for this strategy. If they are moving reverse and the signal is in the 50 area, you don´t trade. If the signal line is in the overbought and oversold area, you trade both assets. Buy the oversold, sell the overbought.
| Setup | Description | this is shown by the indicator |
|---|---|---|
| No setup | The two assets are moving nearly reversed (signal is around 50) |  |
| Setup | One asset is in the overbought, the other in the oversold area. Buy the asset, which is oversold (green in the picture), sell the asset, which is overbought (blue in the picture). The signal is above 80 and begins to fall or below 20 and begins to rise) |  |
| Exit | Close all trades, if the signal line is touching the 50 |
ThreeLeg
This strategy is also known as Triangular arbitrage - but that is not the real strategy behind. You need two negative correlated pairs and a third no correlated pair for this strategy. If the the signal is in the 50 area, you don´t trade. If the signal line is in the overbought and oversold area, you trade all assets. Buy all assets, when signal line is in the oversold area, sell all assets, when the signal line is in the overbought area.
| Setup | Description | this is shown by the indicator |
|---|---|---|
| No setup | The signal line is around 50 | 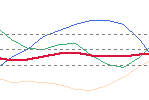 |
| Setup | All assets are in the overbought or in the oversold area. Buy all assets, if they are oversold, sell all assets, if they are overbought (as in the picture). The signal is above 70 and begins to fall or below 30 and begins to rise) | 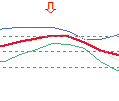 |
| Exit | Close all trades, if the signal line is touching the 50 |
How to find suitable pairs?
You can do that easily with my Correlation Dashboard or with some Internet correlation tools (eg myFXbook). In the following picture you see my Correlation Dashboard and the found pairs for ThreeLeg strategy as an example.

Thanks for reading. I wish you much success!

