Just Trend
- 指标
-
Ivan Simonika
 List of the best products: https://www.mql5.com/ru/users/dragonivan/seller
e-mail: dragon.ivan.sym@gmail.com - 版本: 1.0
- 激活: 5
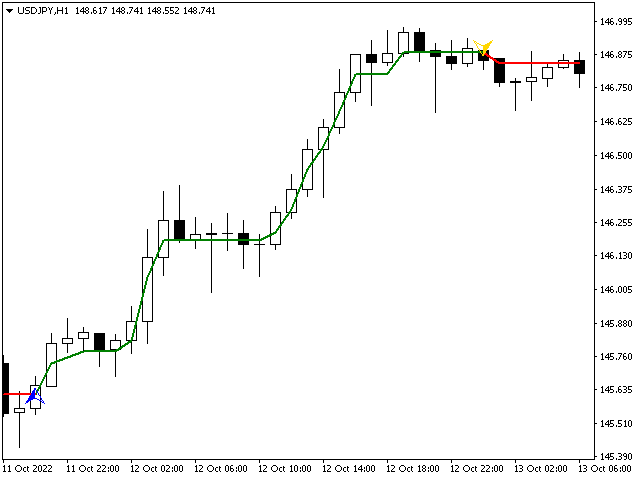
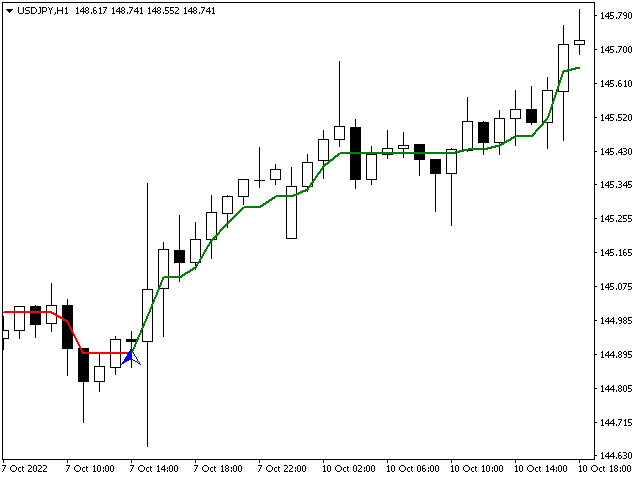
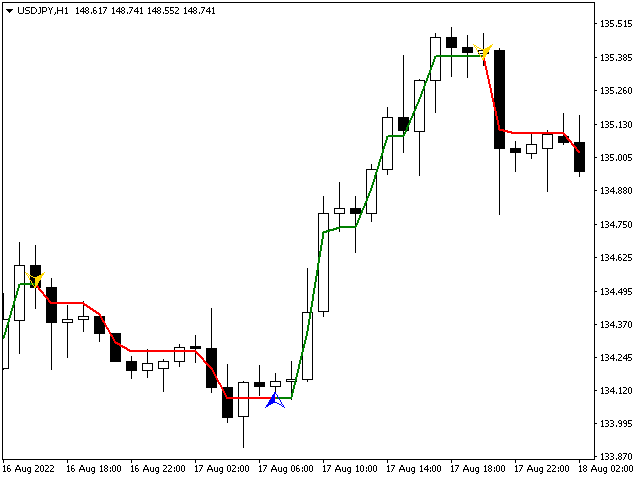
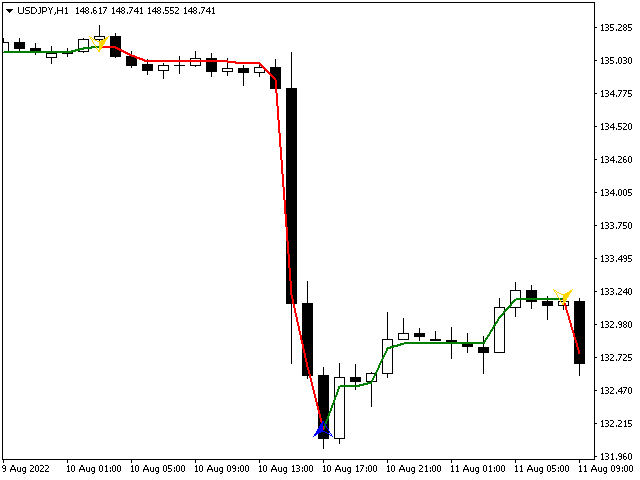
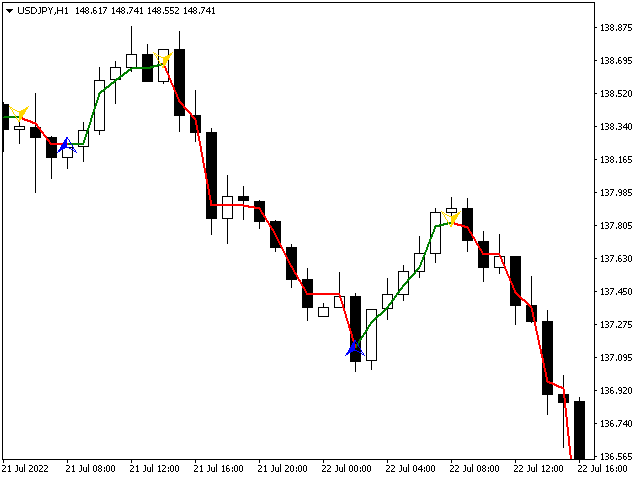
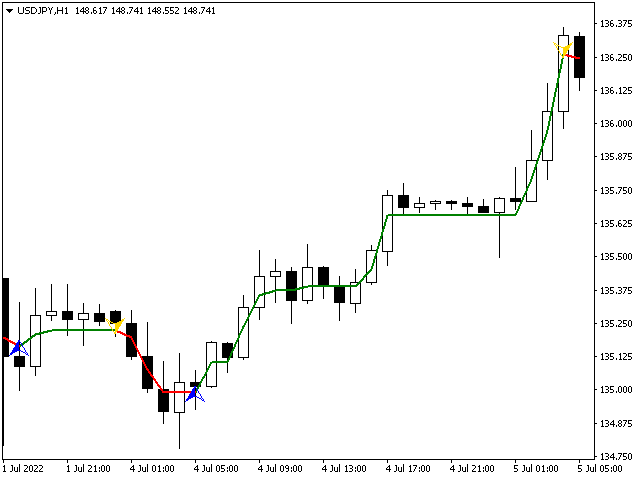
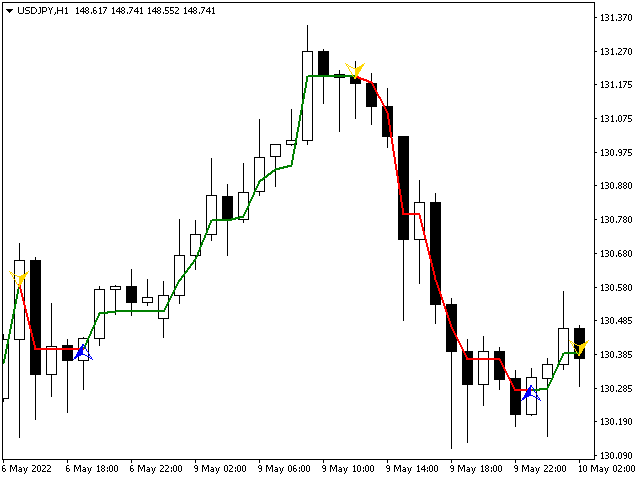
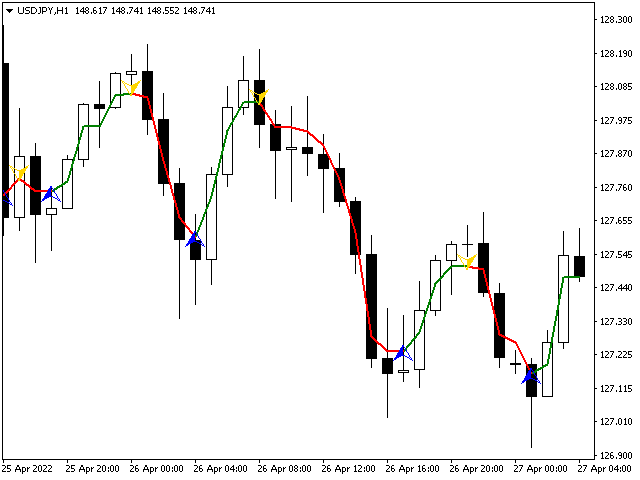
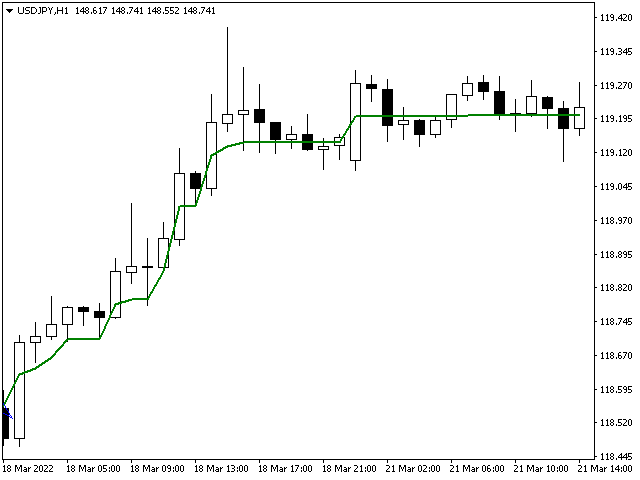
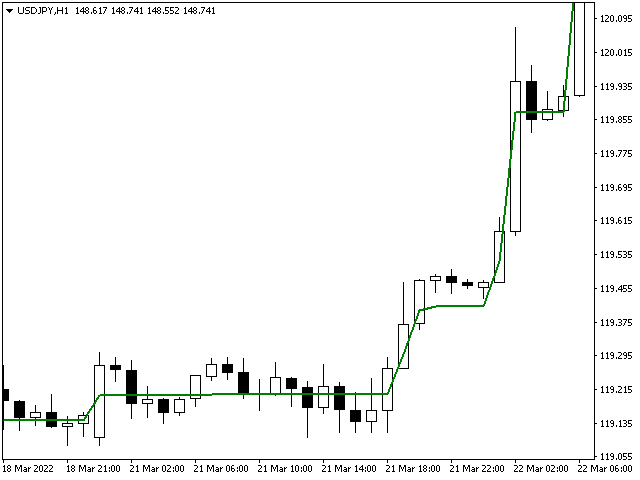
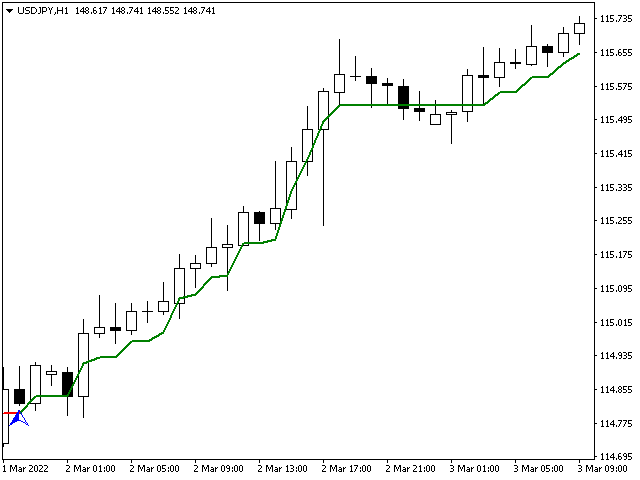
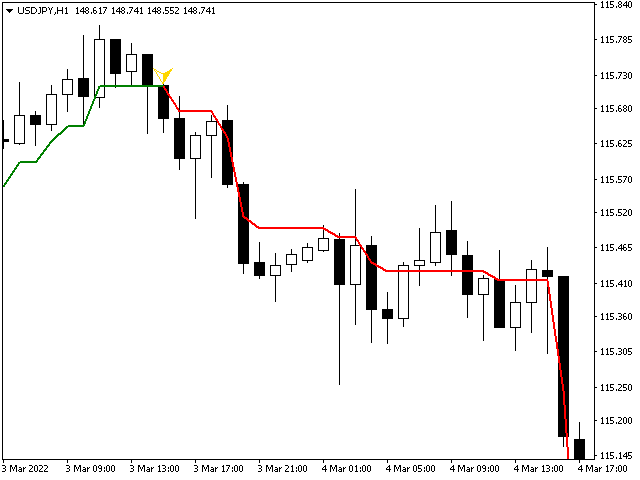
Introducing the trend indicator! Ready trading system. The principle of the indicator is to automatically determine the current state of the market when placed on a chart. The indicator analyzes market dynamics for pivot points. Shows the favorable moments of entering the market with stripes. Can be used as a channel indicator or level indicator! This indicator allows you to analyze historical data, and on their basis display instructions to the trader on further actions. To find out how to determine the correct pivots for constant likely profitable trading, buy this indicator.
It's just junk. Like the super trend of free, functions have no purchase value! The signal lags behind the market trend, which means that success or failure depends on luck!