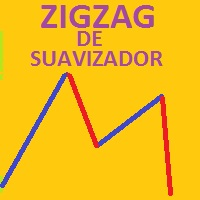
ZigZag de Suavizador

Teniendo una entrada de precios suavizados, los cuales son procesador por un ZigZag en tiempo real, dando como resultado un suavizador ajustado a un ZigZag.

Con valores de entrada (periodo) mayores se vuelve un poco lenta en M1,,

Ideal para H1, H4, D1

Trabaja bien con otros suavizadores, ya que su intersección es ideal

Al iniciar empiza con mayor precisión desde el momento de activación, siendo el historial (anterior) de referencia

--------------------------------------------------------------------------------------------------------------------------------------------------------

推荐产品
Free automatic Fibonacci is an indicator that automatically plots a Fibonacci retracement based on the number of bars you select on the BarsToScan setting in the indicator. The Fibonacci is automatically updated in real time as new highest and lowest values appears amongst the selected bars. You can select which level values to be displayed in the indicator settings. You can also select the color of the levels thus enabling the trader to be able to attach the indicator several times with differe
FREE
ZigZag Triple Super
Cesar Juan Flores Navarro
Este Asesor Experto es un sistema de trading automatizado para MetaTrader 5 basado en estructura de mercado multi-escala mediante pivotes fractales tipo ZigZag, combinado con gestión dinámica de lotaje progresivo y cierre inteligente por retroceso de beneficio (basket retrace). El EA está diseñado para detectar cambios estructurales del mercado utilizando tres niveles de análisis simultáneo (Big, Mid y Small) y abrir operaciones alternadas de compra y venta con control de riesgo mediante gesti
John Bollinger's normalized MFI (Fund Flow Index). Bollinger bands are used to calculate overbought/oversold areas. It takes three input parameters: MFI period - MFI calculation period MFI Applied Volume - Calculates the volume of MFI transactions BB period - Calculation period of the Bollinger band BB deviation - Brin deviation Calculation: NormMFI = (MFI-BL) / (TL-BL) Among them: TL = BBands(MFI, BB period, BB deviation, UPPER_BAND) BL = BBands(MFI, BB period, BB deviation, LOWER_BAND) MFI - M
Easy GOLD MT5
Franck Martin
3.87 (45)
Easy Gold is the latest addition to the BotGPT family. It is surprising and very powerful. It is ideal for beginners due to its simplicity.  There is absolutely nothing to do, it's 100% automated, simply indicate the percentage of risk you want to take per trade and the EA is ready. Whatever your capital, the EA takes care of everything. Optimized on (XAUUSD).  Unleash all the power with the professional version (AGI Gold) and its connection to the neural network, available in my store. My othe
FREE
Boom500 Pro JAZ
Komi Justin N'mena
Boom500 Pro JAZ is a trend-following Expert Advisor designed exclusively for the Boom 500 Index on MetaTrader 5. It uses a proprietary combination of six technical indicators to identify trend entries with precision. The system filters out false signals through a cross-confirmation mechanism: a trade only opens when all modules are aligned in the same direction. Key features Works exclusively on Boom 500 Index (Deriv), M15 timeframe Proprietary multi-indicator trend-following strategy Dynamic AT
Seasonal Pattern Trader
Dominik Patrick Doser
Disclaimer : Keep in mind that seasonal patterns are not always reliable. Therefore, thoughtful risk management is crucial to minimize losses.  Seasonal patterns in the financial world are like a well-guarded secret that successful investors use to their advantage. These patterns are recurring price movements that occur during specific periods or around special events. Additionally, there are also intraday patterns that repeat. For example, Uncle Ted from Forex Family suggests examining previou
NEXA Breakout Velocity NEXA Breakout Velocity 是一款基于价格通道突破、动量速度(ROC)、成交量过滤以及 ATR 风险控制的自动交易系统。 该系统旨在识别波动率扩张阶段,即价格突破区间并伴随动量和成交量增加的市场环境。 所有信号均基于已收盘K线计算。 同一交易品种仅持有一个仓位。 策略概述 系统结合以下核心组件: 价格通道突破识别 ROC 动量过滤 成交量扩张过滤 可选低周期确认 基于 ATR 的止损计算 固定风险收益比目标 基于账户风险比例的自动仓位计算 动态风险控制机制 本策略不仅依赖突破本身,同时要求动量与成交量配合确认。 工作原理 根据最近的高点和低点计算价格通道。 检查上一根已收盘K线是否突破通道。 将当前 ROC 数值与历史平均值进行比较。 将当前成交量与平均成交量进行比较。 如启用,则在低周期进行确认。 根据 ATR 计算止损距离。 根据风险收益比计算止盈目标。 根据账户风险比例自动计算交易手数。 所有计算均基于已收盘K线。 推荐默认设置 图表周期:M15 启用自动交易 启动前确保历史数据充足 系统可用于其他周期,但结构主要面
FREE
Best swing
Winsou Cedric Anicet Kpanou
-- BEST SWING  -- L'indicateur BEST SWING est un indicateur technique personnalisé, un excellent outil pour négocier les cassures en fonction des niveaux de support et de résistance horizontaux. L'indicateur BEST SWING utilise une formule complexe en analysant des données de prix autrement incongrues sur les cours de clôture de chaque période, ainsi que les hauts et les bas du prix, afin de donner un aperçu de la force ou de la faiblesse de la tendance du marché et de sa probabilité
ORB Framework
Laurentiu-marian Ghinda
ORB Framework - 开盘区间突破,先测试,再交易 ORB Framework 将开盘区间突破(Opening Range Breakout)策略自动化:它测量交易时段前几分钟的最高价和最低价,然后交易该区间的突破。方法的每个部分都是输入参数,因此您可以重建经典的 ORB 变体,在策略测试器中检验自己的想法,并在实盘中运行完全相同的逻辑。 这是一个框架,而不是黑箱。它不承诺盈利,也没有替您做优化。它为您提供工具,让您诚实地判断开盘区间突破在您的市场和您的经纪商那里是否有效。 始终正确的交易时段 - 可按纽约、伦敦、服务器时间或自定义 UTC 偏移设置交易时段,EA 会自动换算为经纪商的服务器时间。 - 内置美国和欧洲夏令时规则,包括两者切换日期不一致的那几周。 - NYSE / Nasdaq 和 Xetra 交易所假日日历:假日自动跳过,提前收盘(纽约 13:00)时强制平仓时间相应提前。 - 无需日历文件,无需联网:规则已内置,因此策略测试器与实盘图表的行为完全一致。 入场方式 - 在区间边界挂止损单(一单成交即撤销另一单)。 - 在您选择的周期上,K 线
ROMAN5 时间突破指标自动绘制日线的支撑和阻力突破箱体。它可帮助用户识别何处进行买入、卖出。当新信号出现时,它可发出提示和声音。它还具有发送邮件功能。您的邮件地址和 SMTP 服务器设置应该在 MetaTrader 5 的 "邮箱" 标栏里的设置窗口里指定。 蓝色向上箭头 = 买。 红色向下箭头 = 卖。 您可以使用一款我的移动止损产品,来自动移动止损,并包括设置盈亏平衡。 ROMAN5 分型移动止损   ROMAN5 抛物线SAR 移动止损 ROMAN5 布林带移动止损 ROMAN5 HeikenAshi 移动止损 ROMAN5 均线移动止损 ROMAN5 高级移动止损 如果您希望尝试 EA, 参见 ROMAN5 时间突破 EA 。 版本 1.2: 发送推送通知至移动终端。
FREE
FiboZone OTE Map
Katsuhei Yamamaru
See where the pullback should end before it happens. FiboZone OTE Map finds impulse legs that broke market structure and draws their optimal trade entry (OTE) zone, the 0.705 to 0.95 retracement of the move, on up to three timeframes at once. It tells you when price reaches a zone and when a lower timeframe confirms the turn inside it. What it shows OTE zones: for every impulse that breaks structure by at least 1.5 ATR, the 0.705 to 0.95 retracement zone is drawn from the impulse extreme to the
FREE
Yoyo Products OldSchool EA v1.0.1 === OVERVIEW === A professional triple-DEMA crossover expert advisor for MetaTrader 5, combining trend confirmation (ADX), momentum filtering (RSI), volatility-based stops (ATR), partial take-profit management, and a smart trailing stop. Designed for scalping the 1-minute timeframe with disciplined risk control. "Trading doesn't make you rich in a day, but it is the road to becoming rich." === RECOMMENDED SETUP === - Symbol            : XAUUSD (Gold) or EURU
鬼变脸指标是一种结合了宝塔线(TOWER)与平均K线(Heikin-Ashi)过滤思想的趋势跟踪型技术指标。它通过对比价格对前期关键高低点的突破情况动态改变柱体颜色(即“变脸”),有效过滤盘中无序噪音,帮助交易者把握主升浪与主降浪。 核心逻辑与机制 动态变色:不以单根K线的收盘价与开盘价关系决定颜色,而是对比近N根K线(常见为3根)的极值。收盘价突破前高边界时由绿(或蓝)变红,跌破前低边界时由红变绿。 趋势锁定:只要价格未打破关键支撑或阻力,柱体便保持原色,避免交易者因盘中微幅回调被误导提前离场。 四大核心形态与买卖信号 形态类型图表特征交易含义绿/黑翻红连续绿柱后首次出现红柱,收盘突破前高买入/做多:多头趋势确认启动红翻绿/黑连续红柱后首次出现绿柱,收盘跌破前低卖出/做空/平仓:空头趋势确认确立三平底翻红连续三根柱体底部平齐且未破新低后转红强买入信号:底部坚实,反转成功率极高三平顶翻绿连续三根柱体顶部平齐且未创新高后转绿强卖出信号:顶部滞涨,见顶回落概率极大 实战使用技巧 顺势过滤(结合均线):引入一条中长期均线(如 20MA 或 60MA)。价格位于均线上方时,仅执行
Titan Inteligente REX
Cesar Juan Flores Navarro
TITAN INTELIGENTE REX es un asesor experto automatico al 100%, con puntos de entrada especiales que brindan una ventaja estadística, revelada a través del modelado matemático de patrones de mercado. El asesor no utiliza stop-loss, todas las operaciones se cierran después que encuentren un beneficio.   Existe la oportunidad de planificar aumentos de lotes. Configuraciones avanzadas para profesionales y un sistema que mejor funciona en GBPUSD (recomendado) y similares con Formato 0.12345 (5 dígi
Reversal Composite Candles
MetaQuotes Ltd.
3.69 (16)
该系统的思路是通过计算复合蜡烛来识别反转形态。 反转形态类似日本蜡烛条分析的 "锤头" 和 "吊颈" 形态。但它使用符合蜡烛替代单一的蜡烛,并且不需要复合蜡烛的小实体来确认反转。 输入参数: Range - 最大柱线数量, 计算复合蜡烛时用。 Minimum - 最小复合蜡烛大小 (传统的点数)。 ShadowBig and ShadowSmall - 影线 (复合蜡烛单元)。 Limit, StopLoss and TakeProfit - 开盘价, 止损位和止盈位, 它们是相对于复合蜡烛的收盘价 (复合蜡烛单元)。 Expiration - 订单过期时间 (单位柱线), 用于挂单 (Limit!=0.0)。 反向蜡烛条形态的判别如下。 它计算复合蜡烛参数,其自最后的完整柱线 (索引为 1) 至由 Range 输入参数定义的柱线数量。如果复合蜡烛大小大于由 Minimum 输入参数指定的数值, 它分析复合蜡烛的影线检测反转条件。 空头能量的特征是复合蜡烛的上影线为零, 多头能量的特征是复合蜡烛的下影线为零。 为确认空头趋势反转 (且多头开始),需要以下检查: 下影线的大小 (多头能量
FREE
Btc Xqc
Chahine Merini
BTC HYPER 一款专 为 BTC/USD 打造的系统化突破引擎,基于多周期区间扩张与严格的固定风险执行逻辑。 利用挂单逻辑进入关 键突破区域——不追单、不带情绪、不手动入场 每笔交易都拥有固定、经过数学计算的风险与回 报比——无需猜测,无随意仓位 智能移动止损 逻辑在交易朝有利方向发展时锁定利润 自适应 仓位管理在盈利时增加仓位,在回撤时自动降低仓 位——内置资金保护机制 适用于 BTC/USD 所有时间周期,专为 M15 调优并验证 推荐设置 强烈建议使 用 VPS 最低资金:200 美元 选择点差 最低的账户类型以获得最佳表现 ️ 重要提示:购买/订阅前请先在 MQL5 上给我发消息。 此版本不包含我 Turbo 版本中的部分功能。 请先联系我,以便我告知哪 个版本更适合您的账户和目标。 ️ 购买/订阅前请阅读 此处列出的版本并未包含 我最新 Turbo 版本中的所有功能。我希望我的关注者能获得最适合自己配置的版本,因此在购买或订阅前,请先在 MQL5 上给我发私信。 联系我以便: 了解此版本与 Turbo 版本的区别 确认适合您经纪商、账户规模和交易品种的设置
Wall Street Smart Pro
Juan Andres Ruiz
5 (1)
WALL STREET SMART PRO 机构级算法交易。20个市场。一个系统。 作为一套具备机构级逻辑与水平的多市场系统,WALL STREET SMART PRO 在精准度、纪律性以及真实市场实时表现方面树立了全新标准,并且是唯一一套以相同逻辑同时运行20个市场的算法交易系统。  零售交易领域没有任何同类产品。 WSSP 面向那些不满足于普通 Expert Advisor 的交易者而开发,代表了量化交易技术的更高层次演进。 其架构允许通过单一 Expert Advisor 实例同时分析外汇和加密货币,无需在每张图表上分别加载不同的 EA。 官方实时交易信号 您可以公开跟踪其表现,并核实在真实市场环境和真实账户中执行的交易。 这 使用户能够独立监督其实时活动、交易、回撤以及账户净值变化。 限量版 全球严格限量1,000个终身许可证。 一旦1,000份全部售罄,WALL STREET SMART PRO 将不再提供。 -----------------------------------------------------------------------------
London Structure Trader
Alex Amuyunzu Raymond
London Structure Trader – MT5 Expert Advisor London Structure Trader is a structured, session-based MT5 Expert Advisor designed to trade EURUSD during the London session using VWAP directional bias, market structure breaks, and order block execution with controlled risk. The EA prioritizes precision and capital protection. Trades are taken only after confirmed structure alignment and are protected by predefined stop loss, take profit, and multiple safety filters. Overtrading, grid systems, and
Round levels for XAUUSD
Antonio Chrispus Mpanga Ntege
RoundLevels is an XAUUSD indicator designed to display psychological round-number price levels on the chart. These levels can be used as reference points when analyzing price movement, support and resistance, breakouts, retests, and reactions around commonly observed price intervals. The indicator automatically presents selected round levels on the chart, reducing the need to mark these levels manually. Traders can use the displayed levels together with their existing market structure, volatili
Easytrading Panel Basic by Vexo
Joseph Brian Ong Gustilo
EasyTrading Panel Basic by Vexo EasyTrading Panel Basic is a free manual trade execution panel for MetaTrader 5. It provides a streamlined workflow for placing market orders with automatic risk-based lot sizing, stop loss, and take profit calculation. The panel works on any symbol and any timeframe. How It Works The panel displays on-chart with your account balance, current lot size, risk percentage, reward-to-risk ratio, and calculated stop loss. All values update in real time as you adjust par
FREE
GP Confluence Scanner MT5 Advanced Multi-Timeframe Market Structure & Confluence Analysis Don't get stopped out easily again! GP Confluence Scanner MT5 is an advanced technical analysis indicator designed to reveal important market levels, hidden support and resistance, and multiple technical confluences before entering a setup. Rather than relying on a single indicator, GP Confluence Scanner examines multiple technical factors to identify areas where significant market reactions may occur. Key
The EA monitors four core moving averages ( 13, 21, 55, 144 ) across multiple timeframes (M1 up to Daily) . It checks whether the averages are stacked in sequential alignment and weights higher timeframes more heavily to ensure execution aligns with the dominant market tide.  Powered by a pure mathematical multi-timeframe (MTF) scoring engine, it quantifies continuous market momentum across up to seven timeframes simultaneously to identify high-probability institutional trends . Multi-Timeframe
Core Features and Filters TDI (Traders Dynamic Index)  The EA computes the TDI using selectable candle types: Japanese, Heikin Ashi, or both. It calculates the TDI’s green (price MA), red (signal MA), and yellow (baseline) lines, along with Bollinger Bands using a custom standard deviation value. Multiple Filters for Trade Signals Baseline Filter : Trades are filtered based on the TDI baseline value. Ichimoku Cloud (Kumo) Filter : Optionally restricts trades to those above/below the cloud. Tren
Apex Point
Marco Engstermann
Apex Point is a trend-following indicator for MetaTrader 5, transforming complex market data into signals for traders. It displays blue dots for uptrends, red dots for downtrends, and yellow crosses at potential reversals, helping users identify momentum shifts quickly. Key features include a confirmation system requiring multiple bars (default: 3) to validate changes, reducing false signals; dynamic ATR-based offsets for adaptive trailing, with instant ratcheting in the trend direction and smo
FREE
Bollinger Bands B
Flavio Javier Jarabeck
4.5 (6)
John Bollinger created this indicator in 2010 as a way to read the original indicator (Bollinger Bands) in a more "technical" way, shown as an oscillator. The typical range of the Bollinger Bands %B is 0 - 0.5 - 1.0, where "0" represents the lower band, the "0.5" the middle band, and "1" the upper band. The line on the indicator represents the Closing prices. As simple as that. SETTINGS Bollinger Bands period of analysis Standard Deviation multiplier Shift Price type to be analyzed If you like
FREE
SuavizadorDePrecio
Cesar Juan Flores Navarro
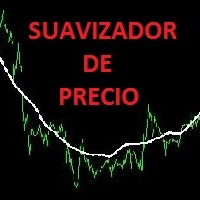
Funciona identificando picos de máximos y mínimos, para luego eliminarlos haciendo una linea o curva, pudiendo el usuario ingresar el valor de que tanto puede suavizar. Nos facilita poder ver la tendencia así como ver el cruce que puede hacer con otros indicadores, mostrando a simple vista los inicios y salidas de una tendencia u operación. Así también facilita la visualización de subidas y bajadas.
Smart Phase Box (SPB) — Indicator Description Smart Phase Box automatically locates consolidation zones (bases, flats) on the chart and analyzes the candle microstructure inside each zone — wicks, tick volume, body-to-range ratio, and where price closes relative to the zone — to estimate whether the zone looks more like accumulation (buyers absorbing supply) or distribution (sellers absorbing demand), based on classic Wyckoff / Smart Money concepts. MT4-version:  https://www.mql5.com/en/market/p
This indicator is a zero-lag indicator and displays  strength of trend change . True Trend  Oscillator Pro works best in combination with True Trend Moving Average Pro that displays exact trend as is. Oscillator value is exact price change in given direction of the trend. True Trend Moving Average Pro: https://www.mql5.com/en/market/product/103586 If you set PERIOD input parameter to 1 this indicator becomes a sharpshooter for binary options. Developers can use True Trend Oscillator in Exper
FREE
VisualVol EURUSD
Maxim Kuznetsov
The indicator highlights the points that a professional trader sees in ordinary indicators. VisualVol visually displays different volatility indicators on a single scale and a common align. Highlights the excess of volume indicators in color. At the same time, Tick and Real Volume, Actual range, ATR, candle size and return (open-close difference) can be displayed. Thanks to VisualVol, you will see the market periods and the right time for different trading operations. This version is intended f
FREE
TwoCandlesPattern
Balogoun Achille Oyaniyi
**TwoCandlesPattern – Expert Advisor for MetaTrader 5**   *A simple and robust trading system based on a two‑candle pattern, optimized for EURUSD on M15, with anti‑martingale risk management and trailing stop.* --- ### Overview **TwoCandlesPattern** is a fully automated Expert Advisor designed to detect reversal patterns on two consecutive candlesticks. The strategy has been specifically developed and tested on the **EURUSD** pair on the **M15** timeframe, where it demonstrates stable and re
该产品的买家也购买
Boba Analysis Suite
Trade Ready Solutions LLC
5 (2)
Boba Analysis Suite Boba Analysis Suite 是一款适用于 MetaTrader 5 的分析指标。它将市场结构、关键价格区域和整体市场背景整合到同一图表视图中。 该指标源于交易及交易教学的实践经验,旨在帮助用户建立有条理的分析流程:评估市场方向、识别重要价位,并结合多个时间周期进行分析。 结合市场背景进行分析 单个信号的意义取决于市场背景。Boba Analysis Suite 帮助用户将当前图表状况与更大范围的市场结构相结合,并根据预先制定的规则评估交易思路。 分析功能包括: **趋势与市场结构:**评估市场方向及相关结构背景。 **关键价格区域与价位:**在图表上直观标示值得进一步分析的重要区域。 **多时间周期:**整合不同时间周期的信息,评估整体市场背景。 **可视化分析流程:**直接在图表上查看分析信息。 自主做出交易决策 Boba Analysis Suite 适合希望系统分析图表并结合多个时间周期信息的交易者。 该指标用于辅助分析,不会开仓或平仓,也不能替代交易策略或风险管理。每一笔交易的决策均由用户自行做出。 使用与许可 平台:Meta
SQN Max indicator for MT5 by ITC
Renaud Herve Francois Candel
Sqn Max Indicator Sqn Max is an exclusive indicator to trade the market with high effectiveness. The indicator is based on price action, volatility and trend. This indicator is as simple as possible but not too simple. The indicator can generate alerts to ease the trading process. You don't have to stay all day in front of your screen. The indicator can be used with any class of assets and with any time frame. It is possible to achieve better results trading our list of selected assets. We achi
ARIPoint
Temirlan Kdyrkhan
1 (4)
ARIPoint is a powerful trading companion designed to generate high-probability entry signals with dynamic TP/SL/DP levels based on volatility. Built-in performance tracking shows win/loss stats, PP1/PP2 hits, and success rates all updated live. Key Features: Buy/Sell signals with adaptive volatility bands Real-time TP/SL/DP levels based on ATR Built-in MA Filter with optional ATR/StdDev volatility Performance stats panel (Success, Profit/Loss, PP1/PP2) Alerts via popup, sound, push, or email Cu
Zain Gold Scalping
Ahmed Gamal Abdel Nasser Mohamed
A complete price-action analysis tool built around dual independent entry logic, each confirmed against a volatility band, combined with a configurable set of nine optional confirmation filters that let you shape exactly how conservative or aggressive the tool's signals behave. Core Strategy Two independent entry setups, each triggering only when price moves outside a dynamic volatility band — giving two distinct ways to spot potential reversal points, which can be used together or separately.
Orderflow Big Trade 透過估算 Delta 熱力圖,揭示 K 線內部的隱藏壓力 您是否錯過了隱藏在標準 K 線 內部 的關鍵交易活動? Orderflow Big Trade 採用先進的高低價位與收盤價加權算法, 估算不同聚合分組價位上的買賣壓力。 它不單單依賴原始成交量, 而是將價格行為動態轉化為清晰直觀的 Delta 熱力圖——幫助您即時識別機構吸收、 突破動能、 被套牢的交易者以及關鍵價位的接受與拒絕。 [ 免費下載 Demo 試用版 ] 立即在您的實時圖表上測試完整功能。在決定購買之前,您可以自由調整參數、評估視覺清晰度,並體驗它如何完美融入您的交易策略中。 核心交易優勢 棒內 Delta 估算: 解析 K 線的高低價範圍與收盤位置, 推算特定價格聚類區間的買壓與賣壓。 收盤價加權技術: 智能提高靠近 K 線收盤價區域的 Delta 權重, 更準確地反映 K 線尾聲的市場控制力。 動能與吸收偵測: 快速判斷激進的市價單是在推動價格突破, 還是撞上了機構的被動掛單流(吸收)。 動態氣泡視覺化: 透過自訂顏色(藍色代表買
OrderFlow Absorption – 專業級MT5買賣差與吸收訊號指標 釋放真正訂單流分析的力量,OrderFlow Absorption 是MetaTrader 5上最強大的買賣差(Delta)直方圖與吸收訊號指標。專為想看清每一個價格波動背後真相的交易者設計,這個工具揭示了隱藏的買賣壓力與推動市場的吸收事件。 功能特色 買賣差直方圖視覺化:   以清晰的色彩直方圖即時顯示買方與賣方壓力。 吸收訊號偵測:   先進邏輯自動辨識多空吸收事件,及早預警潛在反轉。 圖表標記:   吸收訊號直接標示於主圖表,方便視覺辨識。 彈出式警報:   新吸收訊號出現時即時通知。 自訂門檻:   過濾弱訊號,專注高勝率機會。 資源管理:   高效運算,適用於大型圖表也能流暢運行。 全品種兼容:   適用於任何商品與週期,包括外匯、指數、商品等。 簡易整合:   參數簡單,快速上手與調整。 OrderFlow Absorption 的邏輯說明 OrderFlow Absorption 採用專利演算法,能在沒有完整Tick數據的情況下,估算每根K棒的買賣壓力(Delta)。它分析成交量、價格行為、K
TrendMaestro5
Stefano Frisetti
note: this indicator is for METATRADER4, if you want the version for METATRADER5 this is the link:  https://www.mql5.com/it/market/product/108106 TRENDMAESTRO ver 2.5 TRENDMAESTRO recognizes a new TREND from the start, he never makes mistakes. The certainty of identifying a new TREND is priceless. DESCRIPTION TRENDMAESTRO identifies a new TREND in the bud, this indicator examines the volatility, volumes and momentum to identify the moment in which there is an explosion of one or more of these da
OmniSync Projection
Antonio-alin Teculescu
5 (1)
Chronos Fractal Engine is an innovative price projection indicator for MetaTrader 5, designed to transform your technical analysis by intelligently identifying and projecting historical price patterns. Built upon an advanced correlation algorithm and the fractal principles of the market, this powerful tool visualizes potential future price movements, giving you a unique edge in your trading decisions. What is Chronos Fractal Engine? At its core, the Chronos Fractal Engine employs a sophisticat
FX-AIEA 供给需求区智能识别指标(Supply and Demand Indicators MT5)——技术原理与参数讨论 版本:2.51 | 适用平台:MetaTrader 5 引言 供给需求区是机构订单流的重要表现形式,相比传统支撑阻力位能更直接地反映买卖力量的失衡。本指标尝试通过算法自动识别高概率供需区域,以减少手动绘制的耗时与主观性。其核心逻辑基于自适应 ZigZag 算法,提取波峰波谷并生成区域标识 。 核心技术特点 全自动绘制机制 :基于改良版 ZigZag 动态提取有效极值,标记潜在供给区与需求区。指标遵循 MQL5 原生   prev_calculated   机制,在新 K 线生成时自动重绘,支持跨周期强制计算( Forced_TimeFrame   参数)。 区域边界模式 :支持宽带(覆盖K线影线极值)与窄带(仅覆盖实体)两种模式,用户可通过   use_narrow_bands   参数切换,以适应不同交易风格。 滤噪算法 :启用   kill_retouch   后,自动剔除被后续行情反复轻触但未有效突破的弱势区域,以提升信号有效性。 视觉与性能 :支持自
Zain Gold ScalpingV5
Ahmed Gamal Abdel Nasser Mohamed
Zain Gold Scalping V5 is a technical analysis indicator for MetaTrader 5 designed for Forex and Gold markets. It provides chart-based market information, trend analysis, signal conditions, and an on-screen dashboard to help traders analyze price movement across multiple timeframes. Main Features The indicator supports multiple timeframes, including M1, M5, M15, M30, H1 and higher timeframes. It can be used with Gold (XAUUSD), Forex currency pairs, indices and other supported instruments. The in
The indicator is designed to close positions on the market in time. For example: to take profits ahead of schedule if the price has not reached TakeProfit, and the market is turning around. The indicator analyzes the momentum, not the trend. He does not give any information about the trend. The indicator is well suited for finding divergence. The Ershov 38 Parrots indicator dynamically adjusts to the market and detects price movement impulses of medium and high amplitude. It almost does not rea
First time on MetaTrader, introducing IQ Star Lines, an original Vedic Astrology Based Intraday Trading Indicator. We don't offer free or bonus indicators in exchange of reviews from you. You won't need any free products with this indicator to make it work. ;) Enjoy! Welcome to the new and updated  IQ Star Lines , the ultimate fusion of ancient planetary cycles and modern quantitative trading, published for the first time on Metatrader. This is an indicator built by the developer, who has spent
AriX
Temirlan Kdyrkhan
1 (4)
AriX Indicator for MT5 A powerful trend-following and signal-evaluation tool AriX is a custom MT5 indicator that combines Moving Averages and ATR-based risk/reward logic to generate clear buy/sell signals. It visualizes dynamic SL/TP levels, evaluates past trade outcomes, and displays win/loss statistics in a clean on-chart panel. Key features include: Buy/Sell signals based on MA crossovers ATR-based SL/TP1/TP2/TP3 levels with visual lines and labels Signal outcome tracking with real-time stat
Meravith Scanner
Ivan Stefanov
5 (3)
MERAVITH SCANNER 是一款适用于 MetaTrader 5 的专业金融市场指标,将多种分析工具整合为一个统一的系统。它基于专有的成交量加权平均价格(VWAP)方法自动完成所有计算,完全消除主观判断。 该指标适用于所有资产类别(外汇、股票、指数、大宗商品、加密货币)以及从 M1 到 Monthly 的所有时间周期。其核心原理是价格跟随成交量。MERAVITH 识别机构资金成交量的集中区域,并从该集中区域中推导出数学上精确的价格水平。它不预测,不推测。它只计算。 使用 MERAVITH SCANNER,您可以在 2–3 分钟内扫描全部 28 个主要外汇货币对的所有时间周期。您也可以扫描任何您选择的市场——例如,大约 100 只股票约需 10 分钟。 该指标计算耗尽水平、平衡线、偏差、统计水平以及目标投射。 图表元素 Origin Point 标记所有计算的起始位置。指标会自动将其放置在最佳位置。红色标签(TOP)表示市场高点并带有看跌倾向。绿色标签(BOTTOM)表示市场低点并带有看涨倾向。 Sentiment Line 是一条动态曲线,反映基于成交量加权计算得出的市场情绪。
Boom & Crash & PainX & GainX Ultimate Spike Detector Trade Spikes With Confidence — Not Guesswork Catching spikes should be one of the most profitable strategies in synthetic markets. But for most traders, it becomes one of the most frustrating. You enter too early… price goes against you. You wait for a spike… it never comes. You finally catch one… but don’t know whether to hold or close. You make profit… then give it all back because there’s no exit plan. This is exactly the problem the Ultim
一句话理解 这是一个 二合一的智能指示器 ——把 RSI 和 MACD 两位“专家”的意见打包成一个简单的结论:出现箭头,就行动;没有箭头,就等待。 而且箭头 不会重绘 ,收盘后是什么样,永远就是什么样。 它解决了什么问题 很多交易者同时看 RSI(判断动量和超买超卖)和 MACD(判断趋势方向),但两者经常给出矛盾信号。 这个指示器的做法是: 只有两人同时同意 ,才发出信号。这就过滤掉了大量假信号和模糊时段。 你实际看到的东西 独立的指示器窗口(不遮住 K 线图) 清晰的 买入箭头 和 卖出箭头 放大版的 MACD 柱状图(更容易看清动量变化) RSI 和 MACD 的线依然在,但你的注意力只需放在箭头上 谁适合用 新手 :不用学两个指标如何配合,跟着箭头做即可 老手 :节省时间,快速过滤噪音,且不重绘的特性让回测结果可信 所有讨厌信号闪烁的人 为什么它不重绘 因为它的判断逻辑基于 完整收盘后的价格数据 。信号只有在满足条件的那一刻才会固定下来,之后不会因为后续 K 线的变化而修改之前的箭头。 这意味着你可以放心做回测,也能在实盘中信任你看到的每一个信号。 底层特点(不复杂地说) 它
Meravith MT5
Ivan Stefanov
5 (3)
MERAVITH 是一款适用于 MetaTrader 5 的多周期成交量与流动性指标,它在每一个时间周期上显示趋势、支撑与阻力区域、入场、目标和止损。它为您提供完整的市场流动性地图,一个对冲基金风格的流动性工具,并用专有的成交量加权平均价格方法自动完成全部计算,因此没有主观解读。 适用于外汇、黄金(XAUUSD)、指数和加密货币,适用于所有时间周期。 购买后赠送:一套关于如何用 MERAVITH 交易的视频课程。购买后请给我发消息。 MERAVITH 的功能 分析所有时间周期,并显示每个周期上正在生效的趋势。 标记流动性区域(Volume Equilibrium),即多头与空头成交量相等的位置。 将所有时间周期的流动性水平直接显示在您的图表上。 写出市场的文字分析供您参考。 根据当前趋势计算入场、目标、支撑位和止损。 计算您交易的风险回报比。 按您的账户余额计算仓位大小,并估算潜在利润。 在市场出现重要变化时提醒您:警报、电子邮件和推送到手机的通知。 主要线条 Bullish / Bearish Volume Exhaustion 线:目标位。 趋势线:随趋势改变颜色(多头或空头),显
Cycles Plotter
Edoardo Centorame
Cycles Plotter 带移动平均线和开始日期的可自定义周期指标 Cycles Plotter 是一种高级技术指标,可根据用户输入绘制两个完全可自定义的正弦周期。它不会自动生成周期:所有周期都完全根据用户设置的参数计算,为交易者提供一种视觉工具,用于研究价格波动和潜在的趋势变化,而不产生自动信号或预测。 关键点: 用户定义的周期:周期 1 P1 和 2 P2 完全由用户配置。可以设置周期长度、幅度、移动平均线以及精确的开始日期和时间。如果用户未输入参数,则不会绘制任何周期。 幅度控制:每个周期可以具有不同的幅度,从而可以相对于参考移动平均线调整波动的高度。 趋势检测:快速和慢速移动平均线表示周期的方向: Fast MA 大于 Slow MA 上涨阶段 绿色 lime Fast MA 小于 Slow MA 下跌阶段 magenta 红色 Fast MA 约等于 Slow MA 横向阶段 flat 橙色 蓝色 周期绘图:每个周期有三条独立的线: 上涨阶段 绿色 lime 下跌阶段 magenta 红色 横向阶段 flat 橙色 蓝色 可自定义的开始日期和时间:可以定义每个周期开始绘制
VTrende Pro
Andrii Diachenko
5 (1)
VTrende Pro - MTF indicator for trend trading with a display panel for MT5 *** Videos can be translated into any language using subtitles (video language - Russian) Although the signals of the VTrende Pro indicator can be used as signals of a full-fledged trading system, it is recommended to use them in conjunction with the Bill Williams TS. VTrende Pro is an extended version of the VTrende indicator. Difference between Pro version and VTrende: - Time zones - Signal V - signal 1-2 waves -    S
Volume Arrow Signal Product Description Volume Arrow Signal is a smart trading indicator designed to help traders identify potential buy and sell opportunities using price action, volume behavior, and directional arrow signals. The indicator places clear arrows directly on the chart, making it easy to spot possible market reversals, trend continuations, and entry opportunities without spending hours analyzing charts manually. Whether you are trading Gold (XAUUSD) , Forex pairs, Indices, or Crypt
MasterTrend
Temirlan Kdyrkhan
MasterTrend Indicator for MT5 A powerful trend-following and signal-evaluation tool MasterTrend   is a custom MT5 indicator that combines Moving Averages and ATR-based risk/reward logic to generate clear buy/sell signals. It visualizes dynamic SL/TP levels, evaluates past trade outcomes, and displays win/loss statistics in a clean on-chart panel. Key features include: Buy/Sell signals based on MA crossovers ATR-based SL/TP1/TP2/TP3 levels with visual lines and labels Signal outcome tracking wit
SMC Sweep Fvg MT5
Daniil Sleptsov
5 (1)
SMC Sweep Fvg MT5 — 像聪明钱一样看市场,就在你的图表上 你一定有过这种感觉:价格扫掉你的止损,随后反转,并正好走到你预期的方向。方向你是对的,错的只是入场。 这个指标就是为了让这类情况少发生。它接手分析中最繁重的部分——图表标注,把真正重要的留给你:决策。 你会在图表上看到什么 市场结构 — 真实的结构高点与低点,带有 HH / HL / LH / LL 标记和水平线。趋势一目了然,无需猜测。 失衡区(FVG) — 价格推进过快、之后常会回补的区域。未回补与已回补的区域用不同颜色显示。 流动性行为 — 指标跟踪市场在反转前扫过关键水平的时刻。 现成的交易布局 — 入场箭头、止损位与盈利目标。全部画好,无需心算。 趋势过滤 — 更高周期的趋势线,帮你站在主趋势一侧。 指标关注流动性扫荡、失衡形成与结构状态——并只突出这些因素同时对齐的情形。 统计面板——回应每一个疑虑 你不必只听别人说。图表上的内置面板会按所选历史显示: 分析周期(K线数量); 检测到的情形总数; 多少到达目标、多少触及止损; 仍在运行中的数量; 以点数计的净结果。 切换品种——面板重
Gold Xausd Hunter
Metin Erkamoglu
5 (2)
MATADOR GOLD XAUUSD M5 Scalp Signals for MT5 MATADOR GOLD is a decision-support indicator for MetaTrader 5, designed for traders who analyze short-term Gold movement on the M5 timeframe. The indicator does not open, close, or manage trades automatically. It provides buy and sell signal guidance so the user can make their own trading decisions according to their risk plan, broker conditions, and trade management rules. Main purpose MATADOR GOLD is built to help traders avoid noisy signal flow and
KenKem Master Volume Profiler - Brief Introduction A Display-only volume-profile cockpit for XAUUSD, BTCUSD and other liquid symbols. Draws profile structure, multi-timeframe flow, EMA trend and study-only setup markers. Places no orders. Not a signal service.  It maps where the market has actually traded and reads recent order flow, so you can see structure and lean at a glance.  What it shows: Master and local volume profiles (POC and value-area high/low) - the price shelves that matter. A liv
历史相似性匹配指标  概述 历史相似性匹配器(Historical Similarity Matcher)是 MetaTrader 5 的技术分析指标。它扫描历史价格数据,寻找与用户在图表上选定的参考时期具有统计相似性的片段。当找到匹配时,指标会显示历史模式,并根据这些历史片段的后续走势绘制潜在未来价格走势的投影。 本指标仅供教育和分析用途,不构成财务、投资或交易建议。不保证结果或盈利能力。过去表现不代表未来结果。交易存在重大损失风险。用户对自己的交易决策和结果负全责。  功能特点 - 识别与选定参考时期具有相关性的历史价格片段 - 支持正向和反向模式匹配 - 显示多个匹配的历史模式(数量可配置) - 为每个匹配绘制基于历史延续的独立投影线 - 可选 OpenCL 支持,在兼容硬件上加速计算(不支持时回退到 CPU) - 适用于任何时间周期和交易品种 - 允许在不同于当前图表的时间周期上进行扫描 - 在图表上提供启动扫描和导出结果的按钮 - 导出每个匹配的截图以及包含匹配详情的 CSV 文件  工作原理 1. 用户通过在图表上放置两条垂直线或在输入参数中设置日期来选择
==================================================================== SMC Pro v6.1 APEX AI — XAUUSD Gold Empire MetaTrader 5 指标 · Smart Money Concepts · 预测智能引擎 ==================================================================== SMC Pro v6.1 APEX AI 是一套专业的 Smart Money Concepts 指标系统,专为 MetaTrader 5 上的 XAUUSD(黄金)打造。 它将完整的 SMC 框架——Order Blocks、Liquidity sweeps(流动性扫荡)、Fair Value Gaps、Break of Structure、Change of Character——与 8 个全新的 AI 驱动模块相结合,直接在图表上呈现精准的可视化信号、预测轨迹线、彩色的 SL/TP 风险回报框,以及三级自适应 TP Ladde
XCalper TFO
Aecio de Feo Flora Neto
This oscillator was developed exclusively by xCalper in 2015 based on moving averages calculations to indicate and try predicting oversold and overbought levels. The fast line (white, by default) oscillates basically between values -0.5 (oversold) and +0.5 (overbought). Whenever this line crosses upward value -0.5, it means an oversold price level. When it crosses downward value +0.5, it means an overbought price level. When fast line crosses value 0.0 and returns, it is a strong pull-back indic
Pan PrizMA CD Phase
Aleksey Panfilov
The Expert Advisor and the video are attached in the Discussion tab . The robot applies only one order and strictly follows the signals to evaluate the indicator efficiency. Pan PrizMA CD Phase is an option based on the Pan PrizMA indicator. Details (in Russian). Averaging by a quadric-quartic polynomial increases the smoothness of lines, adds momentum and rhythm. Extrapolation by the sinusoid function near a constant allows adjusting the delay or lead of signals. The value of the phase - wave s
Классификатор силы тренда. Показания на истории не меняет. Изменяется классификация только незакрытого бара. По идее подобен полной системе ASCTrend, сигнальный модуль которой, точнее его аппроксимация в несколько "урезанном" виде, есть в свободном доступе, а также в терминале как сигнальный индикатор SilverTrend . Точной копией системы ASCTrend не является. Работает на всех инструментах и всех временных диапазонах. Индикатор использует несколько некоррелируемых между собой алгоритмов для класси
作者的更多信息
Trillonario del ORO
Cesar Juan Flores Navarro
Asesor Experto Trillonario del Oro es un  EA de riesgo extremo  (Super extremo - Sea millonario en un mes) Asesor Experto Trillonario del Oro es un sistema de trading automatizado de altísimo riesgo , diseñado para operar el mercado del oro (XAUUSD) con una lógica agresiva de crecimiento, escalado progresivo y manejo intensivo de posiciones. Su filosofía no es conservadora: está pensado para escenarios donde el operador acepta una volatilidad operativa muy fuerte, con la posibilidad real de obt
SuavizadorDePrecio
Cesar Juan Flores Navarro
Funciona identificando picos de máximos y mínimos, para luego eliminarlos haciendo una linea o curva, pudiendo el usuario ingresar el valor de que tanto puede suavizar. Nos facilita poder ver la tendencia así como ver el cruce que puede hacer con otros indicadores, mostrando a simple vista los inicios y salidas de una tendencia u operación. Así también facilita la visualización de subidas y bajadas.
Pendiente de Precio
Cesar Juan Flores Navarro
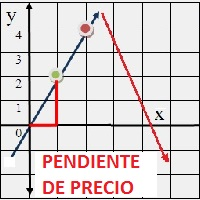
Indicador en base a la pendiente de la linea de precio, dibuja una línea de color cuando sube a base de los precios que previamente has sido procesados o linealizados, y cuando baja la pendiente la linea linealizada toma otro color. En este caso se a considerado 6 lineas de diferentes procesos desde pendientes largas hacia las cortas, observándose que cuando coincidan las pendientes se produce un máximo o mínimo, lo que a simple vista nos permitirá hacer una COMPRA O VENTA.
Robot Titan Rex
Cesar Juan Flores Navarro
Asesor Experto (EA) totalmente automático, opera sin ayuda del usuario, se llama Titan T-REX Robot (TTREX_EA),actualizado a la versión 2, diseñado a base de cálculos matemáticos y experiencia del diseñador plasmado en operaciones complejas que tratan de usar todas las herramientas propias posibles. Funciona con todas las criptomonedas y/o divisas del mercado Forex. No caduca, ni pasa de moda ya que se puede configurar el PERIODO desde M1..15, M30, H1.... Utiliza Scalping de forma moderada busca
Fibonacci Multiple 12
Cesar Juan Flores Navarro
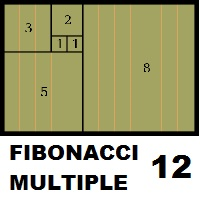
Fibonacci Múltiple 12, utiliza la serie fibonacci plasmado en el indicador fibonacci, aumentadolo 12 veces según su secuencia. El indicador fibonacci normalmente muestra una vez, el presente indicador se mostrara 12 veces empezando el numero que le indique siguiendo la secuencia. Se puede utilizar para ver la tendencia en periodos cortos y largos, de minutos a meses, solo aumentado el numero MULTIPLICA.
LineaMMSuavizado
Cesar Juan Flores Navarro
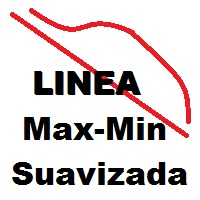
Se considera la secuencia de la serie Fibonacci (2,3,5,8,13) que sera multiplicado por un periodo (11 o 33 o 70 etc.), de las 5 lineas se sacara una sola que sera contendrá el máximo y mínimo de las 5, a esta linea se le aplicara un suavizador de 3....y a esta linea suavizada se le volverá a aplicar un suavizador de 3. obteniéndose 2 lineas suavizadas. A simple vista se ve las intersecciones que hacen las lineas que pueden ser usadas para comprar o vender. Cambien se puede usar con apoyo de otro
Linea Horizontal Inteligente
Cesar Juan Flores Navarro
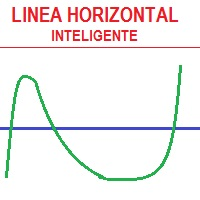
En base a cálculos matemáticos de determino una linea Horizontal que cruza a todas las señales de trading, mostrando los máximos y mínimos. La linea horizontal parte en dos las subidas y bajadas de las señales de trading, de tan manera que es fácil identificar los máximos y mínimos, y es inteligente por que es sensible a las subidas y bajadas, afín de no quedarse en un solo lado por siempre, trabaja excelentemente con otros indicadores suavizadores ya que les garantiza que en un intervalo de tie
Titan Inteligente REX
Cesar Juan Flores Navarro
TITAN INTELIGENTE REX es un asesor experto automatico al 100%, con puntos de entrada especiales que brindan una ventaja estadística, revelada a través del modelado matemático de patrones de mercado. El asesor no utiliza stop-loss, todas las operaciones se cierran después que encuentren un beneficio.   Existe la oportunidad de planificar aumentos de lotes. Configuraciones avanzadas para profesionales y un sistema que mejor funciona en GBPUSD (recomendado) y similares con Formato 0.12345 (5 dígi
Escalera Inteligente
Cesar Juan Flores Navarro
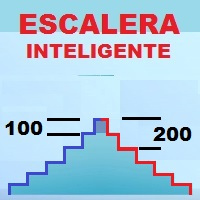
Indicador en MQL5, recibe la información del precio SUAVIZADO, lo procesa anulando los picos inteligentemente, y el resultado lo envía al desarrollo de la escalera que iniciara y subirá o bajara según el peldaño o INTERVALO ingresado Ingreso PERIODO = 50 (variar segun uso) Ingreso MULTIPLICA AL PERIODO = 1 (variar segun uso) Segun la configuración la escalera puede pegarse o separarse de los precios,, Se aplica toda la linea de tiempo, y a todas las divisas, etc.  
Fibonacci Suavizado
Cesar Juan Flores Navarro
Indicador en MQL5, que obtiene el promedio de 10 EMAS, que son alineadas según Fibonacci, obteniendo un promedio, que sera suavizado.  Se puede ingresar un numero desde 2 a N, que multiplica a los EMA-Fibonacci. Funciona en cualquier criptomoneda, etc. etc... pudiendo calcular el futuro segun la tendencia de las EMAS. Funciona excelentemente en tramos largos, determinando exactamente el mejor inicio/salida. El precio inicial por apertura sera por un periodo de tiempo, luego aumentará.
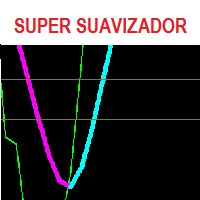
Super Suavizador
Cesar Juan Flores Navarro
Indicador en MQL5 que obtiene el promedio de 10 EMAS que son alineadas y procesadas según Fibonacci luego el promedio es suavizado"  Se ingresa un número de 2 a N que multiplica los EMA-Fibonacci y por consiguiente aumenta los fibonacci, resultando un promedio.   Se ingresa un número que suaviza los EMA-Fibonacci. Considerando los números 1/1 seria la suavización minima. Considerando los números 3/5 seria la suavización media. Considerando los números 10/30 seria la suavización alta.....etc
Inteligente TRex Raptor Rapido
Cesar Juan Flores Navarro
Robot de Forex configurable al 100%, contiene los parámetros necesarios para configurar el EA Raptor de tal manera que no queme ni una cuenta (ver las tablas), Observe las tablas y elija la mejor configuración. Este EA le permite crear configuraciones seleccionando los parámetros adecuadamente. El EA Raptor se basa en el precio de apertura y si posible tendencia, marcando y adecuándose en cada paso.. por lo que tiene los siguientes parámetros: Lots Inicio(Volumen 1, 0.1 ,0.01).......0.01 (Poner
RadioMedia
Cesar Juan Flores Navarro
Indicador de MQL5 basado en 3 EMAs, en función del precio. El precio influye en las EMAs, de tal forma que los Máximos y Mínimos solo la alteran minimamente, este influjo lo llame radio. Considerando la influencia del radio como constante, por lo que no tiene valores de entrada. Ideal para todas las criptomonedas. Funciona en todos los tiempos. Se sugiere operar cuando el precio este abajo y en bajada.... o cuando el precio este encima y en subida.
Super Suavizador Inteligente
Cesar Juan Flores Navarro
El Super Suavizador Inteligente es la culminación de la evolución de los suavizadores en funcion del precio, funciona en todos los pares de divisas, es fácil de usar, y puedes usarlo varias veces en un mismo par, afin de darte una idea de hacia donde va el precio, muy util para ver la tendencia a largo plazo. El SSI trata siempre de formar ondas de subidas y bajadas a fin de poder mostrar el máximo y/o mínimo de la tendencia del precio.
Aliens dougkang de moviles
Cesar Juan Flores Navarro
Tomamos 5 medios móviles las unimos en una la cual suavizamos y volvemos a suavizar, resultando un mega suavizador de medios móviles suavizadas. Indicador de mql5 funciona en cualquier broker y para todos los tiempos, siendo el mas optimo el de 5, 15 a mas. Funciona mejor en grupo consigo misma osea poner uno de 14 y otro de 50 y 400,, así se observa mejor su desempeño.
EA BBot Aliens 100 DouKang
Cesar Juan Flores Navarro
EL BBot Aliens 100 DouKang se basa en cálculos matemáticos en función del precio especialmente tratando de disminuir los riesgos de las subidas y bajadas extremas, utiliza dos entradas opuestas y si el precio sube se fortalece con mas entradas y si baja también se fortalece con mas entradas, (ver video). Se recomienda usar el test para determinar el deposito mínimo para cada par, en el caso del oro con el dolar es de 3mil (ver video). Si aumenta la distancia=1,,, disminuye el riesgo, (distancia
EA Aliens Media doble
Cesar Juan Flores Navarro
El robot de MQL5 Aliens mmedia doble, utiliza dos medios móviles para determinar las entradas, luego si logra una ganancia mínima de venta sino que usa scalpin en función de su cruce. Son deposito de 500 en cuenta centavos seria 50000.oo  se puede empezar con el par oro, teniendo un riesgo de 20000 ...con la configuración preestablecida LOTE= 0.01 GANANCIA= 3 MEDIA PEQUEÑA=50 MEDIO GRANDE=400 **************************************************** ** ** ** ************ Notas:    En M1 Mayor riesg
BOTON para trading manual
Cesar Juan Flores Navarro
El EA Boton pone botones de Buy y Sell en la pantalla Ideal para usuarios que habren muchas ordenes y diferentes pares 9 botones buy desde 0.01 al 0.09 y 9 botones sell de 0.01 al 0.09 9 botones buy desde 0.1 al 0.9 y 9 botones sell de 0.1 al 0.9 Boton Close buy y sell Boton Close buy positivos y Boton Sell positivos Boton Close buy negativos y Boton Sell negativos un boton close all y botones buy de 1, 5 y 10 y botones de sell 1,5, 10
Liga Dinamica
Cesar Juan Flores Navarro
El EA Liga Dinamica, tiene el comportamiento de una liga que se estira cuando pierde y cierra cuando es positivo,  analiza el precio y abre esperando dar positivo y cierra cuando lo considera negativo. Utiliza Indicadores: para cerrar, abrir y en caso de que de negativo para cerrar. ------------------------------------------------------------------------------------------------ CASO ORO / USD: En el video se muestra la configuracion del par XAUUSD: - Lote = 0.01 (utiliza el doble 0.02) - Gananci
ZigZag Triple Super
Cesar Juan Flores Navarro
Este Asesor Experto es un sistema de trading automatizado para MetaTrader 5 basado en estructura de mercado multi-escala mediante pivotes fractales tipo ZigZag, combinado con gestión dinámica de lotaje progresivo y cierre inteligente por retroceso de beneficio (basket retrace). El EA está diseñado para detectar cambios estructurales del mercado utilizando tres niveles de análisis simultáneo (Big, Mid y Small) y abrir operaciones alternadas de compra y venta con control de riesgo mediante gesti
SuperDoble Suavizador
Cesar Juan Flores Navarro
SUPER DOBLE SUAVISADOR es un indicador técnico para MetaTrader 5 diseñado para suavizar el movimiento del precio y mostrar de forma más clara los cambios de tendencia. Su objetivo principal es reducir el ruido del mercado y ayudar al trader a identificar mejor los movimientos alcistas y bajistas. El indicador trabaja como una línea tipo zigzag suavizada, donde los tramos de subida se muestran en color Agua  y los tramos de bajada en color Magenta , facilitando una lectura visual rápida del compo
Super Suavizador ZigZag Inteligente es un indicador técnico para MetaTrader 5 diseñado para detectar la dirección principal del mercado mediante una combinación de suavizado matemático avanzado y una estructura tipo ZigZag. El indicador primero procesa el precio con un suavizador, aplicando una o varias cascadas de suavizado para reducir el ruido del mercado. Luego utiliza una corrección matemática tipo Zero Lag por cascadas, que busca disminuir el retraso natural de las medias suavizadas. Lue
Canal de Máximos y Mínimos en Escalera Indicador avanzado para MT5 diseñado para analizar el rango diario del precio y construir niveles dinámicos en forma de escalera. El indicador calcula los máximos y mínimos reales de cada día, obtiene una distancia promedio histórica y la divide según el valor configurado en INPUT_Distancia . Con esa distancia genera niveles superiores e inferiores que sólo aparecen cuando el precio los alcanza. La línea amarilla representa el centro del canal. Desde ese pu
Bot Ciclon de Ondas Aleatorias
Cesar Juan Flores Navarro
ROBOT DE TRADING AUTOMATICO CICLON DE ONDAS ALEATORIAS   Asesor Experto totalmente seguro Robot de trading totalmente automático, genera ganancias siempre.   El Ciclón de Ondas Aleatorias, es un robot de trading automático desarrollado para MetaTrader 5 que identifica cambios de dirección mediante ciclos matemáticos internos: tenemos el ciclo pequeño medido por el PERIODO 1, y el ciclo mas grande medido por el PERIODO 2.   Cuando el Ciclo pequeño cruza al Ciclo mas grande, el robot genera una se
Asesor Experto Trillonario del Oro Version 2.0, es un  EA de   poco riesgo (Sea millonario en un año) Asesor Experto Trillonario del Oro   es un sistema de trading automatizado de poco riesgo ya que solo ariesgas 100 dolares en cuenta centavos, diseñado para operar el mercado del   oro (XAUUSD)   con una lógica agresiva de crecimiento, escalado progresivo y manejo intensivo de posiciones. Su filosofía no es conservadora: está pensado para escenarios donde el operador acepta una volatilidad opera
筛选:
无评论
回复评论