• 概述
  • 评论
  • 评论
  • 新特性

Impuls RMT


Только что открыли позицию, а цена резко пошла в другую сторону..Что делать? Просто потерпеть, усредниться или отстопиться (закрыться) и снова войти в сделку, но уже в противоположную сторону?  Как поступить...а может просто снимать сливки и торговать по разворотным импульсам ….в этом Вам поможет и подскажет

Индикатор тенденций и разворотов на базе коллекции паттернов советника  ReversMartinTral  https://www.mql5.com/ru/market/product/28761

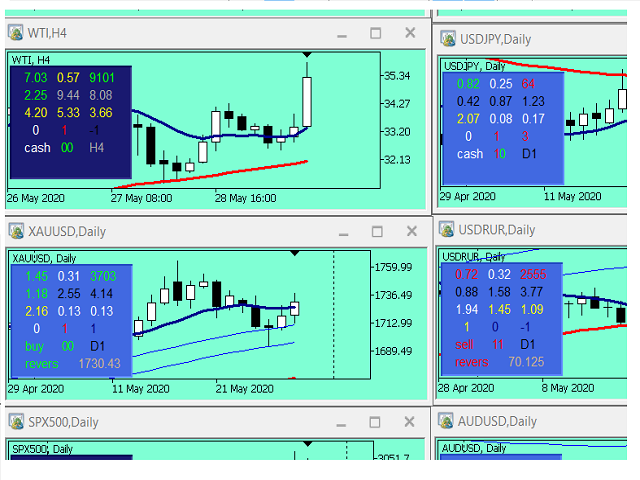
который кроме рекомендаций и сигналов реверса включает в себя характеристики последних 10 свечей  на волатильность, тренд/флэт.

Индикатор автоматически настраивается для работы и анализа на абсолютно любом инструменте платформы МТ5 у любого брокера на любом типе счетов.  

Характеристики раскраски числовых значений: 

Зеленый цвет = фактор роста // Красный цвет = фактор падения // Желтый цвет = фактор тренда // Белый цвет = фактор флэта
 
  cтрока 1
  волатильность сегодня // анализ отношения размера тел к размерам теней // отрыв от  LWMA 100          
 
  строка 2 
  волатильность последних дней // рендж последних дней // рендж 10 дней
 
  cтрока 3 
  наклон(сила) тренда 1 // наклон(сила) тренда 2 // наклон(сила) тренда 3             
 
  cтрока 4 
  наклон(сила) тренда 4 (да/нет) // анализ теней на "выкуп" (да/нет) // анализ перевеса теней (вверх/вниз)
 
  cтрока 5 
  тенденция последнего дня // индикация тенденции последнего дня и тенденции от реверса // таймфрейм  расчета 
 
  cтрока 6
  сигнал реверса // цена  
  

Некоторые пояснения: изначально на валютных парах волатильность измеряется в фигурах, все пропорции по иным торговым инструментам строятся из виртуальных пропорций. Чем больше наклон тренда тем сильнее присутствие на графике тренда (движения), чем больше соотношение тел к теням тем больше на графике явной тенденции (за исключением так называемых "сендвичей" ), когда на графике встречается несколько "доджиков" подряд отношение тел к теням на минимумах. Расцветка помогает сориентироваться, что преобладает на графике, и что можно ожидать от сигнала сильного движения или небольшого импульса. Анализ на выкуп это подобие поиска пинов и т.д.

Для фильтрации сигналов реверса от неподходящих для ситуации паттернов индикатор генерирует две глобальные переменные на сервере с начальными значениями 10, далее которые автоматически принимают нужные значения на интервале первых суток работы (строка 5,  второй столбец).

При резком движении цены (всплеск волатильности) присутствует индикация скорости с помощью окраски фона информационного табло в более темный цвет.

Сигналы реверса имеют настраиваемое звуковое сопровождение (вкл/выкл) и записываются в журнале работы.

Параметры

  •  SOUND  - звуковое сопровождение реверса.
Данная версия включает в себя как минимум 1558 пробойных и 983 флэтовых паттерна собранных с 9 валютных пар и факультативно с брента и золота и т.п. с интервала более 12 лет.  



推荐产品
Hello There, Today I want to show you my new researchable fore BUY SELL indicator, it work all asset, and also work Derive Volatility asset! it work all time frame, but i recommend start 5 minute to H1 when you receive a signal just take trade and stay wait for your take profit asset All Major Pair And minor IT WORK ALSO XAUUSD Fantastic results,  for more info,,, message us thank you   
Limitless MT5
Dmitriy Kashevich
Limitless MT5 is a universal indicator suitable for every beginner and experienced trader. works on all currency pairs, cryptocurrencies, raw stocks Limitless MT5 - already configured and does not require additional configuration And now the main thing Why Limitless MT5? 1 complete lack of redrawing 2 two years of testing by the best specialists in trading 3 the accuracy of correct signals exceeds 80% 4 performed well in trading during news releases Trading rules 1 buy signal - the ap
MarketMagnet
Kelly Adediran Raymond
Are you ready to take your trading journey to new heights? Look no further than MarketMagnet, this groundbreaking indicator designed to propel your trading success with excitement and accuracy. Powered by the convergence of Momentum and CCI (Commodity Channel Index), MarketMagnet equips traders with the ultimate tool to determine direction and entry prices for a wide range of recommended currency pairs and instruments. It is designed for traders seeking to scalp for a few pips on lower timeframe
RAD Real Acummulation and Distribution
Jose Alejandro Jacome Jimenez
RAD CRITICAL LEVES RAD indicator tracks “Relevant Volume” in real time, identifying accumulation and distribution processes, projecting them in the chart as SUPPORT or RESISTANCE zones. Natural   support   and resistance levels are generated by Volume Accumulation and Distribution processes. As these processes evolve, levels at which the relevant volume in the market place is positioned, become difficult areas to cross upwards or downwards. By using this information, traders can identify very s
HandleTrend
Kirill Subot
Trend indicator, a revolutionary unique solution for trend trading and filtering with all important trend features built into one tool! This is a 100% non-repainting multi-timeframe and multi-currency indicator that can be used on all currency pairs. HandleTrend is an effective trend following indicator that gives trend signals in the form of arrows on the chart.
Manyal trading system, CovEchoTrend Robot, focuses on reliability and flexibility. By employing statistical analysis methods to study the relationships between the base indicator and market patterns, the system enables a deeper understanding of market processes. Intelligent pattern analysis: The application of statistical data processing helps identify key trend reversal points more accurately, signaling significant market shifts. Informed decision-making is based on the intersection of indicato
ZP Day Trading Indicator in MT5 The ZP Day Trading Indicator is one of the tools developed based on Price Action trading style concepts in MetaTrader 5. This indicator uses color-coded boxes to identify Trading Ranges on the chart. A trading range forms when the price moves within a specific range between a resistance level (ceiling) and a support level (floor) over a period of time. In such scenarios, buyers and sellers reach equilibrium within the defined range. «Indicator Installation & User
FREE
The key logic of SignalTech is generated by Artificial Intelligence. The machine learning module should continue optimizing the core logic on the server side to guarantee that SignalTech System can accurately track the market's movement.  SignalTech can generate AI based signals with Buy/Sell Arrows and Pop-Up/Sound Alerts. Each signal has clear Entry and stop Loss levels, which should be automatically flagged on the chart, as well as potential Targets 1, 2, and 3. SignalTech can work on EURU
Adjustable Consecutive Fractals  looks for 2 or more fractals in one direction and sends out a on screen alert, sound alert and push notification, for strong reversal points . Adjustable Consecutive Fractals, shows the fractals on chart along with a color changing text for buy and sell signals when one or more fractals appear on one side of price. Adjustable Consecutive Fractals is based Bill Williams Fractals . The standard Bill Williams fractals are set at a non adjustable 5 bars, BUT withe th
RevCan Trend Entry MT5
A K M Syedur Rahman
5 (1)
[75% OFF - SALE ENDS SOON] - RevCan Trend Entry Point   is a trend based trade alert indicator for serious traders. It does all the price and chart analysis all by itself, and whenever it finds any potential high quality trading opportunity(Buy or Sell) using its revolutionized price prediction algorithms, it sends instant trade alert directly on the chart, MT4 terminal and on the mobile device.  The trade signals will be visible on the chart as Up and Down arrows, while the instant audible ale
EYeQ Indicator 是一个强大的工具,用于在 STEP INDEX、VOLATILITY 10、25、50、75 100、BOOM 和 CRUSH 上提供入场信号。 在 BOOM 和 CRUSH 300、500 和 1000 上捕获 SPIKES 更有效。 EYeQ 指标跨多个时间框架分析市场,并根据趋势找到最合适的切入点。您只需要打开桌面警报,以便在信号释放时收到通知。允许向其他便携式设备(如手机和平板电脑)推送通知,以获取在此类设备上进行远程交易的警报。 N/B:避免在 Boom 和 Crush 指数上使用它进行交易。此外,请注意该指标不提供退出点,如果在 MetaTrader 平台上每种工具的最低手数达到 3 美元的利润,您需要退出。 示例:最低手数;步骤索引-0.1 v75-0.001 v50-3 v25-0.5 同样适用于其余仪器 我们建议您将指示器安装在 VPS 上以获得实时信号警报。并始终记住将指标安装在 1 分钟时间框架图上。
Cycles Forecast
Pooriya Alirezaee
This indicator is based on a mathematical formula and an ANN combined, designed to make a model(using previous prices) of the most recent market condition (any chart*) in order to use the model as a forecasting tool. *This indicator can operate on any chart/timeframe, but it's suggested you use multiple timeframes for each trade because this method relies solely on the time factor, you can not use this indicator to predict price volatility, but if it's fit correctly it will show you when the nex
# NeuroX Quantum Arbitrage EA: Revolutionizing Automated Forex Trading ## Unleash the Power of Advanced Algorithms and Cutting-Edge Technology,  Load the preset by right-clicking on the EA on your chart, selecting "Properties," and then "Load" to import the   PRESET FILE . In the fast-paced world of forex trading, staying ahead of the curve is not just an advantage—it's a necessity. Introducing the NeuroX Quantum Arbitrage EA, a state-of-the-art Expert Advisor that combines time-tested trading
TPO Profile MT5
Kyra Nickaline Watson-gordon
Definition : TPO is a Time Price Opportunity. Instead of using bars or candles with an Open, High, Low, and Close price, each "bar" in a Market Profile is represented by horizontal bars against the price It is called Market Profile terminology. In other words time-price-opportunity (TPO) profiles are histograms of how much time was spent at each price within the span of the profile. By using a TPO chart, you are able to analyze the amount of trading activity, based on time, for each price level
解锁机构级交易策略,使用我们的先进供需区指标! 利用我们的 供需区指标 ,掌握机构交易策略,精准识别金融市场中的 高胜率买卖点 !通过定位机构资金的买入和卖出区域,该指标让您能与市场大玩家同步交易,把握重大趋势反转,提升盈利机会! 为什么这款指标是专业交易者的必备工具? 无限历史区域扫描 – 自动检测并可视化关键的供需区,无需手动分析,适用于任何时间周期和资产。 精准锁定高盈利区域 – 该指标能清晰标记市场供需区,帮助您预测市场反转和突破,提高交易成功率。 自动扫描K线 – 实时信号提示潜在的入场点,让交易决策更加智能化。 清晰的颜色编码区域 : 粉色区域(供应区) – 突破后变成需求区,但颜色保持不变。 天蓝色区域(需求区) – 突破后变成供应区,颜色仍保持不变。 自动识别关键交易模式 : Drop-Base-Drop(DBD) & Rally-Base-Drop(RBD) – 供应区。 Drop-Base-Rally(DBR) & Rally-Base-Rally(RBR) – 需求区。 掌握机构交易者的优势 大多数散户交易者亏损的
Your Trend Friend
Luigi Nunes Labigalini
5 (1)
The trend is your friend! Look at the color of the indicator and trade on that direction. It does not  repaint. After each candle is closed, that's the color of the trend. You can focus on shorter faster trends or major trends, just test what's most suitable for the symbol and timeframe you trade. Simply change the "Length" parameter and the indicator will automatically adapt. You can also change the color, thickness and style of the lines. Download and give it a try! There are big movements w
Market Maestro: Your Ideal Partner for Automated Forex Trading If you're looking for a reliable assistant for trading in the currency market, Market Maestro is exactly what you need. This modern Forex bot is built using the latest technologies and algorithms, allowing it to effectively analyze market data and make informed trading decisions in real-time. Key Features of Market Maestro 1. Multicurrency Capability for Broad Opportunities Market Maestro can work with a wide range of currency pairs,
SMC Venom 模型 BPR 指標是針對在智慧貨幣 (SMC) 概念內工作的交易者的專業工具。它會自動辨識價格圖表上的兩種關鍵模式: FVG (公平價值缺口)是三根蠟燭的組合,其中第一根和第三根蠟燭之間存在缺口。它在水平之間形成一個沒有成交量支撐的區域,這通常會導致價格調整。 BPR (平衡價格區間)是兩種 FVG 模式的組合,形成一個「橋樑」 - 當價格以低成交量活動移動時,突破並返回到水平的區域,從而在蠟燭之間產生間隙。 這些模式可協助交易者透過分析圖表上的交易量和價格動態(大型市場參與者和普通參與者之間的互動)來識別關鍵的支撐/阻力位、突破區域和切入點。 此指標以矩形和箭頭的形式可視化模式,也支援靈活的警報設定。 主要特點: 模式顯示模式:選擇顯示 BPR 模式(看漲和看跌)或 FVG 模式(看漲和看跌)。 可以隱藏所有圖表分析模式。 以條數過濾:BPR 結構中 FVG 之間的最小/最大距離。 訊號的附加視覺化: 箭頭有 9 種類型可供選擇(標準、細、分形等)或手動輸入 Wingdings 代碼,其表格可以選擇性地顯示在圖表上。 設定顏色、尺寸及其縮放時相對於價格的動態
Yawabeh SD Pro –  Professional Supply and Demand Indicator Trade Smarter with Volume-Confirmed Supply/Demand Zones Our institutional-grade algorithm identifies high-probability reversal zones before price reacts, giving you the edge in Forex, Crypto, and Stocks. Key Features Multi-Timeframe Confirmation – View trend strength across multiple timeframes simultaneously – Align your trades with higher timeframe momentum Smart Alert System – Real-time notifications for: – Strong demand/supply zone
PZ Mean Reversion MT5
PZ TRADING SLU
3 (2)
采用专业和量化方法进行均值回归交易的独特指标。它利用了价格以可预测和可衡量的方式转移并返回均值这一事实,这允许明确的进入和退出规则大大优于非量化交易策略。 [ Installation Guide | Update Guide | Troubleshooting | FAQ | All Products ] 清晰的交易信号 非常容易交易 可定制的颜色和尺寸 实现性能统计 优于大多数交易策略 显示合适的止损和止盈水平 它实现了电子邮件/声音/视觉警报 这个怎么运作 该指标从更高的时间范围测量完全可定制的移动平均线的标准偏差,并使用趋势跟踪方法精确地找到交易。交易是通过深入当前图表的价格行为发现的,并在价格返回到平均价格区间时关闭,根据您选择的更高时间范围计算。由于其编码方式,该指标将远离高波动性和强劲趋势市场,并且仅在可预测的情况下进行交易,在可接受的波动性与方向性比率范围内,回归均值是可行的。 指标剖析 绿线是更高时间范围内的移动平均线(也就是平均值) 虚线区域是移动平均线周围的典型价格区间 蓝线是看涨交易的突破价格 红线是看跌交易的突破价格 交易是针对均值进行的,并在典型的价格
Pro Trend Pulse
Anold Stephen Minja
TrendPulse Pro EA – Your Ultimate Trend-Following Companion by Noldy22 Elevate your trading game with TrendPulse Pro , the sleek, user‑friendly MT5 Expert Advisor designed for consistent, hands‑off trend trading. Why You’ll Love TrendPulse Pro Effortless Setup Simply attach to your chart and choose your preferred risk profile—Low, Medium, or High. Smart Risk Management One‑click risk modes and adjustable stop‑loss/take‑profit ensure you always trade within your comfort zone. Adaptive Profit Pro
MR Trend Corrections 5
Sergey Khramchenkov
We publish the indicator as a useful tool in trading and call this indicator the "Swiss Army Knife" because it provides many possibilities and combinations to help understand the material on the "Masters of Risk" trading system. The indicator itself is not part of the tools used in the "Masters of Risk" trading system. The indicator consists of 3 separate multi-timeframe indicators, which in combination with each other help to reduce the "noise" of false signals. The first of the indicators are
Sigma Level Analyzer
TECHAURORA - FZCO
The Sigma Level Analyzer is a trading indicator designed to visualize market structure, volatility breakout levels, and post-breakout price behavior during the three major trading sessions (Asia, London, New York). It is ideal for traders who want to: Identify session-based price ranges Detect breakouts and measure reaction/extents Improve precision in session-specific strategies Key Features Session Detection: Auto-identifies and labels Asia, London, and New York sessions. Range Highlighting:
SyntheticaFX Boom & Crash Multi 指标适用于 MetaTrader 5,是一款先进的交易工具,旨在通过检测潜在的峰值和分析各时间框架的市场趋势来提升您的交易策略。该指标专为 Crash 和 Boom 指数量身定制,提供及时警报和重要的趋势信息,帮助您做出明智的交易决策。 主要特点: 峰值检测: 检测以下指数和时间框架的潜在峰值: Crash 1000、900、600、500、300:3分钟和5-10分钟时间框架 Boom 1000、900、600、500、300:3分钟和5-10分钟时间框架 趋势分析: 显示市场是处于上升趋势还是下降趋势,帮助做出战略性入场和离场决策。 交易入场建议: 建议仅在下降趋势时进行 Crash 入场,仅在上升趋势时进行 Boom 入场。 推荐止损设置: 高风险和中风险入场:5-15(3分钟蜡烛) 入场1和2:5-6(5分钟蜡烛) 利润管理: 当交易进入利润区时,如果峰值触发,可考虑在关闭之前持有几根蜡烛。 如果没有其他峰值出现,确保在盈利时平仓。 使用指南: 结合您的分析以及支撑和阻力使用。 Crash 指数: 监控3分钟和5-
True Day
Aurthur Musendame
5 (1)
True Days is a tool designed specifically for the trader who wants to catch intraday volatility in price charts.  True day makes it easier for the trader to avoid trading in the dead zone - a period in time where markets are considered dead or non volatile. The trader can concentrate on finding opportunities only during periods of profound market movements. By default the indicator gives you a true day starting at 02:00 to 19:00 hours GMT+2. You can adjust according to your Time Zone. By deafult
FREE
本指标是实践实战交易完善的波浪自动分析的指标   !  案例... 注: 波浪分级用西方叫法不习惯,因受到缠论(缠中说禅)命名方式习惯的影响,我是将基础波浪命名为 笔 ,将二级波段命名为 段 ,同时具有趋势方向的段命名为 主趋段 (以后笔记中都是这种命名方式,先告知大家),但是算法上和缠论关系不大切勿混淆.反映的是本人分析盘面总结的 千变万化纷繁复杂的运行规律 . 对波段进行了标准化定义,不再是不同人不同的浪  ,   对人为干扰的画法进行了排除,在严格分析进场起到了关键的作用 . 使用这个指标,等于将交易界面提升美感,抛弃最原始的K线交易带你进入新的交易层次.如果不是为了交易,在宣传上也将使客户观感提升层次. 指标内容: 1.   基础波浪 (笔) : 首先我们找出了价格波动过程中的基础波动拐点,当然他的有序性低,为下一步的计算提供基础. 2.   二级波段( 段 ) :在基础波浪的基础上,通过算法分析得到层级更明显的二级波段,二级波段为波浪提供了分析基础 3.   波浪( 浪 ): 有着更清晰的趋势,更清晰直观的方向.分析一个波浪是否延续,需要看二级波段的形态,分析二级的构
Hello There, Today I want to show you my new researchable fore BUY SELL indicator, Golden Scalp System v2 it work all asset, it work all time frame, but i recommend start 5 minute to H1 when you receive a signal just take trade and stay wait for your take profit asset All Major Pair And minor IT WORK ALSO XAUUSD Fantastic results,  for more info,,, message us thank you 
Hello I Want to introduce The Forex Buy Sell Arrow Premium MT5 i recently release this premium indicator! its 1000% Non Repaint Indicator, It Work Perfectly Well,, i tested it day by day, Just mind blowing Result,  Including Powerful trend Algorithm! How It Work? well, it work market trend formula, when trend Bullish Or when trend Bearish,  Recommend Timeframe M30, H1 it work all timeframe, and all currency pair, 100% non repaint, How to take signal From Forex Buy Sell Arrow Premium Ind
QuantumAlert Stoch Navigator is a free indicator available for MT4/MT5 platforms, its work is to provide "alerts" when the market is inside "overbought and oversold" regions in the form of "buy or sell" signals. This indicator comes with many customization options mentioned in the parameter section below, user can customise these parameters as needful. Join our   MQL5 group , where we share important news and updates. You are also welcome to join our private channel as well, contact me for the p
FREE
The new update makes this indicator a complete tool for studying, analyzing and operating probabilistic patterns. It includes: On-chart Multi-asset percentage monitor. Configurable martingales. Twenty-one pre-configured patterns, including Mhi patterns and C3. An advanced pattern editor to store up to 5 custom patterns. Backtest mode to test results with loss reports. Trend filter. Hit operational filter. Martingale Cycles option. Various types of strategies and alerts. Confluence between patter
该产品的买家也购买
“ Dynamic Scalper System MT5 ”指标专为在趋势波内进行剥头皮交易而设计。 已在主要货币对和黄金上进行测试,并可与其他交易工具兼容。 提供顺势短线建仓信号,并提供额外的价格变动支持。 指标原理: 大箭头决定趋势方向。 在趋势波内,我们采用一种生成小箭头形式的剥头皮交易信号的算法。 红色箭头代表看涨方向,蓝色箭头代表看跌方向。 敏感的价格变动线会沿着趋势方向绘制,并与小箭头信号协同作用。 信号运作方式如下:当线在适当时刻出现时,将形成入场信号;在出现线时,持仓;线完成后,平仓。 建议的操作时间范围为M1 - H4。 箭头在当前K线上方形成,如果下一根K线已开仓,则不会重新绘制上一根K线上方的箭头。 输入参数 Trend Wave Period - 趋势方向(大箭头)的周期,改变趋势波的时间间隔。值 1 表示趋势方向的最长持续时间,参数值越大,持续时间越短。 Scalper Arrows Period - 信号箭头(小箭头)的计算周期,改变入场信号的生成频率。值 3 表示最频繁的生成频率,参数值越大,箭头频率越低,准确度越高。 这些参数可以根据不同
RelicusRoad Pro MT5
Relicus LLC
5 (20)
您购买了多少次交易指标,它们拥有 出色的回测, 真实账户表现证明 拥有惊人的数字和 各种统计数据, 但使用后您却 账户爆仓? 您不应该只相信一个信号本身,您需要知道它最初出现的原因,这正是 RelicusRoad Pro 的最佳之处! 用户手册 + 策略 + 培训视频 + 带 VIP 访问权限的私人群组 + 提供移动版本 观察市场的新方式 RelicusRoad 是 全球最强大、最好的交易指标 ,适用于外汇、期货、加密货币、股票和指数,为交易者提供发展账户所需的所有信息和工具。我们提供 技术分析 和 交易计划 ,帮助 每位交易者取得成功 ,无论是 初学者 还是 高级交易者 。 它是一个 关键交易指标 ,提供足够的信息来 预测 未来市场。我们相信一个 完整的解决方案 ,而不是图表上几个没有意义的不同指标。这是一个 一体化指标 ,显示 信号 、 箭头 + 价格行为 信息,这是 无与伦比 且 非常准确的 。   RelicusRoad 利用机器学习 (AI) 技术,为交易者提供必要的信息和工具,帮助他们成为成功的、知情的交易者。   通过领先指标预测未来价格 几乎 所有技术指标都滞后 ,
Jeslyn MT5
Justine Kelechi Ekweh
這是一個多用途系統,既適合外匯手動交易者,也適合作為黃牛系統或進入非常強勁勢頭的策略、二元期權交易者或由通用 EA 在自動化交易中使用。 Jeslyn頭指示器,但它具有復雜且邏輯的算法。它不會根據其他指標進行計算,而僅根據價格行為進行計算。我找到了一種方法來解釋趨勢、趨勢與動量的差異、背離與成交量價差分析之間的關係。有一些小型的供應和需求區域,其中的頭寸充滿動力,這些是我們在它們開始時想要的地方。他們還說我們無法在 Metatrader 中獲得真實交易量,好吧,我找到了一種方法來獲取它並通過價格動量操縱它。成交量、動量和分歧是這頓飯的秘訣。 Jeslyn頭指示器,但它具有復雜且邏輯的算法。它不會根據其他指標進行計算,而僅根據價格行為進行計算。我找到了一種方法來解釋趨勢、趨勢與動量的差異、背離與成交量價差分析之間的關係。有一些小型的供應和需求區域,其中的頭寸充滿動力,這些是我們在它們開始時想要的地方。他們還說我們無法在 Metatrader 中獲得真實交易量,好吧,我找到了一種方法來獲取它並通過價格動量操縱它。成交量、動量和分歧是這頓飯的秘訣。 我想要一種能夠經受住時間和所有
Elliot Waves Analyzer Pro
Viktor Weidenthal
2.67 (3)
Elliot Waves Analyzer Pro calculates Elliot Waves to Help Identify Trend direction and Entry Levels. Mainly for Swing Trading Strategies. Usually one would open a Position in trend direction for Wave 3 or a Correction for Wave C . This Indicator draws Target Levels for the current and next wave. Most important Rules for Elliot Wave Analysis are verified by the Indicator.  The Pro version analyzes Multiple Timeframes and shows the Subwaves and Target-Levels.   For an Overview  " Elliot Waves Anal
Cycle Maestro MT5
Stefano Frisetti
5 (1)
NOTE: CYCLEMAESTRO is distributed only on this website, there are no other distributors. Demo version is for reference only and is not supported. Full versione is perfectly functional and it is supported. CYCLEMAESTRO , the first and only indicator of Cyclic Analysis, useful for giving signals of TRADING, BUY, SELL, STOP LOSS, ADDING. Created on the logic of   Serghei Istrati   and programmed by   Stefano Frisetti ;   CYCLEMAESTRO   is not an indicator like the others, the challenge was to inter
Transaction Speed MT5
Ivan Stefanov
5 (2)
当然,以下是翻译成中文(简体)的版本: 该指标标出市场中显现出 交易兴趣 的区域,并随后显示 订单积累区域 。它的工作方式类似于大规模的订单簿。 这是为 大资金 打造的指标,性能卓越。市场中有任何兴趣,你都能通过它清晰看到。 (这是一个 完全重写的自动化版本 —— 不再需要手动分析。) 交易速度 是一个全新的概念指标,它显示了市场上大订单 何时 、 何地 聚集,并揭示了其背后的意义。它可以在 非常早期 就检测到趋势的变化。 在外汇市场,所谓的“交易量”实际上是误导性的,因为那指的是价格在单位时间内的变化,因此真正的名称应是“交易速度”。 一切都取决于我们如何思考、如何行动、如何分析。 改变分析范式至关重要。 该指标完全重构了外汇市场上“交易量”的概念,用逻辑方式重新定义并应用,从而成为一个 独特而精准的工具 。 使用方法: 默认情况下,指标处于 自动模式 ,可独立用于任何时间周期。如果你希望切换到手动模式,只需点击 Auto / Manual Mode 按钮即可。 在 手动模式 下,所有计算从 2025年1月1日 开始。你可以根据需要更改该日期,以查看不同的分析结果。 最优数据周期
The indicator is designed to work on any trading platform. The program is based on proprietary algorithms and W.D.Ganna's mathematics, allowing you to calculate target levels of price movement based on three points with the highest degree of certainty. It is a great tool for stock trading. The indicator has three buttons: NEW - call up a triangle for calculation. DEL - delete the selected triangle. DELS - completely remove all constructions. The probability of achieving the goals is more than 80
Multi Currency Multi Time Market Scan Signals It is an Advanced multi-utility dashboard which works with full customization of signal settings and graphical interface. It works with Multi Symbols and Multi-Time frames from 1 SINGLE CHART TEMPLATE. It will automatically open the charts where the latest signals had formed- showing the important levels (Entry, Targets, Stop Loss) Many types of sorting methods for the scanner. A robust ENTRY based on  TREND OF MULTI-TIME FRAMES ( Complex Signals
Enigmera MT5
Ivan Stefanov
3.67 (3)
ENIGMERA:市场核心 引言 该指标及交易系统为金融市场提供了一种卓越的方法。ENIGMERA 利用分形周期精确计算支撑位和阻力位,展示真实的积累阶段,并给出方向和目标——无论处于趋势还是回调,系统均能正常运行。 如何工作 指标的大部分功能由图表左侧的按钮控制,可快速应对不同的市场状况。 按钮说明 ON/OFF – 显示或隐藏整个指标。 Support – 趋势的主支撑线。 Ch – 激活支撑通道,标示可接受的偏差范围。 Dev1(第一偏差) – 显示价格在支撑偏差范围内的运动,表明市场盘整或力量积累。 Dev2(第二偏差) – 显示价格在偏差之间的运动,表明趋势正在形成及其方向。 Dev3(第三偏差) – 指示趋势显著加速和高波动性。 45deg(45度) – 显示市场节奏和相对于45线的运动稳定性。 Tgt(目标) – 趋势目标线,标示可平仓的位置。 Tgt Dev – 目标可能波动的通道范围。 Vol(成交量) – 在K线图上显示成交量点,标示市场成交量的显著变化。 X – 当价格到达目标线时显示“X”标记。 RandC(随机颜色) – 将指标线条和标签随机着色,以便更好地
Trend Compass MT5
Paul Edunyu Carissimo
Trend Compass: All-in-One Trend Tracking The Trend Compass indicator is a sophisticated yet user-friendly trading tool designed for both novice and experienced traders. By combining multiple technical analysis approaches into one comprehensive package, it eliminates the need for multiple indicators cluttering your charts. Key Features: Multiple analysis modes including VSA for effort/result evaluation Dynamic trailing stops using fractal levels Seven color visualization options for clear market
Reversal ALGO
Muhammad Abdullah Bhatti
Reversal Algo 是一款精心设计的技术指标,旨在帮助交易者识别市场趋势的潜在转折点。通过深入分析历史价格数据,它能够检测可能预示市场动能即将转变的重要高点和低点。该指标在您的图表上提供清晰且明确的视觉信号,使您能够精准定位趋势可能反转的关键区域。Reversal Algo 遵循严格的行业标准,提供客观且可靠的信息,而不做夸大的声明或保证。 主要特点 重要价格检测: Reversal Algo 系统地扫描历史价格数据,以识别标志潜在反转区域的显著峰值和谷值。它优先考虑统计上显著的水平,而非短暂的市场噪音,确保信号既有意义又可靠。 高级噪音过滤: 该指标采用复杂的波动性过滤器,最小化次要价格波动的影响。这种高级噪音过滤机制确保只有重要的价格运动会触发警报,从而减少误报的发生。 可定制参数: 通过广泛的可配置设置,交易者可以调整灵敏度和阈值水平,以根据特定的交易风格和市场条件定制该指标。无论您偏好保守的方法还是激进的策略,Reversal Algo 都可以根据您的个人需求进行微调。 稳健的数据分析: 通过检查广泛的历史价格数据,Reversal Algo 识别出重复的模式和关键水平
Speculator MT5
Ivan Stefanov
SPEKULATOR 是一款手动交易系统和指标工具,帮助您识别关键支撑区和市场方向。 用简单的策略和隐藏的智慧,掌控市场! 您只需在图表上选择任意一个高点和低点,指标将自动绘制: 您趋势的 支撑区 。上涨趋势显示绿色区域,下跌趋势则为红色。支撑区的灵敏度可在指标设置中进行调整。此区域表明在当前趋势下可能出现支撑的位置。 高低偏差线 根据 W.D. 甘氏九宫格(Square of 9) 计算的 角度线 如何入场交易: 当价格 突破高偏差线 时做多 当价格 跌破低偏差线 时做空 若价格在两条偏差线之间震荡,则在该区域内高抛低吸,但需尊重支撑区位置 甘氏角度线可作为 止盈目标区域 的参考。 关键水平为 360 度线 : 价格在其上方时,市场有上涨的可能; 价格在其下方时,市场可能继续下跌。 加载指标后,它将在图表上的第 20 根至第 50 根蜡烛之间出现。 点击该线以激活,激活后可将其移动至图表上的任意顶部或底部。 SPEKULATOR 是少数将 逻辑清晰性与视觉美感 相结合的指标之一。 您可以启用可选的 渐变填充效果 ,在两区之间呈现平滑、优雅的视觉过渡。 请注意: 启用渐变效果可能会影响
CBT Quantum Maverick
Arpit Sharma
1 (1)
CBT Quantum Maverick 高效的二元期权交易系统 CBT Quantum Maverick 是一款精心设计的高性能二元期权交易系统,专为追求精准、简单和纪律的交易者打造。无需自定义,该系统经过优化,可直接使用并产生高效结果。只需遵循信号操作,稍加练习即可掌握。 主要特点: 信号精准度: 基于当前K线生成下根K线交易信号,无频繁重绘。 市场多样性: 专为二元期权交易设计,兼容多种经纪商和资产类别,适应不同交易偏好。 兼容性: Deriv Synthetic Charts :适用于任何时间框架。 OTC Charts :来自如 Quotex、PocketOption、Binomo、Stockity、IQOption、Exnova、OlympTrade、Deriv、Binolla 和 Homebroker 的经纪商,可导入 MT5(一周内提供免费导入支持,之后需支付服务费用)。 外汇、加密货币和商品市场 :扩展资产利用。 高收益二元资产 :建议使用90%以上的高回报率资产。 额外优势: 全面的交易计划: 提供系统化和纪律性交易的分步支持计划。 高效时间利用: 每天仅需一
发现趋势。读取模式。把握入场时机。 三步只需30秒!轻松交易 — 无需分析,您的智能助手已准备好简化您的工作流程 不再因图表信息过载而困扰。 通过智能趋势偏向检测自信交易。 兼容所有货币、加密货币、股票、贵金属、指数及任意时间框架。 只需点击并执行 — 就这么简单。 非常适合希望快速清晰交易的忙碌交易者。 TPTSyncX 是一款强大的全能 MetaTrader 5 指标,可无缝同步 趋势、图形模式 与 K线触发 分析,并以清晰智能的可视化系统呈现。专为追求清晰度、精确性和速度的交易者设计,它通过结合价格行为、结构模式和市场时机工具,帮助识别高概率交易机会。 主要功能: 智能可视化显示: 自动绘制价格结构模式,并清晰标注高点高 (HH)、低点高 (HL)、高点低 (LH) 与低点低 (LL) 于图表上 — 实时展现市场结构变化与潜在反转区域,对识别趋势转换与价格突破至关重要。 订单区块 & 公允价值缺口自动识别: 只需在图表上双击,即可自动检测订单区块与公允价值缺口,突显潜在机构痕迹与失衡区域。 动态移动平均线: 根据所选目标K线范围自动调整周期,适用于短线剥头皮或长线波段交易的动态
TrendMaestro5
Stefano Frisetti
note: this indicator is for METATRADER4, if you want the version for METATRADER5 this is the link:  https://www.mql5.com/it/market/product/108106 TRENDMAESTRO ver 2.4 TRENDMAESTRO recognizes a new TREND in the bud, he never makes mistakes. The certainty of identifying a new TREND is priceless. DESCRIPTION TRENDMAESTRO identifies a new TREND in the bud, this indicator examines the volatility, volumes and momentum to identify the moment in which there is an explosion of one or more of these data a
This indicator is based on the mathematics of the great trader W.D. Ganna. With its help, you can easily find strong levels by analyzing swings to find the optimal entry point. The indicator works on all instruments and all timeframes. The indicator is fully manual and has control buttons. All you need to do is press the NEW button, a segment will appear, which you can place on any movement, swing or even 1 candle that you want to analyze. By placing the segment, press the OK button. A grid (th
Pro Thunder V10 神经网络交易指标 | MT5二元期权 & OTC交易信号 用   Pro Thunder V10   提升您的二元期权交易水平!这款专为MetaTrader 5打造的人工智能交易指标,结合尖端的神经网络技术和多年的市场分析经验,能够在各种市场条件下(包括新闻行情、OTC市场、Deriv指数(Boom 300、Crash 500)等)提供无与伦比的精准信号。全球数千名交易者信赖Pro Thunder V10,享受实时、稳定的盈利信号! 核心功能   AI智能分析 :基于高级神经网络实时解析市场数据,为二元期权、OTC及指数交易提供高精度信号。   多平台兼容 :完美支持   Olymp Trade、IQ Option、Pocket Option、Binomo   及所有MT5经纪商(含OTC和Deriv指数)。   无重绘信号 :信号稳定不漂移,确保您的交易决策基于可靠数据。   全面覆盖交易品种 :优化适用于   AUDCAD、EURUSD、GBPJPY、USDCAD 、Deriv Boom/Crash等15+主流货币对。   实时
FxaccurateLS
Shiv Raj Kumawat
WHY IS OUR FXACCCURATE LS MT5 THE PROFITABLE ? PROTECT YOUR CAPITAL WITH RISK MANAGEMENT Gives entry, stop and target levels from time to time. It finds Trading opportunities by analyzing what the price is doing during established trends. POWERFUL INDICATOR FOR A RELIABLE STRATEGIES We have made these indicators with a lot of years of hard work. It is made at a very advanced level. Established trends provide dozens of trading opportunities, but most trend indicators completely ignore them! The
精密指数振荡器(Pi-Osc)由Precision Trading Systems的Roger Medcalf开发 版本2经过精心重新编码,以在您的图表上加载速度非常快,还加入了一些其他技术改进,以提高体验。 Pi-Osc旨在提供准确的交易定时信号,旨在找到极端的耗尽点,这些点是市场被迫去触及,以清理每个人的止损单。 该产品解决了一个古老的问题,即知道极端点在哪里,这使得交易员的生活变得更加简单。 这是一个高度复杂的共识指标,与行业标准的振荡器相比,具有一些强大的区别。 它使用的一些特征包括需求指数、资金流动、RSI、随机指标、模式识别、成交量分析、标准偏差极端点以及不同长度上述各种变化的分歧。 乍一看,对于未经培训的人来说,它似乎与任何其他振荡器没有什么不同,但当与其他振荡器(如RSI或动量等)相对比时,这个指标的真正威力开始显现。 据我所知,没有其他振荡器可以频繁地精确指出顶部和底部,具有相同的定期效率。 精密指数振荡器由许多不同的数学方程组成,用于测量多个时间框架采样中的价格和成交量变动,从而高度准确地预测趋势可能发生转折的位置。 PTS Pi-Osc V2非
Weis Wave with Alert MT5
Trade The Volume Waves Single Member P.C.
4.94 (16)
Rental/Lifetime Package Options and Privileges  Rent Monthly Six Months   Yearly/Lifetime Weis Wave with Speed with Alert+Speed Index x x x Manual  x x x Quick Set up Video x x x Blog x x x Lifetime Updates x x x Setup and Training Material x x Discord Access Channel "The SI traders"          x Rectangle Break Alert Tool      x How to trade with it:    http://www.tradethevolumewaves.com   ** If you purchase please contact me to setup your  : Training Room and  complete manual access.  Wei
The   Time_Price_SQ9_Degree   indicator is based on the 9 Gann square. Using this indicator, you can identify strong time and price zones. The indicator displays the levels as a degree value. The degrees can be set in the settings. After launching, the MENU button appears. If it is highlighted, it can be moved to any point on the graph, and after double-clicking on it, it stops being highlighted and menu buttons appear. To hide the menu, just double-click on the button, it will become highlight
IVISTscalp5
Vadym Zhukovskyi
5 (6)
我们向您介绍iVISTscalp5指标,它不仅独特,而且在交易操作中也非常有效。该指标基于时间数据,是多年金融市场经验和深入分析的结果。iVISTscalp5指标是手动交易的优秀工具。便利性、简单性和可视化 - 所有的复杂性都隐藏在内部。我们将iVISTscalp5指标的设置和使用简化到了最大程度。该指标适用于MT5终端中您所拥有的所有金融工具。 操作时间为UTC+3的早上4点到晚上8点。 iVISTscalp5指标菜单(见截图1): History - 计算行情的周数 dT_min - 选择时间间隔的时间(分钟) TFline - 绘制水平成交量(时间帧) BARSline - 绘制水平成交量(条数) TFtrend1 - 绘制日线通道(时间帧) BARStrend1 - 绘制日线通道(条数) TFtrend2 - 绘制周线通道(时间帧) BARStrend2 - 绘制周线通道(条数) ALERT_TIMER - 设置闹钟 ALERT - 开启/关闭闹钟 Save - 开启/关闭将时间记录到文本文件。 图表上的红色和蓝色旗帜表示时间(VIST智能剃须系统的信号)。卖出信号为红旗,买入
UZFX {SSS} 短线交易智能信号 MT5 是一款专为短线交易者、日间交易者和波段交易者设计的非重绘高性能交易指标,旨在为快速变化的市场提供准确、实时的交易信号。该指标由 Usman Zabir(UZFX-LABS)开发,通过结合价格行为分析、趋势确认及智能过滤功能,可在所有货币对和时间框架下生成高概率的买入和卖出信号。 查看我所有的 MT4/MT5 指标和 EA >> 点击此处 如果您喜欢这个产品,请留下 5 星评价。谢谢 为什么信号可能出现延迟及最佳交易入场策略? UZFX {SSS} 短线交易智能信号 MT5 指标通过仅在蜡烛收盘后确认价格行为来避免虚假信号,这会导致信号出现“延迟”。此设计有意为之——消除重新绘制,确保信号可靠且不基于临时价格波动。虽然这意味着入场点可能无法捕捉到绝对的高点或低点,但通过过滤市场噪音,准确性显著提升。 最佳入场方式: 利用价格走势支撑——寻找额外共振(趋势线、关键水平或移动平均线)。 等待确认——仅在信号蜡烛收盘后入场以避免假突破。 等待反转蜡烛——在熊市反转蜡烛上方设置买入止损单,在牛市反转蜡烛下方设置卖出止损单 设置止损——将止损
The indicator is designed to close positions on the market in time. For example: to take profits ahead of schedule if the price has not reached TakeProfit, and the market is turning around. The indicator analyzes the momentum, not the trend. He does not give any information about the trend. The indicator is well suited for finding divergence. The Ershov 38 Parrots indicator dynamically adjusts to the market and detects price movement impulses of medium and high amplitude. It almost does not rea
[ MT4 Version ]  [ Order Blocks ]  [ Kill Zones ]  [ SMT Divergences ] How to trade using Order Blocks :  Click here User Interface Performance:  During testing in the strategy tester, the UI may experience lag. Rest assured, this issue is specific to the testing environment and does not affect the indicator's performance in live trading. Elevate your trading strategy with the  Order Blocks ICT Multi TF  indicator, a cutting-edge tool designed to enhance your trading decisions through advanced o
[ MT4 Version ]  [ Kill Zones ]  [ SMT Divergences ] How to trade using Order Blocks:  Click here User Interface Performance:  During testing in the strategy tester, the UI may experience lag. Rest assured, this issue is specific to the testing environment and does not affect the indicator's performance in live trading. Elevate your trading strategy with the  Order Blocks ICT Multi TF  indicator, a cutting-edge tool designed to enhance your trading decisions through advanced order block analysis
Viking Strategy Signal Indicator
E Bahamlong Bagoudjare
5 (1)
Viking_Strategy_Signal Indicator is a solution I offer to beginner, amateur, and professional traders.  4 copies left the next price 699.99$ Final price 999.99$ Additionally, when you purchase this indicator, I offer   free trading assistance BT3.0  and all complementary tools  and coaching via Zoom   to help you understand and efficiently use the solution . TRADERS, HERE'S THE SECRET WEAPON TO DOMINATE THE MARKETS WITH CONFIDENCE! Tired of false signals, emotional decisions, or wasting
Naveen Dynamic Square MT5
Satya Prakash Mishra
The Naveen Dynamic Square  MT5  is one of the best known  technical analysis tools  inspired  by WD Gann along with the Gann Fan and Gann Box. It is considered a cornerstone of his trading technique that is based on time and price symmetry. The Naveen Dynamic Square MT5   is a powerful tool in finance for determining support and resistance levels based on a stock's extreme price points. It works by extrapolating probable price levels from a central value, typically an all-time or cyclical high o
Crash500 Spike Detector v1.0 Crash500 spike detector prints Down non repaint Arrow for catching crash spikes. It is suitable for 1M time frame for majorly crash500  When the Red arrow prints, it indicates high probability of crash spikes downwards. Its pretty straight forward since I designed it to follow strong trends.  Use default settings, however, you can change the color of your chart background as may be appropriate. The system uses mathematical approach in to display statistical data inf
Super Zone indicator
Dmitriy Sotnikov
5 (1)
Super Zone   For several years of observing the principles of the market, Super Zone worked, both then and now, because the indicator  allows you to see the trading range of the  week and even the month that major market participants use. It’s very easy to use, we work on H4 in the weekly range (  in the tester it doesn’t work in the demo mode  ) - we sell from the upper zones, we buy from the lower ones. It marks the zones from the beginning of the week (month) that are  not redrawn  , works on
作者的更多信息
Появилось желание торговать  движение, пробой на самой  высокой волатильности, или запустить советника-усреднителя торговать боковик в тихой низковолатильной гавани тогда этот продукт для Вас! Индикатор анализирует 28 валютных пар (основные и кроссы) и в зависимости от выбранных настроек покажет самые высоковолатильные (max) или наоборот (min).       Как измерить волатильность? Существует 2 способа. Первый это измерить  рендж заданного количества последних баров (bar). Второй замерить о
Those familiar with chess-playing robots that successfully defeat grandmasters, know very well what a complex and large card catalog is. As a result, the Expert Advisor's algorithm is based on 320 reversal and 302 flat patterns formed by day candles on 7 major currency pairs, displayed on screenshots ( EURUSD_i, GBPUSD_i) from 12.01.2012 to 04.22.2018 (account currency USD, "Every tick" test mode, M1, MetaTrader 5). Positions are opened by analyzing the current and previous day candles with impu
筛选:
无评论
回复评论
版本 30.0 2025.04.13
Добавлены паттерны советника 59 версии.
版本 29.0 2025.01.08
Добавлены паттерны советника версии 58.
版本 28.0 2024.11.21
Добавлены паттерны версий советников 56 и 57.
版本 27.0 2024.07.08
Добавлены паттерны советников версий 54 и 55.
版本 26.0 2024.01.17
Добавлены паттерны советника 53 версии.
版本 25.0 2023.11.08
Добавлены паттерны советника версии 45.
版本 24.0 2023.09.03
Добавлены паттерны советника версии 51.
版本 23.0 2023.07.30
Добавлены паттерны версий советников 49 и 50.
版本 22.0 2023.04.20
Добавлены паттерны советника версии 48.
版本 21.0 2023.03.13
Добавлены паттерны советника версии 47.
版本 20.0 2023.01.29
Добавлены паттерны советника версии 46.
版本 19.0 2022.12.13
Добавлены паттерны версии советника 45.
版本 18.0 2022.10.18
Добавлены патттерны 44 версии.
版本 17.0 2022.08.02
Добавлены паттерны советника 43 версии
版本 16.0 2022.06.15
Добавлены паттерны советника 42 версии.
版本 15.0 2022.05.02
Добавлены паттерны 41 версии.
版本 14.0 2022.03.31
Добавлены паттерны советника 40 версии.
版本 13.0 2022.01.18
Добавлены паттерны 39 версии.
版本 12.0 2021.12.06
Добавлены паттерны 38 версии.
版本 11.0 2021.09.09
Добавлены паттерны 36 и 37 версий.
版本 10.0 2021.06.14
Добавлены паттерны 35 версии
版本 9.0 2021.05.02
Добавлены паттерны 34 версии.
版本 8.0 2021.02.22
Добавлены паттерны 33 версии.
版本 7.0 2021.01.17
Добавлены паттерны 32 версии
版本 6.0 2020.12.13
Добавлены паттерны 30 и 31 версий. Расчет с задержкой 15 тиков восстановлен.
版本 5.0 2020.10.11
Добавлены паттерны советника 29 версии.
版本 4.0 2020.09.01
Добавлены паттерны советника 28 версии.
版本 3.0 2020.08.11
Функционал задержки в 15 тиков отключен.
版本 2.0 2020.07.05
1. Отладка.
2. Добавлены паттерны советника 27 версии.