KT Alpha Hunter Arrows Scanner MT5

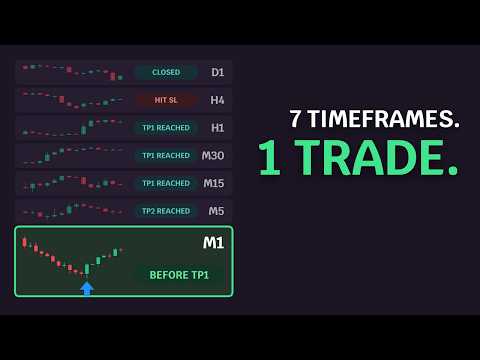
KT Alpha Hunter Arrows Scanner shows every fresh KT Alpha Hunter Arrows signal across all your symbols and timeframes in one table, so you reach the trade while you can still enter it.

A new arrow can appear on any chart while you are watching another one. This scanner indicator watches the whole list for you. It tells you which chart has a new signal, how far that trade has gone and what its profit is right now.

What you get

  • No signal goes unseen: every symbol of your Market Watch, from the 1 minute chart to the daily chart, is checked for you on one chart.
  • Enter on time: the status "Before TP1" marks a signal you can still take. The table also shows when a trade has passed its targets, hit its stop loss or was closed by the opposite signal.
  • The same ratings as on your chart: each row carries the buy and sell rating that KT Alpha Hunter Arrows gives that chart after Auto Optimize.
  • Live profit of every trade: in pips for forex and in points for gold, indices and shares.
  • One click to the ready chart: the Open button brings up the chart with KT Alpha Hunter Arrows already optimized, with the entry, the stop loss and TP1 to TP4 drawn.
  • Alerts once per signal: by popup with sound, push notification or email.


How to use it

Attach the scanner to one chart and leave it running. The table fills on the first run and is ready in about a minute after each restart. Start with the "Can enter now" card at the top, sort or search the table to find your symbol, then press Open on the row you want to trade.

The table works on its own. The Open button needs KT Alpha Hunter Arrows installed.

Recommendations

Use it on the markets you trade with KT Alpha Hunter Arrows: forex pairs, gold, indices and shares. Give the scanner a chart of its own so the table has room, and start it a few minutes before your session so the price history of every symbol is loaded. A signal is final when its candle closes.

Input parameters

  • Symbols: your own comma separated list; empty scans Market Watch.
  • Most symbols scanned: how many symbols the table holds.
  • Scan M1 to Scan MN1: the timeframes in the table.
  • Run Auto Optimize again after (days): how often each chart is optimized again.
  • Show No-Edge Signals as Exit Marks: keep it the same as in KT Alpha Hunter Arrows.
  • Show rows rated: all rows, or only the rows with a chosen rating or better.
  • Fresh signal: candles old or newer and Show only rows with a fresh signal: how new a signal must be to count as fresh, and a filter for fresh rows.
  • Rows per page and Panel corner: the size and place of the table.
  • Alerts: new signals, M1 and M5 alerts, exit alerts, popup with sound, push notification and email.


One table in place of a hundred charts

You see where the fresh signal is, you know if you can still enter, and you reach the chart in one click. Your time goes to the trades.
推荐产品
30 Indicator Comment Center — Your Full Trading Desk on One Chart 30 Indicator Comment Center turns your MetaTrader 5 chart into a complete confluence-trading workstation. Instead of stacking a dozen separate indicators and guessing how they agree, this tool runs 30 professional-grade technical engines simultaneously , blends them into a single live verdict, and presents everything through a clean, modern six-page interface — built right on your chart. No more switching windows. No more mental
Complete SMC/ICT Indicator MT5 — Smart Money Concepts 工具 Complete SMC/ICT Indicator 是一个独立的 Smart Money Concepts 分析工具,直接运行在图表窗口中。它提供机构级别的市场结构、不平衡和流动性区域检测,并支持全面自定义和提醒功能。   功能   该指标检测十个核心 SMC 元素:摆动高点和低点、公允价值缺口、订单块、结构突破、特征变化、市场结构转变、相等高点和低点、流动性扫荡、位移蜡烛以及溢价/折价区域。每个功能都可以在可拖动的面板中单独切换,区域会根据设置向前延伸显示在图表上。   多时间框架分析   该指标可同时运行在最多三个时间框架上,并为 TF1、TF2 和 TF3 提供独立配置。交易者可以直接在面板中切换显示的时间框架,无需重新启动或更改输入。   面板与提醒   面板提供快速功能控制,包括“全部显示”、“全部清除”和“重新扫描”选项。提醒功能可用于新检测到的形态,如 FVG、OB、BOS、CHoCH、MSS、扫荡和位移蜡烛,并通过弹窗、电子邮件或推送通知发送。所有提
RBreaker
Zhong Long Wu
RBreaker Gold Indicators 是黄金期货一种短线日内交易策略,它结合了趋势跟踪和日内反转两种交易方式,既能捕捉趋势行情的利润,又能在行情反转时及时止盈并顺势反手。 该策略曾连续15年被美国《Futures Truth》杂志评选为前十大最赚钱的交易策略之一,具有很长的生命周期,至今仍在国内外普遍使用与研究。 本指标结合了2026年期货黄金的走势,依据14日ATR指标,分别定义了突破系数A,观察系数B,反转系数R更合理的数值,非常不错的指标,已实现年稳定盈利,值得推荐~ 以上指标适合高波动品种,参数适合期货黄金,股指期货等,如果需要其他品种行情,需要单独设定 突破系数A,观察系数B,反转系数R,进行回测才能使用。 欢迎指标售后有问题可以加+V:504282029
TLM Gold Master Trading System A Professional Gold Trading Decision & Signal System for MetaTrader 5 The TLM Gold Master Trading System is a specialized MT5 indicator designed for traders who want a structured, multi-factor approach to analyzing Gold (XAUUSD). Instead of relying on a single indicator, the system combines trend direction, higher-timeframe confirmation, market volatility, momentum, pullback conditions, automatic support/resistance zones, and ATR-based price-space analysis into
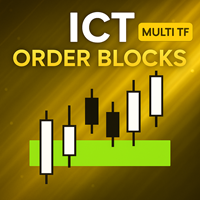
[ MT4 Version ]  [ Kill Zones ]  [ SMT Divergences ] Order Blocks ICT Multi TF - FVG-Confirmed Order Blocks for MT5 Most ICT order block indicators for MT5 turn every opposite candle into an order block. The chart fills up and the label stops meaning anything. Order Blocks ICT Multi TF uses Fair Value Gap confirmation and monitors up to four timeframes from one chart. It is built for traders who want a defined reason for the block, not another coloured rectangle. GIVE THE BLOCK A REASON TO MATTE
R trend sync indicator
Ekaterina Saltykova
r-Trend Sync indicator is manual trading system for extra volatility markets. Main System features : The indicators's algorithm is based on the analysis of an extensive array of historical data (from 1995 for EURUSD & EURJPY and from 2004 for XAUUSD), which ensured the identification of general patterns in the behavior of these pairs across a wide range of timeframes. The analysis of historical data helped the system learn to recognize market triggers for medium-term trends and cycles, as well a
RED ZONE Monitor Loss-Cut & Break-Even Risk Monitor for Averaging Traders (MT5) RED ZONE Monitor is a risk management indicator for traders who use averaging, scaling-in, or multiple open positions . It visually displays: The loss-cut (liquidation) risk zone The break-even price Based on current open positions, lots, and margin conditions This indicator does not provide entry signals. It does not promise profits. It shows where your account actually fails if price moves against you. What RED ZO
TurtleLongTerm
Yan Xiong Xue
单品种海龟策略(中长期版1.02) 建议周期:H4 建议品种:GBPUSD|GBPJPY|USDJPY|XAUUSD|XTIUSD|CADJPY|GBPCAD|USTEC|BTCUSD|HK50|DE40|JP225 策略简介: 1,长周期唐奇安通道突破进场(默认55) 2,百分比止损倒推仓位开仓(默认1%) 3,出场:短周期唐奇安通道反向突破(默认10) 4,初始止损:2倍ATR 5,跟踪止损:高低点回撤N倍ATR(默认0.5,可关闭) 6,跟踪止损触发:盈利N倍ATR后开启跟踪止损 7,均线过滤,均线金叉只做多,死叉只做空(可关闭) - 无加仓功能 - 图表可选择显示交易所需技术指标 默认参数非最优参数,实盘交易请自行优化调整,参数和回测仅作参考 演示视频链接: https://www.bilibili.com/video/BV1CN9nYBE2a/?spm_id_from=333.1387.list.card_archive.click&vd_source=6cd1979b7d460e26d2386e3a515d5ea7
概述 Candle Timer Countdown Pro 显示当前K线收盘的平滑、精准倒计时,并配有一个圆形进度弧,让您一眼即可直观了解剩余时间。不同于其他在无新tick时会冻结或时间漂移的计时器,本指标使用服务器时间插值算法,在 M1 至 MN 的所有周期上提供无卡顿的平滑倒计时。 无论您是在1分钟图上进行剥头皮交易,还是在H4进行波段操作,准确知道当前K线何时收盘,有助于把握入场时机、确认K线形态,并避免过早决策。 为什么本计时器与众不同 大多数 MT5 计时器仅依赖 TimeCurrent(),该函数只有在新tick到来时才更新。在低波动或高周期图表中,tick可能间隔数秒,导致计时器冻结后突然跳动。 本指标通过在每次tick到达时锚定服务器时间,并在两次tick之间使用本地毫秒时钟进行插值计算,实现每0.5秒平滑递减,无卡顿、无延迟。同时配备实时圆形进度弧,提供独特的可视化时间提示。 主要功能 精准倒计时 服务器时间插值确保即使在tick稀少时也能平滑倒计时,无冻结、无跳动、无漂移。 圆形进度弧 在倒计时文字旁显示实时圆形进度环。 可选样式: 空心圆环 实心扇形 颜色随多空方
Gold Citadel
Marco Alexandre Ferreira Feijo
Gold Citadel — Institutional Supply and Demand EA for XAUUSD Small Stop Loss. Large Take Profit. Real protection on every trade. Gold Citadel trades the way institutions do: identify where smart money places orders, enter at those levels, and target a reward multiple times the risk. No grid. No martingale. No hidden tricks. Just clean asymmetric trading on gold. The Core Principle Most EAs chase small profits with wide stop losses — they win often but one bad trade erases weeks of gains. Gold Ci
TheRealPrice v3.0 | Ultimate Spread & Ask Visualizer TheRealPrice is a high-precision utility for MetaTrader 5 designed to expose the hidden cost of every trade: The Spread . While standard charts only display the Bid price, professional traders know that buy orders and short-exits happen at the Ask price. TheRealPrice bridges this gap by drawing a dynamic, real-time horizontal line that tracks the exact Ask level, providing a clear visual representation of the current market spread. Why do you
Non-Repainting. Non-Redrawing. Non-Lagging. Signals appear only on confirmed bars. What you see on history is exactly what appeared in real time. Built specifically for Gold (XAUUSD) traders. Gold ML Supertrend MT5 is the only Supertrend indicator on MQL5 that learns. Instead of using a fixed multiplier, it runs a K-means clustering algorithm on recent price data to find the optimal band width. Then it adapts that width per trading session (Asia/London/NY) based on what actually worked. The resu
This is a highly accurate spike detector especially on higher time frames. This indicator is created for Boom and Crash Markets on Deriv and PainX and GainX Markets on Weltrade. There are a lot of settings to adjust to your strategy. It uses a highly secret algorithm that allows this spike detector to pick up signals all time frames. This indicator will pay itself off in one week. Make sure you stay below or above 60 SMA depending on if you are buying or selling. Once you cross the 200 SMA in th
WaveSniper
Alessandro Farinella
Wave Sniper One indicator. Adaptive baseline, multi-layer signal engine, and closed-bar confirmed entries — designed for traders who want precision without complexity. I tried to build the perfect indicator. I ended up deleting most of them. I used, studied and coded hundreds of indicators. I analyzed and converted entire libraries from PineScript, ProRealCode, EasyLanguage, MQL. Oscillators, moving averages, bands, candlestick pattern: you name it! I spent weeks, even months optimizing param
平均方向指数(ADX) 多货币扫描仪 MT5 是一种先进的交易指标,旨在同时分析多个货币对。它为希望通过基于平均方向指数提供实时信号来增强决策过程的交易者带来了好处,从而实现高效的市场趋势分析。 该工具通过简化趋势强度和方向移动的识别,优化了交易体验,使其成为采用 ADX 基础策略的交易者的重要资产。借助实时警报和用户友好的仪表板,交易者可以快速评估市场状况并做出明智的交易选择。 MQL产品安装指南 | 在 MT4/MT5 上更新已购买的MQL产品 | 常见故障排除指南 | 指标设置/指南 主要特点 缓冲区集成:将指标值暴露为可访问的缓冲区,允许 Expert Advisor 使用信号数据进行自动交易。 可视化箭头信号:在信号蜡烛上直接在图表上显示清晰的买入/卖出箭头,便于快速视觉分析。 快速且可回测:基于 MetaTrader 的本地 OnCalculate() 引擎构建,确保快速计算并与历史回测兼容。 弹出警报:在信号事件期间触发 MetaTrader 警报弹出窗口,确保交易者不会错过潜在的交易设置。 推送通知:向移动设备发送即时推送通知,使交易者能够在移动中监控信号。 电子邮件警
CCI Fixed Dual
Edoardo Centorame
什么是 CCI FIXED DUAL CCI FIXED DUAL 是一个专业级 Trend Direction Filter,旨在精准识别: 市场的主导方向 走势的结构质量 主趋势与加速阶段之间的一致性 它不是一个直接入场指标。 它不是一个传统振荡器。 它是一个市场环境工具,旨在帮助交易者决定何时交易以及何时不交易,从而大幅减少市场噪音和判断错误。 CCI FIXED DUAL 的基本理念 CCI FIXED DUAL 所基于的原则简单但强大: 一个信号只有在与市场结构一致时才有价值。 因此,该指标: 不使用单一数值 不会对价格做出冲动反应 不会刻意寻找反转点 而是建立在以下基础之上,构建出一种层级化的趋势解读: 基于 Typical Price 的 CCI 不同速度的 LWMA 移动平均线 短期 中期 和长期之间的动态比较 因此,其结果是对市场方向的一种稳定 干净 且可靠的表达。 指标的技术结构: CCI FIXED DUAL 由四个主要部分组成,全部显示在独立窗口中。 1 CCI magenta 线 这是指标的信息基础。 衡量典型价格的偏离程度 提供应用平滑处理的原始材料 它并不
Hull Suite Alert MT5
Biswarup Banerjee
介绍 Hull Suite by InSilico MT5,这是一个复杂的交易指标,旨在通过提供平滑、低延迟的趋势可视化来增强您的技术分析。该工具非常适合寻求在各种市场中(包括 forex、指数、商品和加密货币)精确交易策略的交易者。 使用 Hull Suite by InSilico MT5,交易者可以体验到显著的优势,例如趋势清晰度的提高和更快的决策能力。无论您是新手还是经验丰富的交易者,这个指标都能帮助您有效识别市场趋势,帮助您实时做出明智的交易决策。 MQL 产品安装指南 | 在 MT5 上更新已购买的 MQL 产品 | 一般故障排除指南 | 指标设置 / 指南 主要特点 缓冲区集成:将指标值公开为可访问的缓冲区,允许 Expert Advisor 使用它们进行自动交易。 非重绘信号:仅在已关闭的柱上提供确认信号,确保准确的历史和实时交易表现。 快速且可回测:基于 MetaTrader 高效的 OnCalculate() 引擎,快速计算并与策略测试器兼容。 弹出警报:在 MetaTrader 中触发警报弹出窗口,以便立即通知信号事件。 推送通知:实时将警报发送到您的移动设备,让
SUPERTREND;   It is a trend following indicator based on the SuperTrend ATR created by Nav. It can be used to detect changes in trend direction and locate stops. When the price falls below the indicator curve, it turns red and indicates a downtrend. Conversely, when the price moves above the curve, the indicator turns green, indicating an uptrend. BUY/SELL Signals; Method 1; A standard strategy using a single SuperTrend is   While ST Period 1=10, ST Multiplier 1=3, - SELL signal when the bars f
NQX Session Range Breakout
Marcel De Oliveira Farias
NQX Session Range Breakout 是一款适用于 MetaTrader 5 的信号指标:欧洲开盘时隔夜区间的突破。 NQX 专有逻辑:标出平静的隔夜区间,并在欧洲时段首次明确收盘于区间之外时发出信号。它会绘制建议入场位、较短的止损和较远的目标(3:1、5:1、10:1);由您决定。 图表上显示的内容 - 在已收盘的信号K线上显示箭头(已收盘的信号绝不重绘)。 - 建议入场位、较短的止损和较远的建议目标(默认为风险的 5 倍),以及 3 x 1、5 x 1 和 10 x 1 参考线。 - 价格触及某一水平时,图表上会显示标签(目标或止损)。 - 显示最近一次信号以及可见历史中出现的信号数量的面板。 - 新信号的弹窗提醒和推送通知(可选)。 NQX 独家逻辑:没有其他任何 NQX 指标使用相同的入场信号与市场过滤器组合,因此其信号为本指标所独有。 设置 - 主要建议目标(风险倍数)及额外目标线(默认为 3 x 1、5 x 1 和 10 x 1)。 - 最小和最大止损距离(ATR 倍数),以及信号保持开启的最大K线数。 - 信号规则已内置并受保护:无需调整。 - 颜色、历史
SPIKE Radar Alet
Odete Argelio Simbine
SPIKE DETECTOR RADAR ALERT – Surgical Precision in Explosive Market Movements Master market spikes with early alerts and high probability accuracy. Spike Detector Radar Alert is an advanced indicator for MetaTrader 5, developed to identify sudden price movements (spikes) in advance with enhanced precision. By combining volatility analysis, momentum strength, and price acceleration, the algorithm delivers clear signals at key market moments. Why traders choose Spike Detector Radar Alert: Mul
Divergence Matrix Pro for MetaTrader 5 Divergence Matrix Pro is a confirmed multi-oscillator divergence indicator for MetaTrader 5. It detects regular and hidden divergence between price and selected oscillators, then presents the confirmed structure through divergence lines, pivot labels, action markers, an optional current-timeframe Matrix Panel and optional alerts. The indicator is an analysis and confirmation tool. It does not open or close trades, and the signal score is not a win rate or a
概述 多级ATR和移动平均带指标是一个强大的工具,旨在帮助交易者识别市场趋势、支撑和阻力水平以及波动性。该指标将多条移动平均线与ATR(平均真实波幅)乘数结合在一起,以创建围绕价格波动的直观带状图。它帮助交易者发现潜在的反转区域、趋势条件和市场整合区域。 特点 多重带状显示: 显示六条动态带,基于移动平均线和ATR计算,使用不同颜色以便于识别趋势(红色、橙色、黄色、绿色、蓝色和紫色)。 ATR波动带: 根据市场波动性调整带状图,通过ATR乘数提供清晰的视觉信号,用于潜在的反转或持续价格走势。 可定制的参数: 完全可以调整ATR乘数和移动平均线周期,以适应不同的市场条件和交易策略。 明确的趋势识别: 带状图根据波动性扩展和收缩,使交易者可以轻松看到趋势、整合期和潜在的突破点。 适用于多个时间框架: 适用于任何交易时间框架,从短期的高频交易到长期投资。 使用方法 趋势识别: 使用该指标来区分趋势市场和横盘市场。扩展的带状图表示波动性增加和潜在的突破,而收缩的带状图表示低波动性和整合。 反转信号: 当价格触及最外侧的带状图时,这通常是潜在反转点的信号。交易者可以在确认其他指标或分析后设置止损
FREE
Xau scaper indicator - Advanced Gold Reversal & Trend Scalper Xau scaper indicator is an advanced technical analysis tool designed specifically for traders operating pure scalping strategies on Gold (XAU). Optimized for capturing rapid movements on lower timeframes, this indicator combines two powerful market logics into a single tool: identifying reversal points and clear reading of the underlying trend . Ideal for highly volatile assets like Gold, Xau scaper indicator offers timely signals for
SuperTrend Sentinel Levels 是一款适用于 MetaTrader 4 的 无重绘 SuperTrend 指标 ,将经典的 SuperTrend 趋势跟随引擎与五重共振过滤器结合,用于筛选高质量交易信号。每一次趋势反转,指标都会在图表上绘制买入或卖出箭头,并自动生成完整的风险结构——入场价、止损(固定或移动)、TP1、TP2 和 TP3——同时,一个包含 18 行信息的综合仪表盘会跟踪评估当前交易结构所需的各种市场环境数据。包含 11 个信号类型的告警系统可以通过弹窗、声音、邮件和手机推送等多种方式发送提醒。 MT5 版本请查看:  SuperTrend Sentinel Levels MT5 更多产品请访问:   全部产品 想查看实盘示例和最新工具,请访问我的个人主页并发送好友请求,以免错过任何更新! 工作原理 SuperTrend 引擎 指标使用可配置的 ATR(默认周期 10,系数 3.0)应用于   (High + Low) / 2   来构建 SuperTrend 线。趋势状态以“单向棘轮”的方式推进——在价格收盘跌破前一根 K 线的多头跟踪线之前,趋势
Inguz
Maxim Kuznetsov
Ing (inguz,ingwar) - the 23rd rune of the elder Futhark ᛝ, Unicode+16DD. Add some runic magic to your trading strategies. The correct marking of the daily chart will indicate to you the successful moments for counter-trend trading. Simple to use, has high efficiency in volatile areas. Be careful in lateral movements. Signals ᛝ are generated when the main lines of construction intersect. Red arrow down - recommended sales Blue up arrow - recommended purchases rare purple arrows indicate exce
Maximum Trend Arrows OT MT5
Mulweli Valdaz Makulana
STRICTLY FOR BOOM INDEX ONLY!!!!! Here I bring the Maximum Trend Arrows OT1.0 MT5 indicator. This indicator is made up of a combination of different trend indicators for entries and exits, for entries an orange arrow will paint on the chart below the current market and a red flag for closing of trades and it produces buy arrows only. When the orange arrow appears, it will appear along with it's sound to notify you. The 1H timeframe is recommended, don't use it anywhere else than on the 1H timefr
Supply and Demand DE 灵感 EA 专业供需区交易系统与多时间框架确认 概述 这个高级专家顾问使用机构交易原则自动识别和交易高概率供需区。EA将经典的供需区检测与现代确认过滤器相结合,包括结构突破(BoS)、公允价值缺口(FVG)和更高时间框架验证。 设置文件链接: https://drive.google.com/drive/folders/1nkK8_dy0gi7G2bFvy-Gdq9vZxq8Gsd0q?usp=drive_link 核心交易策略 区域检测: 基于斐波那契脉冲验证自动识别供需区(默认2.6倍扩展) 使用强劲的方向性运动和最小回撤来验证区域 同时跟踪多达50个区域并自动管理区域 可视化区域绘制,可自定义颜色和透明度 入场方法: 检测有效的供需区形成 等待价格完全离开区域 监控价格回调至区域(在接近阈值内) 在较低时间框架上确认突破(默认M5) 执行市价订单,带有计算的止损和止盈 区域失效: 当价格收盘突破区域超过容忍阈值(默认10%)时,区域失效 失效区域显示为灰色并停止生成新信号 自动清理区域以保持图表清晰 高级过滤系统 结构突破(BoS)过
FREE
TouchGuard Alert – Advanced Price Alert & Notification Indicator for MetaTrader 5 (MT5) TouchGuard Alert is a fast, lightweight, and highly accurate price-touch Alert & Notification system designed for MetaTrader 4 (MT4) and MetaTrader 5 (MT5) . It automatically sends real-time Alerts, Pop-Up Alerts, Email Notifications, Push Notifications and early-warning notifications when price touches or approaches your chart objects. Key Features (High-Precision Alert & Notification System) Comprehensive P
Visual Mountain Echo Indicator
AL MOOSAWI ABDULLAH JAFFER BAQER
• Please test the product in the Strategy Tester before purchasing to understand how it works. • If you face any issues, contact me via private message—I’m always available to help. • After purchase, send me a screenshot of your order to receive a   FREE EA   as a gift. Mountain Echo Indicator Your key to uncovering trade opportunities, designed for custom optimization. Price: $65 Key Features: Visual Buy and Sell Signals The indicator places visually appealing arrows directly on your chart: Li
VolatilityScan
Evgeniy Grebenuik
Tired of manually sorting through dozens of currency pairs, cryptocurrencies, or stocks trying to find the current market action? VolatilityScan does it for you – automatically, quickly, and clearly. The indicator scans all instruments from your Market Watch on the selected timeframe and ranks them by average volatility. Only the top most dynamic assets are displayed on the screen, with precise percentage figures. - You set the analysis period (number of candles) and timeframe (M1, M5, H1,
该产品的买家也购买
Entry Points Pro for MT5
Yury Orlov
4.52 (152)
Entry Points Pro 会在您下单之前,告诉您在哪里入场、止损放在哪里、用多大的手数交易。 价格 现在 199 USD,按此价格出售 10 份,之后为 249 USD。最终价格为 349 USD。 我靠交易市场赚钱,并公开展示,所以我不需要把这个指标卖给所有人。它是为独立思考的交易者准备的工具,而不是一个神奇按钮。 没有突破,就没有交易。灰色箭头表示信号已取消:价格没有突破信号K线,因此没有入场,也没有亏损。 箭头在 K 线收盘时出现,并且不会重绘。只有两项设置:您的本金和每笔交易的风险。 付款前先验证:免费演示版可在 MT5 策略测试器中运行,只需两分钟。购买后,我会亲自帮您完成设置。 2019 年,我向全世界展示了这款指标的能力。我按它的信号手动交易,用的是真实账户,全程公开——账户在 Myfxbook 上接受监控,我还在 Facebook 上详细记录了这次实验。结果:10,000 美元在四个月内变成了 941,411 美元。风险是我有意设得极高的——回撤一度达到 54%,因为在我们这一行,利润和风险总是相伴而行。Myfxbook 的截图就是图库中的第一张图片。 看
Boba Analysis Suite
Trade Ready Solutions LLC
5 (2)
Boba Analysis Suite Boba Analysis Suite 是一款适用于 MetaTrader 5 的分析指标。它将市场结构、关键价格区域和整体市场背景整合到同一图表视图中。 该指标源于交易及交易教学的实践经验,旨在帮助用户建立有条理的分析流程:评估市场方向、识别重要价位,并结合多个时间周期进行分析。 结合市场背景进行分析 单个信号的意义取决于市场背景。Boba Analysis Suite 帮助用户将当前图表状况与更大范围的市场结构相结合,并根据预先制定的规则评估交易思路。 分析功能包括: **趋势与市场结构:**评估市场方向及相关结构背景。 **关键价格区域与价位:**在图表上直观标示值得进一步分析的重要区域。 **多时间周期:**整合不同时间周期的信息,评估整体市场背景。 **可视化分析流程:**直接在图表上查看分析信息。 自主做出交易决策 Boba Analysis Suite 适合希望系统分析图表并结合多个时间周期信息的交易者。 该指标用于辅助分析,不会开仓或平仓,也不能替代交易策略或风险管理。每一笔交易的决策均由用户自行做出。 使用与许可 平台:Meta
SQN Max indicator for MT5 by ITC
Renaud Herve Francois Candel
Sqn Max Indicator Sqn Max is an exclusive indicator to trade the market with high effectiveness. The indicator is based on price action, volatility and trend. This indicator is as simple as possible but not too simple. The indicator can generate alerts to ease the trading process. You don't have to stay all day in front of your screen. The indicator can be used with any class of assets and with any time frame. It is possible to achieve better results trading our list of selected assets. We achi
Dynamic Forex28 Navigator MT5
Bernhard Schweigert
5 (1)
多货币强度与动量指标 MT5 Dynamic Forex28 Navigator 是我们长期受欢迎的指标的演进,把五种力量合而为一: Advanced Currency Strength28 Indicator(700 条评价) Advanced Currency IMPULSE with ALERT(530 条评价) Currency Strength EXOTICS GOLD Impulse with Alert CS28 Combo Signals(当前赠品) 无需购买四个指标并把它们堆在图表上。一切都合并在一个强大的指标中:28 个 Forex 货币对的强度、引领它们的市场动量,以及两者的警报——在一个窗口中,在一张图表上。 上述程序在 MQL5 Market 上合计获得超过 1,200 条评价,自 2016 年以来一直是 MT4 社区的一部分。Dynamic Forex28 Navigator MT5 延续同样经过验证的逻辑。 为 MetaTrader 5 完全重建——专为利用 MT5 原生多品种架构而设计。 用户手册: https://www.mql5.com/en/blo
Azimuth Pro
Ottaviano De Cicco
5 (7)
Azimuth Pro V2:MT5合成分形结构分析与确认入场 概述 Azimuth Pro 是 Merkava Labs 推出的多层级波段结构指标。四层嵌套波段层级、锚定波段的VWAP、ABC形态识别、三时间框架结构过滤以及收盘确认入场——一个图表,一个从微观波段到宏观周期的完整工作流程。 这不是盲目的信号产品。它是一个以结构为先的工作流程,专为重视位置、背景和时机的交易者打造。 万圣节促销 — 立减35% 市场愈发诡谲,你的优势依然锐利。立享35%优惠,别让这份好礼消散在迷雾之中。 Azimuth Pro 现价 259 美元(原价 399 美元)。 1. V2的变化 合成多时间框架引擎 高时间框架分析从零开始重建,采用与Meridian Pro相同的专有合成架构。更清晰的HTF背景、稳定的实时行为、无经典MTF同步问题。合成引擎还解锁了 固定比率时间框架级联 (x2、x3、x4、x6)——不再在经纪商的固定时间框架之间任意跳转,您可以按图表时间框架的固定倍数分析结构,在每个尺度上保持相同的分形关系。 确认入场箭头 作为稳定且可恢复的执行层而设计的收盘确认箭头。当ABC设
Neuro Poseidon MT5
Daria Rezueva
4.68 (53)
Neuro Poseidon is a new indicator by Daria Rezueva. It combines precise trading signals with adaptive TP/SL levels - creating best possible trades as a result! Message me and get  Neuro Poseidon Assistant  as a gift to automize your trading process! What makes it stand out? 1. Proven profitability on all assets and timeframes 2. Only confirmed BUY and SELL signals present on the chart 3. Adaptive TP & SL levels generated by the software for each trade 4. Easy to understand - suitable for al
Advance AI Scanner
Mohamed Samsudeen
5 (1)
Advance AI Scanner is a multi-symbol analysis indicator for MetaTrader 5. It scans Forex pairs, metals, energy, stock indices and cryptocurrencies at the same time and rates each instrument with its own self-training model. It explains in plain English what moved each market and why, and it estimates how far upcoming economic news usually moves each symbol, measured on your broker's own price history. $199 instead of $499. 10 copies left at this price. One time purchase  Installation and User
Naked Forex Kangaroo Tail Pro Indicator Kangaroo Tail Pro Indicator is a pattern recognition indicator for Forex, Stocks, Indices, Futures, Commodities and Cryptos. The Kangaroo Tail is a multi-bar pattern. The Kangaroo Tail pattern is very effective and is very simple to trade. The strategy that comes with the Kangaroo Tail is based on price action. The indicator does what it was designed for: displaying Kangaroo Tail patterns.     Don't expect to follow the up and down arrows and make mone
Volatility Master for MetaTrader is a real-time dashboard tool that scans up to  50 symbols  to identify high-volatility , trending markets instantly. With bullish/bearish signals, customizable alerts, and a user-friendly interface, it helps you avoid range-bound conditions and focus on high-probability trades. Clarity leads to confidence. Trade confidently and protect your capital effectively with this powerful dashboard. We don't offer free or bonus indicators in exchange of reviews from you.
FX Sniper Orange indicator for MT5
Renaud Herve Francois Candel
FX Sniper Orange Indicator FX Sniper Orange is an exclusive indicator to spot situations where market has gone too far and market could reverse soon after. The indicator displays arrows in your chart indicating probable future price action (see screenshot attached). FX Sniper Orange never repaints. Once candle is closed signal is confirmed and arrow will never disappear. Users of the indicator can setup alerts when new arrows are displayed in the chart. Inputs of the indicator are: Distanc
ARIPoint
Temirlan Kdyrkhan
1 (4)
ARIPoint is a powerful trading companion designed to generate high-probability entry signals with dynamic TP/SL/DP levels based on volatility. Built-in performance tracking shows win/loss stats, PP1/PP2 hits, and success rates all updated live. Key Features: Buy/Sell signals with adaptive volatility bands Real-time TP/SL/DP levels based on ATR Built-in MA Filter with optional ATR/StdDev volatility Performance stats panel (Success, Profit/Loss, PP1/PP2) Alerts via popup, sound, push, or email Cu
Zain Gold Scalping
Ahmed Gamal Abdel Nasser Mohamed
A complete price-action analysis tool built around dual independent entry logic, each confirmed against a volatility band, combined with a configurable set of nine optional confirmation filters that let you shape exactly how conservative or aggressive the tool's signals behave. Core Strategy Two independent entry setups, each triggering only when price moves outside a dynamic volatility band — giving two distinct ways to spot potential reversal points, which can be used together or separately.
Btmm state engine pro
Garry James Goodchild
5 (4)
BTMM State Engine Pro by G-Labs — Beat The Market Maker indicator for MetaTrader 5. Asian session range, London and New York kill zones, level progression (L1/L2/L3), peak formation detection (PFH/PFL), entry signals, and a multi-pair scanner from one chart for BTMM and Trend Trading traders Stop scanning charts one pair at a time. The State Engine tracks the BTMM daily cycle automatically — Asian box, room boundaries, level blocks, peak formations, and filtered entries — while the scanner das
Orderflow Big Trade 透過估算 Delta 熱力圖,揭示 K 線內部的隱藏壓力 您是否錯過了隱藏在標準 K 線 內部 的關鍵交易活動? Orderflow Big Trade 採用先進的高低價位與收盤價加權算法, 估算不同聚合分組價位上的買賣壓力。 它不單單依賴原始成交量, 而是將價格行為動態轉化為清晰直觀的 Delta 熱力圖——幫助您即時識別機構吸收、 突破動能、 被套牢的交易者以及關鍵價位的接受與拒絕。 [ 免費下載 Demo 試用版 ] 立即在您的實時圖表上測試完整功能。在決定購買之前,您可以自由調整參數、評估視覺清晰度,並體驗它如何完美融入您的交易策略中。 核心交易優勢 棒內 Delta 估算: 解析 K 線的高低價範圍與收盤位置, 推算特定價格聚類區間的買壓與賣壓。 收盤價加權技術: 智能提高靠近 K 線收盤價區域的 Delta 權重, 更準確地反映 K 線尾聲的市場控制力。 動能與吸收偵測: 快速判斷激進的市價單是在推動價格突破, 還是撞上了機構的被動掛單流(吸收)。 動態氣泡視覺化: 透過自訂顏色(藍色代表買
The Oracle Pro
Ottaviano De Cicco
5 (1)
The Oracle Pro:用于 MT5 的合成多周期偏向引擎 万圣节促销 — 立减35% 市场愈发诡谲,你的优势依然锐利。立享35%优惠,别让这份好礼消散在迷雾之中。 The Oracle Pro 现价 194 美元(原价 299 美元)。 The Oracle Pro 是一款面向高要求与专业交易者的 MetaTrader 5 高级多周期 偏向引擎 。它以纪律回答一个问题:当前每个周期的方向偏向是什么、强度如何、各周期之间的一致程度如何?一切仅在已收盘的 K 线上计算——绝不重绘。 The Oracle Pro 是一套多因子共识系统。它将专有指标与优化算法整合为单一而精密的共识向量,并在单个指标实例内,跨当前周期与更高周期的堆栈进行读取——而不是在多个图表上堆叠互不相关的工具。 它是 Oracle 共识方法的专业进化版:完整重建为高级操作控制台,面向希望在一个纪律化工作流中获得深度、多周期背景与背离洞察的交易者。 是偏向引擎,而非信号生成器 The Oracle Pro 明确自身定位。它是一款提供纪律化方向背景的 多周期多因子偏向指标 。它 不是 信号生成器:不承诺入场、出
Precision Spike Detector
Francisco Mandomo Simbine
5 (2)
Precision Spike Detector V3 – Institutional-Grade AI Trading System Attention: The price increases by US$50 for every 10 purchases.  Final price: US$599 Precision Spike Detector V3   is a   state-of-the-art, institutional-grade market analysis system   for   MetaTrader 5 , designed to detect   high-probability market movements   in synthetic indices such as   Boom, Crash, GainX, and PainX . After purchase, send me a private message to receive the optimized configuration files,  the installation

OrderFlow Absorption – 專業級MT5買賣差與吸收訊號指標 釋放真正訂單流分析的力量,OrderFlow Absorption 是MetaTrader 5上最強大的買賣差(Delta)直方圖與吸收訊號指標。專為想看清每一個價格波動背後真相的交易者設計,這個工具揭示了隱藏的買賣壓力與推動市場的吸收事件。 功能特色 買賣差直方圖視覺化:   以清晰的色彩直方圖即時顯示買方與賣方壓力。 吸收訊號偵測:   先進邏輯自動辨識多空吸收事件,及早預警潛在反轉。 圖表標記:   吸收訊號直接標示於主圖表,方便視覺辨識。 彈出式警報:   新吸收訊號出現時即時通知。 自訂門檻:   過濾弱訊號,專注高勝率機會。 資源管理:   高效運算,適用於大型圖表也能流暢運行。 全品種兼容:   適用於任何商品與週期,包括外匯、指數、商品等。 簡易整合:   參數簡單,快速上手與調整。 OrderFlow Absorption 的邏輯說明 OrderFlow Absorption 採用專利演算法,能在沒有完整Tick數據的情況下,估算每根K棒的買賣壓力(Delta)。它分析成交量、價格行為、K
CGE Trading Suite
Carl Gustav Johan Ekstrom
5 (3)
Institutional-Grade Analytics for MT5 The full analytical edge of a professional trading desk, built into your MT5 chart. A full guided tour walks you through every feature step by step. Standard retail platforms lack the depth required for professional market analysis. The CGE Trading Suite bridges this gap, transforming MetaTrader 5 into a comprehensive workspace. By integrating 18 proprietary modules into a single, unified chart interface, the suite eliminates fragmented analysis. It provide
Matreshka
Dimitr Trifonov
5 (2)
Matreshka self-testing and self-optimizing indicator: 1. Is an interpretation of the Elliott Wave Analysis Theory. 2. Based on the principle of the indicator type ZigZag, and the waves are based on the principle of interpretation of the theory of DeMark. 3. Filters waves in length and height. 4. Draws up to six levels of ZigZag at the same time, tracking waves of different orders. 5. Marks Pulsed and Recoil Waves. 6. Draws arrows to open positions 7. Draws three channels. 8. Notes support and re


ICT PO3 (Power of 3) AMD Protocol Framework Indicator True Time & Structure Integration   |  Non-Repainting | Real-Time  | Multi-Asset  | MT4 Version Available Full Setup Guide & Strategy Playbook: https://www.mql5.com/en/blogs/post/768683 The ICT Power of Three (PO3): The Complete Guide to Accumulation, Manipulation, and Distribution https://www.mql5.com/en/blogs/post/771729 MT4 Version: https://www.mql5.com/en/market/product/171742 Indicator Overview The ICT PO3 AMD Protocol Framework i
Ziva LSE System
Hassan Abdullah Hassan Al Balushi
ZIVA LSE System A Professional Liquidity & Structure Execution Framework Executive Overview ZIVA LSE System is a professionally engineered analytical framework designed to interpret market behavior through structural logic and liquidity dynamics. It is not positioned as a conventional indicator. Rather, it functions as a structured execution environment that organizes price action into a clear, disciplined decision-making model. The system is built to deliver consistency, clarity, and controlled
KURAMA GOLD SIGNAL PRO(MT5)— 7层过滤 · 自动止盈止损 · 质量评分 · 信号历史保存 | 完整的XAUUSD交易系统 需要自动下单?另有MT5 EA版本 Gold Signal Pro EA with Auto TP SL是单独销售的MT5 EA,为GOLD M5/M15组合内置Gold Signal Pro引擎、信号筛选、自动下单、自动TP/SL与风险设置。可选择信号查看或自动执行。EA可独立运行,不包含在本指标购买中,也不能在MT4运行。 查看EA功能、面板和价格 实时不重绘。信号出现的瞬间,箭头、入场、止盈、止损当场锁定,之后绝不移动。你交易的就是这个实时信号。而且在v7.20中,每一个真正发出的信号都会自动保存,并在重启后精确还原。 购买者专属赠品 购买永久授权,即可免费获得 AI Zone Radar(价值$59)+ 完整PDF手册。在产品价格之外,额外附赠价值$59的赠品。购买后在MQL5上给我留言即可。 AI Zone Radar: https://www.mql5.
FX Analysis
Lee Teik Hong
FX Analysis is an all-in-one MT5 indicator dashboard that combines eight analytical tools in a single panel, helping traders identify high-probability setups without switching between charts or indicators. Designed for standard forex pairs on MetaTrader 5. Best results on M15 - H4 timeframes when all components are used together as part of the included workflow. Special discount price : NEXT 2 0 COPIES ONLY! Get instant access now for just $ 19 9  — once the next 2 0 copies are sold, the price
FootPrint Chart MT5
Gayathiri Gopalakrishnan
5 (1)
Turn every candle into a bid x ask footprint built from real tick data. See who is actually trading at each price, with delta, volume profile, imbalance zones and a scored setup engine that prints entry, stop and target Order Flow Footprint Chart Pro Most indicators tell you what price did. This one tells you who did it. Order Flow Footprint Chart Pro rebuilds every candle on your chart from raw tick data and shows you the volume that traded at each individual price inside it, split into the am
Naked Forex Big Shadow indicator for MT5
Renaud Herve Francois Candel
5 (1)
Naked Forex Big Shadow Indicator Big Shadow Indicator is a pattern recognition indicator for Forex, Stocks, Indices, Futures, Commodities and Cryptos. When you have a Big Shadow on your chart then this is a strong signal meaning that you might be ahead of a reversal. You can take other elements (momentum, trend, volatility, price action, fundamentals) to build a complete strategy and confirm your entries. Beware that you might not make money just following the arrows generated by the pattern re
Trend Master V2
Oratile Pitsoane
What Is Trend Master Pro? Trend Master Pro   is a professional-grade trend trading indicator built for MetaTrader 5. It was designed with one goal in mind — to keep you on the right side of the market at all times by combining three powerful technical tools into a single, clean, easy-to-read display directly on your price chart. Instead of cluttering your screen with multiple separate indicators, Trend Master Pro fuses an   EMA Ribbon trend filter , a   ZigZag swing point engine , and a   breako
Gem SIGNAL
Shengzu Zhong
5 (1)
GEM Signal Pro GEM Signal Pro 是一款適用於 MetaTrader 5 的趨勢跟隨指標,專為希望在圖表上獲得更清晰訊號、更有結構的交易設定,以及更實用風險管理的交易者而設計。 它不僅僅顯示一個簡單的箭頭,GEM Signal Pro 還能以更清晰、更易讀的方式呈現完整的交易思路。當條件確認完成後,指標可在圖表上顯示進場價、止損價與止盈目標,幫助交易者更有效率地評估交易設定。 運作方式 該指標首先根據其內部邏輯識別有效的初始訊號。 當確認條件滿足後,GEM Signal Pro 會在圖表上顯示完整的交易設定。這讓交易者可以更清楚地看到交易結構,並減少手動分析與計算的工作量。 圖表上的交易價位 對於已確認的訊號,GEM Signal Pro 可顯示: 進場價 止損價 止盈 1 止盈 2 止盈 3 風險報酬比 這讓交易設定更容易理解,也有助於讓圖表分析更有條理。 內建風險管理 風險管理是此指標設計的重要部分。 止損位基於近期市場結構,結合附近的擺動高低點與可選的 ATR 緩衝距離。這能讓交易價位更貼近當前市場條件,而不只是依賴固定距離。 圖表資訊面板 GEM Si
CRT Scanner MTF
Jessica Victoria Huera Rodriguez
CRT Scanner MTF is a specialized indicator for traders who use the CRT — Candle Range Theory strategy. Its main purpose is to scan multiple timeframes in order to detect Mother Candles, R candles and active CRT ranges , helping traders identify which structures are currently active and which ones are aligned across different timeframes. The indicator can scan up to 9 configurable timeframes at the same time. On each selected timeframe, it searches for relevant CRT ranges and identifies four main
VTrende Pro
Andrii Diachenko
5 (1)
VTrende Pro - MTF indicator for trend trading with a display panel for MT5 *** Videos can be translated into any language using subtitles (video language - Russian) Although the signals of the VTrende Pro indicator can be used as signals of a full-fledged trading system, it is recommended to use them in conjunction with the Bill Williams TS. VTrende Pro is an extended version of the VTrende indicator. Difference between Pro version and VTrende: - Time zones - Signal V - signal 1-2 waves -    S
QNC Scalper
Yordiana Enggelina Seko
Here is a professional and engaging description for the Indikator QNC Scalper tool in English, tailored for traders and platforms: Indikator QNC Scalper Unlock precision trading in fast-paced markets with the Indikator QNC Scalper —an advanced technical analysis tool engineered specifically for scalpers and day traders. Whether you are trading forex, crypto, or indices, this indicator cuts through market noise to deliver clear, high-probability entry and exit signals. Key Features Real-Time M
作者的更多信息
KT Support and Resistance Levels MT5
KEENBASE SOFTWARE SOLUTIONS
5 (1)
KT Auto Support Resistance Levels:适用于 MetaTrader 4/5 的多周期支撑阻力、智能区域与水平仪表盘 摆动高点、Pivot 枢轴点、订单块、前期高低点。每个交易者标记市场的方式都不太一样,最后承受代价的往往是图表本身。把太多方法堆在同一张图上,它就不再是一张清晰的地图,而会变成噪音。 KT Auto Support Resistance Levels 正是为了解决这个问题而设计。它会同时扫描月线、周线、日线以及当前周期,然后自动把真正重要的水平直接绘制到您的 MetaTrader 图表上。当图表开始变得拥挤时,只需点击一次,就可以把这些水平合并成干净的 Smart Zones。实时面板还会持续显示价格上方和下方最近的水平,让您不必在图表上来回寻找。 可以把它看作一位永远不会疲惫的图表分析师,始终帮您标记关键位置。 它能为您做什么 从多个经过验证的来源寻找并绘制水平:摆动点、Pivot 枢轴点、前期价格以及订单块中点,覆盖多个时间周期。 当您想要更简洁的图表时,可以把彼此接近的水平合并成清晰的 Smart Zones。 保持一个实时面板,显示
KT Stoch Divergence MT4
KEENBASE SOFTWARE SOLUTIONS
如果你见过价格创出新高,但随机指标没有同步确认,那么你已经明白为什么交易者会关注背离。KT Stoch Divergence 会把这种价格与指标之间的不一致直接标记在图表上,帮助你发现潜在反转和趋势延续机会,无需手动画出每一条背离线。 该指标识别价格与随机指标之间的常规背离和隐藏背离。它提供的是交易背景,而不是自动下单信号。你仍然需要根据自己的图表判断这个机会是否合理。 交易者如何使用 当价格接近支撑位且卖压可能减弱时,关注常规看涨背离。 当价格接近阻力位且买盘力量可能减弱时,关注常规看跌背离。 利用隐藏背离寻找可能顺着当前趋势继续运行的回调机会。 把背离作为入场过滤条件、离场参考,或自己交易策略的额外确认。 主要功能 标记常规和隐藏的看涨与看跌背离。 适用于反转和趋势延续分析。 过滤不对称背离,让图表更清晰。 包含 MetaTrader 提供的预警方式。 可辅助入场和离场决策。 Expert Advisor 可以读取指标数据,用于自动化策略。 如何理解信号 常规看涨背离: 价格形成更低的低点,而随机指标形成更高的低点。 常规看跌背离: 价格形成更高的高点,而随机指标形成更低的高点。
ACB Breakout Arrows
KEENBASE SOFTWARE SOLUTIONS
4.15 (34)
结合交易环境的突破信号 ACB Breakout Arrows 识别价格进入平稳阶段后出现的方向性突破,并用买入或卖出箭头标记该形态。箭头代表检测到的突破形态,并不保证每个信号都会发展成大幅行情。 买入箭头表示看涨突破形态,卖出箭头表示看跌突破形态。价格可能回测突破区域,也可能重新回到原有区间,因此入场前应检查周围的市场结构、趋势方向以及附近的支撑或阻力。 在图表上规划交易 指标可以围绕每个信号绘制实用的参考价位: Stop Loss: 根据所选 K 线数量计算的保护价位。 Quick Profit: 较近的目标,可用于提前离场、部分止盈或决定是否移动到保本位置。 Take Profit: 为选择继续持有突破行情的交易者提供更远的目标价位。 这些价位有助于建立一致的交易计划,但仓位大小和最终的交易管理仍由交易者负责。 确认突破 多周期面板可帮助您比较不同可用图表周期上的突破信号。如需更多背景信息,可以使用 ACB Trade Filter 检查市场情绪和趋势方向。绿色配合看涨趋势支持多头形态,红色配合看跌趋势支持空头形态,灰色配合横盘趋势则表示市场条件混合。 您还可以检查买入信号是否直
ACB Trade Filter MT4
KEENBASE SOFTWARE SOLUTIONS
5 (1)
在下单之前,ACB Trade Filter 可以帮助你回答一个实际问题:当前市场是否支持这笔交易,还是你正在混乱的条件下勉强接受一个信号? 该指标分析市场情绪和趋势,然后通过彩色柱状图与趋势方向显示结果。请在正常进场信号出现后使用它,而不是用它代替进场系统。 一眼看懂三种市场状态 绿色柱状图并且趋势看涨: 当前条件支持按照你的策略寻找做多机会。 红色柱状图并且趋势看跌: 当前条件支持按照你的策略寻找做空机会。 灰色柱状图或横盘趋势: 方向不明确,因此更适合放弃这次机会。 它在交易策略中的位置 当你的进场指标产生信号时,可以先检查 ACB Trade Filter 再决定是否行动。如果柱状图和趋势与交易方向一致,就继续进行正常分析。如果两者与信号冲突,你就有明确的理由暂停,而不是接受每一个信号。 它可以自然地配合 ACB Breakout Arrows,但并不局限于这一款指标。你也可以将它用于动量交易、回调进场、突破方法,或者任何需要第二个市场方向判断的手动策略。 它的目的不是制造更多交易,而是帮助你减少质量较低的决定,避免逆着整体方向进场,并在震荡行情中保持选择性。 选择适合你的过滤
KT Momentum Arrows
KEENBASE SOFTWARE SOLUTIONS
KT Momentum Arrows 会在K线收于自适应价格带之外时,用箭头标出看涨或看跌的动量突破。 价格带会随价格偏离程度和波动率变化而调整。蓝色向上箭头确认收盘价突破上轨,红色向下箭头确认收盘价跌破下轨。信号在K线收盘后固定,因此以后复盘时箭头不会移到其他K线上。 箭头告诉你什么 箭头标出动量推动价格越过价格带的那根K线。你可以把它作为入场触发信号,也可以结合自己的趋势、支撑阻力或价格行为方法进行确认。价格带会继续显示在价格周围,方便判断突破是在延续,还是后续动能正在减弱。 在同一张图表上比较信号 可选的表现统计面板会汇总所选历史范围内出现的箭头,并显示信号总数、成功与失败次数、成功率以及平均点数波动。结果线还可以连接各个信号之间测量到的行情变化。这个视图最适合在相同图表条件下,对同一品种和周期的不同设置进行比较。 影响结果的关键设置 历史K线数量: 决定参与计算和表现统计的图表历史范围。 幅度系数: 调整价格带偏离程度与波动率的组合方式。请根据实际交易的品种和周期进行测试。 表现分析: 显示或隐藏统计数据,并可分别设置结果线的颜色、宽度和样式。 提醒: 可为新的已确认信号启用声
KT COG Advanced MT4
KEENBASE SOFTWARE SOLUTIONS
1 (1)
KT COG is an advanced implementation of the center of gravity indicator presented by John F. Ehlers in the May 2002 edition of Technical Analysis of Stocks & Commodities magazine. It's a leading indicator which can be used to identify the potential reversal points with the minimum lag. The COG oscillator catches the price swings quite effectively. MT5 version of the same indicator is available here KT COG Advanced MT5 Calculation of COG The COG indicator is consist of the two lines. The main l
KT Pin Bar
KEENBASE SOFTWARE SOLUTIONS
KT Pin Bar identifies the pin bar formation which is a type of price action pattern which depicts a sign of reversal or rejection of the trend. When combined with support and resistance, BRN and other significant levels, Pin Bar pattern proved to be a very strong sign of reversal. Basically, a pin bar is characterized by a small body relative to the bar length which is closed either in upper or lower 50% part of its length. They have very large wicks and small candle body. A pin bar candlestic
KT Trend Magic
KEENBASE SOFTWARE SOLUTIONS
直接在图表上读取趋势方向 KT Trend Magic 将动量与波动率结合为一条跟随价格的彩色趋势线。趋势线持续显示当前趋势状态,并在计算方向发生变化时切换颜色。 绿色趋势线: 表示看涨趋势状态。 红色趋势线: 表示看跌趋势状态。 颜色变化: 标记图表上新的方向转换。 在持续走势中,趋势线也可作为观察回调和延续的动态图表参考。可将每次方向转换与当前价格走势及您自己的入场规则进行比较。 比较九个时间周期的信号 多时间周期扫描器显示 M1、M5、M15、M30、H1、H4、D1、W1 和 MN1 的看涨或看跌 Trend Magic 读数。无需为每个周期分别打开图表,即可比较当前图表与更短及更长时间周期的方向。 利用扫描器可以查看多个时间周期是否指向同一方向,或者当前图表是否正在逆着更广泛的趋势背景运行。图表趋势线提供详细的局部视图,扫描器则提供更广泛的方向比较。 调整趋势响应 Trend Period 控制用于评估方向和动量的计算窗口。Smoothing Coefficient 控制趋势线过滤短期噪声的程度。将两项设置结合调整,可选择适合交易品种、时间周期和图表风格的响应速度。 Hist
KT Auto Fibo
KEENBASE SOFTWARE SOLUTIONS
Auto Fibonacci indicator that draws the Fibonacci retracement on the swing you are looking at, and redraws it the moment you zoom or scroll the chart. Zoom in on a pullback and the levels measure that pullback. Zoom out and they measure the whole trend. There are no anchor points to drag and no levels to redraw after every new high. Key features Measures the highest high and the lowest low on your screen, the current candle included. Follows zoom, scroll and window size at once, even when the ma
KT Psar Arrows
KEENBASE SOFTWARE SOLUTIONS
KT Psar Arrows使用标准的抛物线转向指标(Parabolic SAR)在图表上绘制箭头。当蜡烛的最高点触及SAR时绘制看涨箭头;当蜡烛的最低点触及SAR时绘制看跌箭头。信号在实时生成,无需等待K线收盘。  特点 对于想要基于抛物线SAR指标开发交易策略的交易者来说,这是一个非常有用的工具。  可以用于寻找市场中的转折点。 支持自定义PSAR参数输入。 提供所有MT4的提醒功能。 注意事项:抛物线SAR是一个滞后且严格机械化的指标。每一笔潜在交易都应该通过明确定义的规则进行筛选。     输入参数 PSAR步长:输入步长值。 PSAR最大值:输入最大值。 显示PSAR点:显示/隐藏PSAR点。即使不显示PSAR点,箭头功能也能正常工作。 其余输入项均为直观设置,无需特别说明。
KT Ichimoku Trader
KEENBASE SOFTWARE SOLUTIONS
1 (1)
五种一目均衡表策略,全自动交易 KT Ichimoku Trader 是一款 Expert Advisor(智能交易系统),使用五种经典的 Ichimoku Kinko Hyo(一目均衡表)策略自动开仓和平仓。您开启想要的策略,每种策略都独立交易:有自己的入场规则、自己的出场规则,并且每种策略同一时间最多只有一笔持仓。 每次入场都在已收盘的K线上检查。新K线开盘时,EA 读取刚刚收盘的那根K线,只有当该策略的所有入场规则都满足、并且您开启的所有过滤器都同意时,才会开仓。只要缺少一条规则,就不会开仓,即使图表看起来已经接近信号。 每种策略何时开仓和平仓 Tenkan-Kijun Cross。 当 Tenkan-sen(转换线)向上穿过 Kijun-sen(基准线)时买入,反向交叉时卖出。在 Advanced 模式下,买入还需要交叉发生在 Kumo 云层上方、未来云层为看涨,并且 Chikou Span(延迟线)位于过去价格之上;卖出则需要相反的条件。当 Tenkan-sen 反向穿回 Kijun-sen 时平仓。 Kumo Cloud Breakout。 当前一根K线仍位于云层顶部下方,
KT Volatility Oscillator
KEENBASE SOFTWARE SOLUTIONS
KT波动率振荡器通过数学公式分析过去和当前的市场数据,以振荡器的形式显示结果。振荡器中波浪的增长和减弱分别对应于资产的高波动性和低波动性。  简单来说,波动率就是衡量资产在一定时间内价格波动幅度的指标。没有波动性,市场上的价格变化将非常有限,交易者也将难以从价格波动中获利。 外汇市场中波动率的应用 在外汇市场中利用波动率,可以帮助你更有效地进行交易,同时让你的预期更加符合实际情况。  高波动性 基于趋势的交易系统在高波动市场中表现出色,因为价格波动幅度大,趋势持续时间长,直到出现趋势反转。 如果突破发生在高波动期间,突破系统可以从市场中获得更多的点数收益。 低波动性 均值回归系统在低波动性环境下表现良好,因为市场有回归均值的特性。 基于通道的系统在市场盘整期,即低波动阶段,能够更加有效地发挥作用。 非方向性指标 KT波动率振荡器是一种非方向性指标,不与市场的牛市或熊市趋势直接相关。波动性的上升可能出现在牛市或熊市两种情形下。  输入参数 波动率周期:   一个整数值,用于设定计算的周期。 文本信息:   在图表上显示或隐藏信息文本。 ----- 警报设置 ----- 声音警报
KT COG Robot
KEENBASE SOFTWARE SOLUTIONS
KT COG Robot is a fully automated Expert Advisor based on the KT COG Indicator . The COG indicator was originally presented by John F. Ehlers in the May 2002 edition of Technical Analysis of Stocks & Commodities magazine. The EA fires a long trade when COG line cross above the signal line and a short trade is fired when the COG line cross below the signal line.  Adaptive Filtration Our adaptive filtration algorithm combines the original COG formula with the major trend direction and market acce
ACB Breakout Arrows EA
KEENBASE SOFTWARE SOLUTIONS
自动执行 ACB 突破交易流程 ACB Breakout Arrows EA 会分析当前图表上的突破信号,并通过内置的 ACB Breakout Arrows 和 ACB Trade Filter 逻辑管理交易。将 EA 加载到需要监控的品种和时间周期图表,启用自动交易,然后根据测试计划设置仓位、交易时段、筛选器和退出规则。 所需指标和依赖项已经嵌入 EA,无需另行下载。这些指标面板不会显示在图表上。EA 会显示自己的交易操作,并在启用 Logging 后把运行信息记录到平台 Journal 中。 在开仓前确认入场条件 Signal Sensitivity 控制突破需要达到的强度,只有满足条件时箭头逻辑才会接受信号。Bars for SL 控制在止损方法使用指标价位时所参考的 K 线数量。 启用 ACB Trade Filter 后,EA 可以要求箭头、柱状图和趋势状态保持一致: 买入确认: 向上箭头、绿色柱状图和看涨趋势。 卖出确认: 向下箭头、红色柱状图和看跌趋势。 混合状态: 灰色柱状图和横盘趋势会阻止新的入场。 控制仓位大小和退出方式 仓位大小: 选择固定手数,或根据 Risk
KT Asian Breakout
KEENBASE SOFTWARE SOLUTIONS
4 (1)
KT Asian Breakout carefully analyzes the range-bound market during the Asian session and then fires a long or short trade after doing some preassessment based on its inbuilt technical analysis module. The executed orders are closed within a day before the completion of the next day session. The inbuilt technical analysis module checks for the session range and compares it with the last 20 days price movement. If it finds any erratic price movement within the session, the orders are not executed
KT London Breakout
KEENBASE SOFTWARE SOLUTIONS
First thirty minutes are essential for a trading session. The early reaction of traders and market players sets a path for the rest of the day. KT London Breakout EA takes advantage of this phenomenon, and after analyzing the first thirty minutes of London session, it places two bidirectional pending orders. One of pending order is eventually canceled after realizing the market direction with certainty. It has been strictly tested and developed for EUR/JPY using 30-Min Time Frame. You can expe
KT Support and Resistance Levels
KEENBASE SOFTWARE SOLUTIONS
KT Auto Support Resistance Levels:适用于 MetaTrader 4/5 的多周期支撑阻力、智能区域与水平仪表盘 摆动高点、Pivot 枢轴点、订单块、前期高低点。每个交易者标记市场的方式都不太一样,最后承受代价的往往是图表本身。把太多方法堆在同一张图上,它就不再是一张清晰的地图,而会变成噪音。 KT Auto Support Resistance Levels 正是为了解决这个问题而设计。它会同时扫描月线、周线、日线以及当前周期,然后自动把真正重要的水平直接绘制到您的 MetaTrader 图表上。当图表开始变得拥挤时,只需点击一次,就可以把这些水平合并成干净的 Smart Zones。实时面板还会持续显示价格上方和下方最近的水平,让您不必在图表上来回寻找。 可以把它看作一位永远不会疲惫的图表分析师,始终帮您标记关键位置。 它能为您做什么 从多个经过验证的来源寻找并绘制水平:摆动点、Pivot 枢轴点、前期价格以及订单块中点,覆盖多个时间周期。 当您想要更简洁的图表时,可以把彼此接近的水平合并成清晰的 Smart Zones。 保持一个实时面板,显示
Currency strength and pair correlation in one indicator KT Currency Strength and Correlation ranks the eight major currencies from strongest to weakest and shows, in a colored matrix, how closely ten currency pairs of your choice move together. Before you open a trade from your own strategy, you can check whether the two currencies of the pair are really moving apart, and whether the new trade adds risk to a trade you already hold. What you see on the chart Strength lines: a separate window belo
MACD Divergence Seeker
KEENBASE SOFTWARE SOLUTIONS
KT MACD Divergence Seeker trades the regular and hidden divergence signals generated by our free indicator named KT MACD Divergence indicator. Trading the standalone divergences can be a risky affair that's why the KT MACD Divergence Seeker combines the standard divergence signals with an advanced analysis module to exploit the price inefficiencies on some FX pairs. What is the Divergence exactly? As a general conception if the price is making higher highs, then macd should also be making hig
KT Asian Breakout Indicator
KEENBASE SOFTWARE SOLUTIONS
标记亚洲时段区间 KT Asian Breakout Indicator 标记四小时亚洲交易时段窗口的最高价和最低价,并在区间完成后继续监测价格。GMT Offset 用于使时段与经纪商服务器时间保持一致,Draw Session Box 用于控制是否在图表上显示该区间。 同时查看突破与交易水平 当价格收盘于时段最高价上方时,指标显示看涨箭头。当价格收盘于时段最低价下方时,指标显示看跌箭头。启用 Draw Stoploss and Profit Targets 后,图表会添加入场线、位于区间另一侧的 Stop Loss,以及三个计算得出的目标水平。 看涨突破: 使用时段最低价作为保护水平。 看跌突破: 使用时段最高价作为保护水平。 目标 1、2 和 3: 根据区间大小和当前波动率提供分阶段参考水平。 突破状态: 识别突破蜡烛相对于时段区间明显偏大的情况。 查看历史信号表现 Performance Analysis 分析已加载图表中的已完成信号,并可显示 Total Signals、Win/Loss、Success Rate、以点数表示的 Average Profit,以及当前突破状态。
MACD Divergence MT4
KEENBASE SOFTWARE SOLUTIONS
KT MACD 背离指标显示价格与振荡器之间的常规背离和隐藏背离。如果你的交易策略是基于趋势反转,可以使用 MACD 的常规背离来捕捉潜在的转折点。而如果你的策略是基于趋势延续,MACD 的隐藏背离将是一个不错的选择。 KT MACD 背离的局限性 将 MACD 背离作为单独的入场信号可能存在一定风险。并非所有的背离都能解释为反转信号。为了获得更好的效果,建议将其与价格行为分析和其他交易方法结合使用。 功能特点 标记价格与振荡器之间的常规和隐藏背离。 为提高准确率并减少图表杂乱,会自动忽略不对称的背离。 支持趋势反转和趋势延续两种交易策略。 完全支持嵌入到智能交易系统中使用。 可用于入场信号和出场信号。 支持所有 MetaTrader 警报功能。 什么是背离? 一般来说,如果价格创出更高高点,那么振荡器也应创出更高高点;如果价格创出更低低点,那么振荡器也应同步走低。当这种正常的行为没有出现时,就表示价格和振荡器之间出现了背离。背离主要分为两种类型: 常规背离 常规看涨背离:当价格创出更低低点,但振荡器却创出更高低点。 常规看跌背离:当价格创出更高高点,但振荡器却创出更低高点。
KT Bollinger Bands Trader MT4
KEENBASE SOFTWARE SOLUTIONS
KT Bollinger Bands Trader 是一款 100% 自动化的智能交易顾问(EA),基于布林带在低波动时期的均值回归交易策略构建。价格经常在布林带的上轨或下轨附近产生反应,但并非每次都会发生反转。然而,在低波动期间,价格反转的可能性更高。 入场规则 当价格正确下穿布林带下轨时,开启买入交易。 当价格正确上破布林带上轨时,开启卖出交易。 出场规则 在低波动阶段结束时自动平仓。 也可在达到止损或止盈时平仓。 本 EA 在经典布林带策略基础上进行了诸多改进,允许用户通过内置的趋势过滤器、波动率过滤器、Vortex、MMI 和星期过滤器等工具,对策略进行细致调节。 输入参数 ----- 策略设置 ----- 布林带周期、带移位、带偏差 开始时间(Start Hour) 结束时间(End Hour) GMT 时区偏移(GMT offset) ----- 交易设置 ----- 手数类型:固定手数 | 自动手数 每单风险百分比(Risk Per Trade) ----- 出场设置 ----- 止损方式:无止损 | 基于波动率 | 固定点数 止盈方式:无止盈 | 基于波动率 |
KT CCI Divergence MT4
KEENBASE SOFTWARE SOLUTIONS
KT CCI Divergence shows the regular and hidden divergence created between the price and CCI oscillator. Divergence is one of the vital signals that depicts the upcoming price reversal in the market. Manually spotting the divergence between price and CCI can be a hectic and ambiguous task. Limitations of KT CCI Divergence   Using the CCI divergence as a standalone entry signal can be risky. Every divergence can't be interpreted as a strong reversal signal. For better results, try to combine it w
KT Heiken Ashi Smoothed MT4
KEENBASE SOFTWARE SOLUTIONS
跟踪平滑 Heiken Ashi 状态 KT Heiken Ashi Smoothed 将价格走势显示为平滑的蓝色和红色蜡烛。当状态从看跌转为看涨时,它会绘制蓝色向上箭头;当状态从看涨转为看跌时,它会绘制红色向下箭头,让图表上的方向转换清晰可见。 平滑周期和平滑方法决定蜡烛的平滑程度。与标准 Heiken Ashi 相比,它提供更稳定的走势视图,同时可根据图表选择合适的响应速度。 蓝色蜡烛: 表示看涨状态。 红色蜡烛: 表示看跌状态。 蓝色向上箭头: 标记从看跌转为看涨。 红色向下箭头: 标记从看涨转为看跌。 一眼比较多个时间周期 紧凑的 MTF Scanner 显示从 M1 到 Monthly 各时间周期的看涨或看跌状态。无需切换图表,即可将当前图表与更短和更长的时间周期进行比较。 解读蜡烛形态并调整显示 没有下影线的蓝色蜡烛 可能伴随强劲的看涨走势,而 没有上影线的红色蜡烛 可能伴随强劲的看跌走势。带有上下影线的小实体蜡烛可能出现在方向变化时。 您可以调整平滑周期和平滑方法,也可以设置看涨和看跌箭头的颜色、大小及符号代码,使其符合您的图表布局。 在方向变化时接收提醒 可选择适合您工
KT MA Crossover MT4
KEENBASE SOFTWARE SOLUTIONS
KT MA Crossover 指标根据所选的移动平均线交叉绘制买入和卖出箭头。此外,它还会生成相应的提醒通知,并为每个连续信号显示 MFE(最大有利偏移)值,帮助交易者更好地了解潜在利润区域。 移动平均交叉策略是全球交易者广泛采用的一种经典技术分析方法。通常包含一条快速和一条慢速的移动平均线,根据交叉的方向来确定买入或卖出的交易信号。 买入信号 - 快速均线向上穿越慢速均线。 卖出信号 - 快速均线向下穿越慢速均线。 功能特点 每项均线参数都可完全自定义设置。 每个连续信号都会显示对应的 MFE 值。 代码轻量,占用系统资源极少。 包含所有 MetaTrader 系统提示和警报。 缺点  移动平均线是一种滞后性指标,主要依赖历史数据。在盘整行情中,均线交叉信号可能显得较为随机,容易产生假信号。因此,交易者在实际应用中需要根据自身判断灵活处理这些信号。 输入参数 历史K线数量:  用于计算信号的历史K线数量。 ----- 选择用于计算快慢移动平均的周期和方法 ----- 显示均线:  在图表上显示或隐藏移动平均线(不影响交叉信号)。 绘制利润线: 显示或隐藏 MFE 曲线。 
KT Round Numbers MT4
KEENBASE SOFTWARE SOLUTIONS
KT Round Numbers plots the round number levels which are also commonly known as psychological levels in the Forex world. In the context of Forex trading, round number levels are those levels in which there are two or more zeroes at the end. They are named as 00 levels on the chart. Some traders also consider the halfway points as a valid round number level. They are named as 50 levels on the chart. Use of round number levels in trading Round number levels work as strong support and resistance
KT Inside Bar Advanced MT4
KEENBASE SOFTWARE SOLUTIONS
Despite the popularity of inside bar pattern among the traders, using it as a standalone signal doesn't provide any edge in the market. KT Inside Bar Advanced indicator solves this problem by combining the classic inside bar pattern with the "ECE" cycle and Fibonacci extensions. Using this indicator in place of our classic inside bar indicator will provide a tremendous advantage and edge in the market. What is the ECE cycle? In financial markets, the price never moves in a straight line but u
KT Inside Bar Hunter MT4
KEENBASE SOFTWARE SOLUTIONS
Despite the popularity of inside bar pattern among traders, using it as a standalone entry signal doesn't provide any evidentiary advantage. KT Inside Bar Hunter trades only selected inside bar patterns using some preassessment and ECE price action cycle. Trading Strategy On successful detection of the required pattern, EA places a pending order in the direction of the forecasted price expansion phase. Pending orders are canceled if they are not triggered within the next bar. Once triggered, ac
KT CCI Surfer MT4
KEENBASE SOFTWARE SOLUTIONS
KT CCI Surfer uses a mean reversion trading strategy with a combination of extreme overbought/oversold zone detection using the Commodity Channel Index (CCI). Developed by Donald Lambert in 1980, CCI is a leading indicator that helps to identify the overbought/oversold region in the market without any lag. Obviously, not every overbought/oversold signal turns out into a price reversal. However, when combined with a well-planned mean reversion strategy, it produces excellent results. Recommend
KT RSI Divergence Robot MT4
KEENBASE SOFTWARE SOLUTIONS
交易已确认的 RSI 背离 KT RSI Divergence Robot 监控当前图表品种和周期中价格与相对强弱指数之间的常规背离和隐藏背离。程序在一根 K 线完成后评估新信号。看涨背离可以触发买入持仓,看跌背离可以触发卖出持仓。出现反向信号时,EA 可以先关闭相反方向的持仓,再评估新的入场机会。 选择入场条件 您可以在不改变核心背离逻辑的情况下调整策略: Regular Divergence 和 Hidden Divergence: 启用一种信号,或同时使用两种信号。 Overbought 和 Oversold 限制: 要求背离在您设定的 RSI 水平之外形成。 Trading Session 和 Day Filter: 只允许在选定的 GMT 交易时段和工作日建立新仓位。 Trend、Volatility、Vortex 和 MMI 过滤器: 在信号开仓前加入可选确认条件。 控制仓位大小和出场 Max Active Positions 限制 EA 在同一方向可持有的仓位数量。仓位大小可使用固定手数,或根据 Risk Per Trade 自动计算。Stop Loss、Take Pro
筛选:
无评论
回复评论