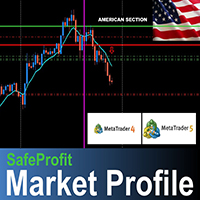
Market Volume Profile MT4

Market Volume Profile

Volume Profile by Trading Session — Visualize where price spent its time and where the smart money traded, automatically segmented by Sydney, Tokyo, London, or New York sessions.

What is Market Volume Profile?

Market Volume Profile (MVP) is a professional-grade Volume Profile indicator built for traders who think in sessions, not just candles. While most volume tools show you a single profile across an arbitrary range, MVP automatically segments your chart by the four major Forex sessions and gives you a complete profile for each one — including historical lookback.

This is the tool you reach for when you need to answer:

  • Where did the smart money trade during London?
  • Is New York attacking yesterday's value area, or accepting it?
  • Has Tokyo been balanced (D-Shape) or trending (P/b-Shape) all week?
  • Where are the high-volume nodes that price will respect tomorrow?

MVP draws clean, professional Volume Profile boxes for every recent session, complete with POC (Point of Control), Value Area High/Low, a directional histogram showing buy/sell pressure, and an automatic bias label that classifies each session as bullish, bearish, or neutral.

Key Features

Session Auto-Detection

  • Choose from Sydney, Tokyo, London, New York, or Manual mode
  • Session times automatically adjust for Daylight Saving Time using the US DST rule (2nd Sunday March → 1st Sunday November)
  • Works with any broker — set the Server_UTC offset once and forget about it

Volume Profile Algorithm

  • POC (Point of Control) — the price level with the highest traded volume
  • VAH / VAL (Value Area High/Low) — the price band containing the user-defined percentage of total volume (default 70%, the CME standard)
  • Value Area expansion uses the CME 2-bucket sum rule for institutional-grade accuracy

Directional Histogram (3 Display Modes)

  • Joined — Buy volume on the left, Sell volume on the right of a center divider
  • Overlay — Dominant side behind, minority side overlaid on top
  • Stacked — Dominant side first, minority side stacked next to it
  • Color-coded by Buy/Sell pressure derived from each bar's close position

Profile Shape Classifier

  • P-Shape (Bullish) — POC sits above the session midpoint, indicating buyers in control
  • b-Shape (Bearish) — POC sits below the midpoint, sellers dominant
  • D-Shape (Neutral) — balanced distribution, classic sideways behavior

Historical Session Lookback

  • Configure how many days of past sessions to display (default 5)
  • Each historical session gets its own complete profile, labeled with date and session name
  • Compare today's auction to recent context at a glance

Manual Mode

  • Draw your own custom box on any range
  • MVP automatically calculates the full profile inside your box
  • Drag the box to reposition — profile updates in real-time

Professional Visualization

  • Session label at the top-left of each box
  • Date label above the histogram
  • POC/VAH/VAL labels with exact price values
  • Optional Value Area shaded fill
  • Bias and shape labels below each session

Why Traders Choose Market Volume Profile

For Day Traders — Know exactly where London left off when New York opens. Trade reactions to yesterday's POC, fades at VAH/VAL, and breakouts from balanced D-Shape sessions.

For Swing Traders — Identify multi-day high-volume nodes (HVN) and low-volume nodes (LVN) that act as support and resistance for days or weeks.

For Algorithmic Traders — The POC, VAH, and VAL values are exposed as indicator buffers in Manual mode, ready to be consumed by an EA via iCustom() .

For Market Structure Traders — Combine MVP with order block, supply/demand, or auction market theory frameworks. The P/b/D-Shape classifier alone replaces 30 minutes of manual structure analysis.

How to Use

1. Pick a session and watch it for a few days

Set Session = SESSION_LONDON and Look_Back_Days = 7 . You'll see seven London profiles back-to-back. Notice patterns: Is the POC consistently rising? London has been in distribution. Is the VA narrowing? Volatility is contracting — a breakout is coming.

2. Trade reactions at the POC

When New York opens, mark the London POC. Price often returns to test it. A clean rejection at the POC with the histogram showing strong opposite-direction volume is a high-probability fade signal.

3. Use VAH and VAL as inflection levels

A clean break above VAH on rising volume signals trend continuation. A failed test of VAH with the histogram showing aggressive sell volume is a classic short setup.

4. Read the shape

P-Shape after a strong trend = trend exhaustion candidate. D-Shape consolidation after a P-Shape day = potential balance area trade. b-Shape into known support = capitulation watch.

5. Algorithmic integration

Set Session = SESSION_MANUAL . The current box's POC, VAH, and VAL are exposed on indicator buffers 0, 1, and 2 respectively. Use iCustom() from your EA to read them.

Setup Guide

Step 1: Set your server's UTC offset

Open MetaTrader, look at the server time in the Market Watch. Compare it to UTC (use any world clock website). Set Server_UTC to the offset:

  • GMT brokers (FXCM, etc.): Server_UTC = 0
  • EET brokers (most MetaQuotes brokers): Server_UTC = 2
  • MSK brokers: Server_UTC = 3

This is a one-time setup. DST is handled automatically.

Step 2: Choose your session

  • Day traders on EUR/USD, GBP/USD: London or New York
  • Day traders on USD/JPY, AUD/USD: Tokyo or Sydney
  • All-session view: Run multiple copies of the indicator on the same chart, one per session

Step 3: Tune the bucket size

Bucket_Pips = 10.0 works well for major pairs on H1 and below. For M5 scalping, try 5 pips. For Gold (XAU/USD), try 50–100 pips depending on volatility.

Compatibility

  • Platform: MetaTrader 4,5
  • Symbols: Forex, Indices, Metals, Crypto, Stocks — any symbol with tick volume data
  • Timeframes: M1 through D1 (M5 and H1 recommended for session work)
  • Volume Source: Tick volume (works on all brokers, including non-ECN)

Technical Notes

  • The Value Area expansion uses the CME / TPO standard "2-bucket sum" rule for institutional accuracy
  • Bar-to-bucket volume distribution is uniform across the bar's High–Low range (Time-Price-Opportunity equivalent)
  • Buy/Sell ratio per bar is derived from close position: BuyRatio = (Close - Low) / (High - Low)
  • The indicator handles missing bars (weekends, holidays) and bars with zero volume gracefully
  • Active sessions display real-time profiles that update with each tick

Support & Updates

Updates and bug fixes are provided free of charge for the lifetime of the product. If you find an issue or want to request a feature, contact us through the MQL5 product page comments.

Tags / Keywords

volume profile · market profile · POC · point of control · value area · VAH · VAL · forex sessions · London session · New York session · Tokyo session · Sydney session · TPO · auction market theory · order flow · smart money · intraday · day trading · swing trading · MT5 indicator


推荐产品
Structural Equilibrium: A New Era of Adaptive Market Analysis As information technology advances and market participation grows, traditional analytical tools often face declining efficiency. Standard technical indicators frequently struggle to interpret the complexities of modern, algorithm-driven market structures. Structural Equilibrium was developed as a high-performance solution featuring a multi-level adaptive smoothing mechanism. This core logic allows the tool to maintain its analytical r
ChangePeriod MT4
Kazuya Yamaoka
You can change the time period of the chart at the touch of a button. You can also change multiple charts at the touch of a button. You can also change multiple charts at the touch of a button, saving you the trouble of changing time periods. We are live-streaming the actual operation of the system. https://www.youtube.com/@ganesha_forex We do not guarantee your investment results. Investments should be made at your own risk. We sharll not be liable for any disadvantage or damage caused by th
Zonecore MT4
Frederic Jacques Collomb
ZONECORE — Volume Profile & Pivot Levels 以外科手术般的精准度识别成交量最集中的价格区域。 MT5 version 什么是 ZONECORE? ZONECORE 是一款专业级指标,将 成交量分布(Volume Profile) 与 高成交量枢轴位(Pivot Levels) 相结合,揭示市场停留时间最长、成交量最大的价格区域。这些区域对价格具有强大的吸引力——掌握它们,让您在识别支撑位、阻力位及高概率反转区域时占据决定性优势。 3 个独立计算模式 ZONECORE 提供三个完全独立的模式,可同时启用: Period 模式 — 基于可配置的 K 线数量(默认 200 根)计算成交量分布。非常适合波段交易和日内分析。 Daily 模式 — 基于当前交易时段计算,支持自定义开始和结束时间。专为在特定市场窗口内操作的日内交易者设计。 Previous Day 模式 — 计算前一交易日(D-1)的成交量分布,并以虚线延伸至当日。对于识别昨日至今仍有效的关键价位不可或缺。 每个模式均拥有独立的配色方案,完全可自定义。 显示的关键价位 POC(控制点) —
Reversal Monster Mini
Abdulfattah Yahya Mohammed Alhazmi
The Most advanced and comprehensive EA to trade Trend Reversals/Pullbacks It is a very profitable EA, to trade trends breakout, and manage trades, takeprofit, stoploss, move to breakeven, and trailing stop. The   “Reversal Monster EA”   trades Reversal/Pullbacks when the current price of the pair pullback to a predefined horizontal level or trendline on the currency chart. The opening of the position can be immediate after pullback to the drawn trendline or after closing the candle below/above
FREE
This tool will perform Trailing stop loss and Break even management for orders. Helps you limit or reduce the time spend watching orders on the screen, especially when you need to go to sleep. Just add this EA to 1 chart, you can manage all pairs. You can filter orders by comment, magic number, symbol, and order ticket number. When Breakeven it can add shift/offset pips (to cover the commission...). You can try in strategy tester before purchase. The EA will add Buy and Sell alternately, so yo
BlueDigitsFx 官方生态系统入口 获取基础设施更新、交易资源、产品发布信息以及 BlueDigitsFx 官方生态系统访问权限。 Telegram 生态系统 官方网站 MT5 版本 BlueDigitsFx Spike And Strike Reversal MT4 —— 用于市场反转与动量分析的复合振荡指标 BlueDigitsFx Spike And Strike Reversal 是一款复合振荡指标,通过结合多个技术指标信号,帮助交易者识别潜在市场反转、动量变化以及趋势衰竭条件。 该指标整合了多种分析组件,包括基于振荡器的确认机制,并直接在图表上显示可视化信号,以支持结构化的市场反转分析。 Spike And Strike 专为希望在市场反转、回调和动量转换过程中获得额外确认的交易者而设计,适用于各种市场环境。 主要特点 基于振荡器的可视化反转分析 信号仅在K线收盘后确认,提高稳定性 适用于所有交易品种和时间周期 常用于 H1 及更高时间框架 内置提醒功能:弹窗、电子邮件、推送通知和声音提醒 可作为趋势和市场结构分析之外的额外确认层 如何使用 BlueDig
IQ Gold Gann Levels
INTRAQUOTES
5 (4)
Presenting one-of-a-kind Gann Indicator for XAUUSD IQ Gold Gann Levels is a non-repainting, precision tool designed exclusively for XAUUSD intraday trading. It uses W.D. Gann’s square root method to plot real-time support and resistance levels, helping traders spot high-probability entries with confidence and clarity. William Delbert Gann (W.D. Gann) was an exceptional market analyst whose trading technique was based on a complex blend of mathematics, geometry, astrology, and ancient calculation
Blahtech Market Profile
Blahtech Limited
4.53 (15)
Was: $249  Now: $99   Market Profile defines a number of day types that can help the trader to determine market behaviour. A key feature is the Value Area, representing the range of price action where 70% of trading took place. Understanding the Value Area can give traders valuable insight into market direction and establish the higher odds trade. It is an excellent addition to any system you may be using. Blahtech Limited presents their Market Profile indicator for the MetaTrader community. Ins

Volume Profile Multi Period Profile MT4
Cesar Sebastian Rosales Ibarra
Volume Profile  Stop guessing where the real money traded. See it. Volume Profile — multi-mode, multi-profile, with POC / Value Area / Peaks & Valleys drawn directly on your chart. Most volume tools dump a histogram at the bottom of your screen and make you guess which price level actually carried the volume. Volume Profile puts the volume where the price is — on the chart, at the price levels where money actually changed hands. You see the value area, the control point, the rejection tails, an
Volume Profile Sniper v11.1是一款全面的市场分析工具 专业的交易方法 Volume Profile Sniper v11.1在一个指标中结合了超过15个关键过滤器,根据对市场情况的全面评估提供清晰的信号。 主要特点 成交量不平衡分析-该算法计算每个蜡烛中买家和卖家的份额,表明其中一方的优势(可配置阈值从50%到90%)。 多级信号滤波-指标考虑到: 趋势指标(EMA9/21) Rsi不包括超买/超卖区域 蜡烛图案(针杆,吸收,锤子) 支持/阻力水平(自动检测) 音量峰值,以确定主要参与者的活动 经典和放大的RSI分歧 波动率评估的ATR 用于确定趋势强度的ADX 价格行动(内部和外部酒吧) 多时间帧确认 市场结构(高点/低点) 会话过滤器(亚洲,伦敦,纽约会话) 防止新闻排放 灵活的配置系统-MinFiltersRequired参数允许您设置生成信号所需的最小数量的滤波器。 这使得可以使指标适应任何交易策略,从激进到保守。 可视化设置-您可以通过将指示器集成到图形样式中来更改箭头的大小和颜色(ArrowSize,BuyArr
Equity Master Stop v2
Frank William Jr Colbert
Trading tool combining a sophisticated equity stop-loss, dynamic take-profit management (Breakeven & Trailing), and symbol-group-based closing logic. It is a complete risk management and trade supervision tool. Features: All features of `Equity Master Stop v1` (floating profit/loss limits, exit protection, skip hours). Take-Profit Override: Can force a TP on any order to lock in a `MAX_FLOATING_PROFIT`. Step Breakeven: Locks in increasing amounts of profit as a trade moves favorably (e.g., aft
The YFX Symbol Data indicator is used to display all the information about the current chart symbol. The indicator makes it easy to examine much more information than just the bid/ask price. Information is categorized as follows: Basic Information - The most generic information about a symbol. It includes the symbol name, bid/ask prices, and spread data. It also includes the low price and high price reached during the current period. Timeframe Information - More details about the current timefra

Support and Resistance Zones MultiTimeframe
Mohamed Gamal Abdelnasser Yous Hashesh
A powerful indicator that highlights key market zones and helps traders identify potential opportunities across multiple timeframes. Designed for clarity and efficiency, it provides real-time alerts to keep you informed of important price levels. Key Features: Works on multiple timeframes: M1, M5, M15, M30, H1, H4, D1, W1, MN1. Customizable zone colors for each timeframe. Real-time alerts and notifications when price reaches significant zones. Automatically manages chart objects to keep your wo

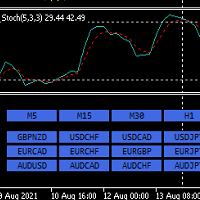
Hello, This is an easy symbol change panel. This is a full version of Symbol1 2Changer Symbols must be active on your Market Watch list. Parameters: SymbolList - you can add more symbols with a comma(,) ratio - change the size LineNumber - you can set that how many symbols are displayed per line. button_width - modify the button size button_height - modify the button size Thank you.
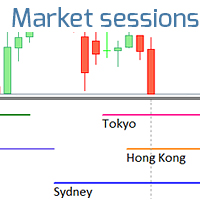
该指标显示全球交易所的交易时间。帮助您了解当前哪些市场最活跃 查看我的  #1 Pro  Utility : 66+ 功能,包括此工具  |   联系我  如有任何问题 帮助选择当前波动最大的交易品种; 对日内交易者特别有用; 1) 在 1H 及以下时间框架 上使用时:线条将对应图表上实际的K线位置,移动图表时,交易时段的线条 会随图表一起移动 。 2) 在 4H 及以上时间框架 上使用时:将显示交易时段的 静态图表 ,垂直线 会在一天中移动 ,指示当前哪些市场活跃。(由于比例尺的原因)。 安装指标后,建议关闭网格 (CTRL+G) 并关闭对象描述 (F8>通用>显示对象描述)。 输入设置: 重要:   为使指标正常工作,需在初始设置中设置   经纪商时间与格林尼治标准时间的时差: 经纪商时间可在“市场报价”窗口顶部查看 (视图 > 市场报价 [或 CTRL+M])。 例如,如果经纪商时间现在是 16:30:00,而格林尼治标准时间是 14:30:00,参数值应为 [2] (相差2小时)。 如果时差为负,请勿忘记在数字前添加负号 (如果经纪商时间现在是 13:20:00,而格林尼
Master Volume profile
Israr Hussain Shah
Money Flow Profile MT5 HERE   Here   our more valuable tools SMC Trend Trading   ,  Easy SMC Trading  ,  Institutional SMC Architect Volume Analysis Tools  ,  Volume flow Profile  ,  Market volume profile  , FVG with Volume  , Liquidity Heatmap Profile  ,  Volume Spread Analysis This Master Edition is engineered for clarity and speed, featuring a unique Auto-Theme Sync system that instantly beautifies your chart layout upon loading. Key Features: True Money Flow Calculation: Goes beyond stand
Here   our more valuable tools SMC Trend Trading   ,  Easy SMC Trading  ,  Institutional SMC Architect Volume Analysis Tools  ,  Volume flow Profile  ,  Market volume profile  , FVG with Volume  , Liquidity Heatmap Profile  ,  Volume Spread Analysis       MT5 VERSION   TRADE COPIER Select Role: On the account sending trades, choose Sender (Master Account) . On the account receiving trades, choose Copier (Receiver Account) . Lot Size Mode: Same Lot Size as Master: Ignores multipliers, copies ex
FX-Support Presents the Trading Panel for MT4 The Trading Panel for MT4 is a powerful and versatile tool designed to assist traders in their daily trading activities. It helps traders open positions and identify market signals, such as ENG and STAR patterns. The panel simplifies decision-making and supports efficient trading. Key Features: Automatic Lot Size Calculation Calculates lot sizes accurately, considering market conditions and currency conversions for effective risk management. Accura
我们为您提供一个指标"蜡烛收盘台",它将成为您在贸易领域不可或缺的助手。 这就是为什么知道蜡烛何时关闭会有所帮助的原因: 如果你喜欢使用蜡烛花纹进行交易,你就会知道蜡烛何时关闭。 此指标将允许您检查是否形成了已知模式以及是否存在交易的可能性。 该指标将帮助您做好市场开放和市场关闭的准备。 可以设置一个计时器来创建计划新闻的预览,这样就可以检查市场对此的反应。 您可以设置指示灯,以便在蜡烛关闭前几秒钟发送警报/警告。 通知/警报/警报可以发送到: 屏幕警报 电子邮件 移动应用 MT4烛台计时器指示器为什么有用 那么烛台计时器什么时候有用呢?如果你长期交易,你可能不需要蜡烛计时器指示器,因为你的参赛不会受到一分钟或一小时的太大影响。但是,如果你在短时间内是黄牛或交易员,那么你知道时机非常重要。 外汇市场24小时开放,只在周末关门,有些策略可能会受到您入仓时出现错误时机的严重影响。 MT4蜡烛计时器指示器可以显示当前蜡烛中的剩余时间,以便为下一次蜡烛打开做好准备。 可以从这一指标中受益的一些情况例子有: 预定消息传出 地理市场开闭 预定发生的事件,通常是金融、经济或政治事件
这是一个预测蜡烛收盘价的指标。 该指标主要用于 D1 图表。 该指标适用于传统外汇交易和二元期权交易。 该指标可以用作独立的交易系统,也可以作为您现有交易系统的补充。 该指标分析当前蜡烛,计算蜡烛本身内部的某些强度因素,以及前一根蜡烛的参数。 因此,该指标预测市场走势的进一步方向和当前蜡烛的收盘价。 由于这种方法,该指标既适用于短期盘中交易,也适用于中长期交易。 该指标允许您设置指标在分析市场情况期间将产生的潜在信号的数量。 在指标设置中有一个特殊的参数。 此外,该指标可以通过图表上的消息、电子邮件以及推送通知的形式通知新信号。感谢您的关注!交易愉快! 购买后一定要写信给我! 我会给你我的交易指标的建议! 还可以获得奖金!
Candlestick Pattern Scanner is a multi-timeframe and multi-symbol dashboard and alert system that checks all timeframes and currency pairs for different candlestick patterns that are formed in them. Scanner is integrated with support and resistance zones so you can check the candlestick patterns in the most important areas of the chart to find breakout and reversal patterns in the price chart. Download demo version   (works on M30,D1,W1 timeframes and 20 symbols of Market Watch window) Read the
Introduction Take your forex trading to the next level with our vibrant, color-coded session indicator! Designed for MT4/MT5, this tool visually separates the Asian (Purple) , London (Yellow) , and NYC (Pink) trading sessions for optimal trading strategy. Key Features Color-Coded Precision : Asian (Purple), London (Yellow), NYC (Pink) sessions marked directly on your chart. Perfect for Session Traders : Focus on the overlaps and high-volatility periods. Compatibility : Works seamlessly with MT4
Prime Vortex Pro— Multi-Layer Confluence Trend & Reversal Signal Indicator Trade with clarity, not noise. The Idea Behind Prime Vortex Pro Most signal indicators on the market fire on almost every candle — dozens of arrows a day, most of them meaningless noise that gets traders into weak, low-probability trades. Prime Vortex Pro was built around one simple rule: silence is the default. A signal only appears when multiple, independent layers of market evidence agree at the same moment. Instead of
This is  a dashboard indicator that displays the auto-calculated risk lot, with the given risk percentage & risk points (Stop Loss) and others. The main function of this indicator is to help you calculate your exact scalping risk lots and swing risk lots. Also it displays the active trades of each pair you've executed with the following: type of trade, lot size, symbol, & equity(+/-). Also displays the bar counter set in every 5-minute bar timer. (whichever time frame you're active, the bar time
Order Panel 28
Pablo Sebastian Nequecaur
Order Panel 28 — Professional Manual Execution Panel for MT4 Trade 28 forex pairs from a single on-chart panel — with automatic lot sizing, split entries, auto break-even, and stealth SL management. Order Panel 28 is a precision execution tool built for manual traders who want full control over their entries while eliminating the repetitive calculations that slow you down and cause mistakes. No indicators, no black-box signals — just a clean, fast panel that does the math so you can focus on you
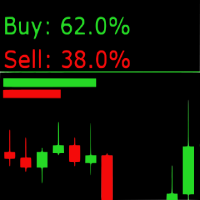
Sentiment Market Indicator: Real-Time Market Sentiment Display The Sentiment Market Indicator is a real-time MQL4 tool that displays current buy/sell sentiment directly on your MetaTrader 4 chart. Designed to support your technical analysis, it provides a visual representation of market positioning to help inform your decision-making process. Key Features Live Sentiment Display View real-time percentage breakdowns of buy vs. sell sentiment. Customizable Alerts Set specific thresholds for buy o
Trade Assistant Pro 36 in 1
Makarii Gubaydullin
4.76 (21)
多功能交易工具:手数计算器、网格订单、风险回报比、交易管理、供需区、价格行为分析等 演示版   |   用户手册 交易助手 不能在策略测试器中运行:您可以下载 演示版 来测试此 实用工具 。 如有任何问题 /改进想法/发现错误 ,请 联系我 如需MT5版本,请点击 此处 简化、加速并自动化您的交易 流程 。通过此 仪表板 扩展标准终端功能。 交易面板 适用于任何交易品种:外汇、股票、指数、加密货币等。 1. 开立新交易 :手数/风险/风险回报比计算:手动交易的风险管理 手数计算器(基于风险规模计算交易量) 风险计算器(基于手数计算风险金额) 风险回报比 网格订单: + 动态间距选项和分割手数选项 订单激活触发器,+ 买入止损限价/卖出止损限价:MT4也可用 虚拟止损,虚拟止盈(隐藏止损,隐藏止盈:经纪商不可见) 智能止损/入场价位:如果K线收盘价超越此价位(避免错误触发) 隐藏订单(虚拟订单) 计划订单:即使市场休市也可下单(周末计划器) 附加多级止盈(多重获利了结) OCO订单(一单取消另一单),具有不同ID 交易可视化 + 图表上调整 以买入价(Bid)设置的止损/入场价位:避
Daily Average - Retracement Dashboard   is an indicator that allows you to monitor more than one currency pairs at one time. This indicator is mainly for strategy that trade price retracement based on Resistance3/4 or Support 3/4. After apply this indicator to the chart window, it will hide the chart and display the currency pairs in a table form. There are several data shown on the table that will help trader know when to analyze the currency and do trade using retracement. The indicator will s
Awesome Oscillator by Bill Williams with the ability to fine-tune and replace the averaging algorithms of the indicator, which significantly expands the possibilities of using this oscillator in algorithmic trading and brings it closer in its properties to such an indicator as the MACD. To reduce price noise, the final indicator is processed with an additional Smooth averaging. The indicator has the ability to give alerts, send mail messages and push signals when the direction of movement of th
该产品的买家也购买
Neuro Poseidon MT4
Daria Rezueva
4.8 (45)
Neuro Poseidon is a new indicator by Daria Rezueva. It combines precise trading signals with adaptive TP/SL levels - creating best possible trades as a result! Message me and get  Neuro Poseidon Assistant  as a gift to automize your trading process! What makes it stand out? 1. Proven profitability on all assets and timeframes 2. Only confirmed BUY and SELL signals present on the chart 3. Adaptive TP & SL levels generated by the software for each trade 4. Easy to understand - suitable for all
BTMM State Engine Pro MT4
Garry James Goodchild
BTMM State Engine Pro by G-Labs — Beat The Market Maker indicator for MetaTrader 4. Asian session range, London and New York kill zones, level progression (L1/L2/L3), peak formation detection (PFH/PFL), entry signals, and a multi-pair scanner from one chart. Stop scanning charts one pair at a time. The State Engine tracks the BTMM daily cycle automatically — Asian box, room boundaries, level blocks, peak formations, and filtered entries — while the scanner dashboard shows level, peak status,
Dynamic Forex28 Navigator
Bernhard Schweigert
4.43 (7)
Dynamic Forex28 Navigator - 下一代外汇交易工具。 当前 49% 折扣。 Dynamic Forex28 Navigator 是我们长期流行的指标的演变,将三种功能合二为一: 高级货币强度 28 指标 (695 条评论)+ 高级货币 IMPULSE 带警报 (520 条评论)+ CS28 组合信号(奖励)。 有关指标的详细信息 https://www.mql5.com/en/blogs/post/758844 下一代强度指标提供什么? 您喜欢的原始指标的一切,现在通过新功能和更高的精度进行了增强。 主要特点: 专有货币强度公式。  所有时间范围内的平滑和准确的强度线。 非常适合识别趋势和精确进入。 动态市场斐波那契水平(市场斐波那契)。  此指标独有的独特功能。 斐波那契应用于货币强度,而不是价格图表。 适应实时市场活动以获得准确的反转区域。 实时市场动量。  第 9 行显示市场是活跃还是被动。 对于定时交易至关重要。 全面的警报和显示。  每种货币最强的买入和卖出动量。 ​​28 对的双重动量买入和卖出。 超买/超卖警告外部范围和止损。 反转
Supply and Demand Dashboard PRO
Bernhard Schweigert
4.81 (21)
目前八折优惠! 这个仪表板是一个非常强大的软件,可用于多个符号和多达9个时间段。 它是基于我们的主要指标(最佳评论:高级供应需求)。 Advanced Supply Demand 该仪表板提供了一个伟大的概述。它显示。   筛选后的供需值,包括区域强度评级。 区间内和区间外的点位距离。 它突出了嵌套的区域。 在所有(9个)时间段内,它对所选符号发出4种警报。 它是高度可配置的,以满足您的个人需求! 您的利益! 对每个交易者来说,最重要的问题是。 什么是入市的最佳水平? 在强大的供应/需求区域内或附近进入你的交易,以获得最佳的成功机会和风险/回报。 我的止损的最佳位置是哪里? 把你的止损放在强势供应/需求区的下方/上方是最安全的。 我的最佳盈利目标是什么? 你的退出策略和你的进入策略一样重要,了解更高的时间框架图可以帮助你。对于买入,使用下一个供应区作为目标,对于卖出,使用下一个需求区作为目标。在回撤到供应区或需求区时进场,以确保有足够的利润空间,达到更高的时间框架的供应和需求,将增加你的利润。 为什么我们要过滤强区和弱区? 不平衡性越大,价格的变动就
Super Signal – Skyblade Edition 專業級無重繪 / 無延遲趨勢信號系統,擁有卓越勝率 | 適用於 MT4 / MT5 在較低的時間週期上效果最佳,例如 1 分鐘、5 分鐘與 15 分鐘圖表。 核心特色: Super Signal – Skyblade Edition 是一套專為趨勢交易設計的智能信號系統。 其採用多重濾波邏輯,僅篩選出具有明確方向性、動能強勁且波動結構健康的走勢進場點。 本系統 不預測高點或低點 ,只有在同時滿足以下三項條件時才會觸發交易信號: 趨勢方向明確 動能持續增強 波動率結構穩定 此外,系統還結合市場流動性分析,以進一步提升信號的準確性與觸發時機。 信號特性: 所有箭頭信號皆為 100% 無重繪,無延遲 信號一旦出現即固定於圖表,不會閃爍或消失 提供圖表箭頭、資訊面板、彈出通知、聲音提示及推播訊息 支援 EA 呼叫(Buffer 輸出),可整合至自動化交易或信號跟單系統 提供預設參數模板,免調整即可使用,適合新手快速上手 總結: Super Signal – Skyblade Edition 是一款邏輯清晰、穩定高效的專業趨勢型
KURAMA GOLD SIGNAL PRO(MT4)— 7层过滤 · 自动止盈止损 · 质量评分 · 信号历史保存 | 完整的XAUUSD交易系统 实时不重绘。信号出现的瞬间,箭头、入场、止盈、止损当场锁定,之后绝不移动。你交易的就是这个实时信号。而且在v7.20中,每一个真正发出的信号都会自动保存,并在重启后精确还原。 购买者专属赠品 购买永久授权,即可免费获得 AI Zone Radar(价值$59)+ 完整PDF手册。在产品价格之外,额外附赠价值$59的赠品。购买后在MQL5上给我留言即可。 AI Zone Radar: https://www.mql5.com/en/market/product/175834 在黄金交易者社区中被实际使用,因精度与易用性而广受好评。 你的难题 —— 以及解决方案 黄金一天波动$30–$50。你知道机会就在那里。但这些情况是否似曾相识: - 入场太早,价格逆行$10后才朝你的方
Built-in multi-symbol scanner — traffic-light grid for up to 30 pairs across four timeframes. No separate scanner file required. BUY, SELL, WAIT cells with confluence score and recent structure event. Full alignment with AI Trade Idea — current chart cell reads live engine data so scanner, dashboard, and AI panel always show the same verdict, score, and reason. Per-cell explain popup — four-section breakdown of what is happening, how the score was built, what to look for, and what to watch out
Neo Wave PRO
Nikolay Raykov
5 (1)
Price & Time Market Structure Indicator A professional market structure tool that analyzes waves through both price and time — not price alone. Main Description NeoWave PRO is a professional market structure indicator for MetaTrader 4 designed for traders who want to move beyond traditional one-dimensional wave tools such as ZigZag, swing indicators, and basic high/low systems. Most wave indicators analyze only one thing: Price. But a real market wave is not only a price movement. A true wave de
Currency Strength Exotics
Bernhard Schweigert
4.88 (33)
目前8折优惠! 对任何新手或专家交易者来说都是最好的解决方案! 这个指标是专门用来显示任何符号的货币强度,如异国货币对、商品、指数或期货。它是同类产品中的第一个,任何符号都可以添加到第9行,以显示黄金、白银、石油、DAX、US30、MXN、TRY、CNH等的真实货币强度。这是一个独特的、高质量的、负担得起的交易工具,因为我们已经纳入了一些专有的功能和一个新的公式。想象一下,你的交易将如何改善,因为你能够准确地确定新趋势或剥头皮机会的触发点? 用户手册:点击这里   https://www.mql5.com/en/blogs/post/708876 它适用于所有时间框架。你将很快能够看到TREND! 根据新的基础算法设计,它使识别和确认潜在交易变得更加容易。这是因为它以图形方式显示了8种主要货币和一种符号的强弱。 该指标显示了8种主要货币(澳元加元瑞士法郎欧元英镑日元新西兰美元)的强弱线,再加上一个符号! 该指标显示了符号的真实价值。例如:对于XAUUSD(黄金):价格以美元报价。如果黄金在上涨,你怎么能知道是黄金的强势还是美元的弱势?只有当黄金走强时,我们才会进行交易。该指
AW Candle Patterns MT4
AW Trading Software Limited
AW 蜡烛形态指标是高级趋势指标与强大的蜡烛形态扫描仪的组合。它是识别和突出显示 30 个最可靠的烛台形态的有用工具。此外,它是一个基于彩色条的电流趋势分析器,带有   可调整大小和定位的插件多时间框架趋势面板。根据趋势过滤调整模式显示的独特能力。 优点: 轻松识别蜡烛形态 不重绘结果 内置多时间趋势面板 禁用模式类型(1、2、3 根蜡烛) 显示形态时趋势过滤的调整 MT5 version - >   HERE   / Instructions and description  -> HERE 显示模式列表: 锤模式 固定/固定 看跌 Harami / 看涨 Harami 看跌 Harami Cross / 看涨 Harami Cross 枢轴点反转向上/枢轴点反转向下 双柱低位收盘价较高/双柱低位收盘价较低 收盘价反转向上 / 收盘价反转向下 中性条 /     两个中性条 双内/内/外 向上推力杆/向下推力杆 晚星/晨星 晚上十字星 / 早上十字星 吞没看跌线/吞没看涨线 镜子酒吧 流星 乌云盖顶 十字星 输入变量: Main settings Trend Filtering Mo
Scalper Inside PRO
Alexey Minkov
4.74 (68)
Scalper Inside PRO 帮你分析日内趋势,在入场前就把交易规划好。核心是三套专属策略,让你更精准地读懂市场。信号一出现,指标就自动判断行情方向并计算关键价位,你能提前看到潜在入场点、预期的止损以及多个止盈位。详尽的绩效统计会展示不同品种和策略在历史上的表现,帮你根据当前行情挑选合适的资产。它既可以作为独立的剥头皮工具,也可以融入你的系统,或者作为你自己 EA 的基础。运行于 MetaTrader 4 平台。 指标会直接在图表上标出入场、三个止盈位 - TP1、TP2、TP3 以及一个可选止损。你甚至可以接入自己的箭头指标,检验它们的统计数据和盈利能力。 购买后请直接联系我,即可获得指标的专属附赠 add-ons、更多关于实盘运用的说明,以及把它正确接入你自己交易系统和 EA 的帮助。 指标主要功能 内置三套专属交易策略,可即时切换。 箭头信号出现后即时计算价位:入场以及 TP1、TP2、TP3 多级目标立刻显示,方便你提前规划交易。开启手动或自动计算后,会显示止损位。 三套策略均内置优化模块:自动把参数适配到当前品种和周期,帮你快速筛选资产(仅在实时状态下可用)。 HTF
GOLD Impulse with Alert
Bernhard Schweigert
4.67 (12)
这个指标是我们2个产品 Advanced Currency IMPULSE with ALERT  +   Currency Strength Exotics 的一个超级组合。 它适用于所有时间框架,并以图形方式显示8种主要货币和一种符号的强势或弱势冲动! 该指标专门用于显示任何符号的货币强度加速,如黄金、异国货币对、商品、指数或期货。这是它的第一个指标,任何符号都可以被添加到第9行,以显示黄金、白银、石油、DAX、US30、MXN、TRY、CNH等的真实货币强度加速(冲动或速度)。 建立在新的基础算法上,它使识别和确认潜在的交易更加容易。这是因为它以图形方式显示了一种货币的强势或弱势是否正在加速,并测量了这种加速的速度--把它想象成你汽车中的速度表。当你加速时,事情显然会发生得更快,这在外汇市场上也是一样的,即如果你配对的货币正在向相反的方向加速,你就会发现一个潜在的有利可图的交易。 动态市场斐波那契28水平被用作警报触发器,将适应市场活动。如果冲动击中黄色触发线,你将收到警报。然后你就知道作为一个交易员应该做什么。货币对和方向已经给出。只需点击警报按钮,就可以切换到该货
ECM Elite Channel is a volatility-based indicator, developed with a specific time algorithm, which consists of finding possible corrections in the market. This indicator shows two outer lines, an inner line (retracement line) and an arrow sign, where the channel theory is to help identify overbought and oversold conditions in the market. The market price will generally fall between the boundaries of the channel. If prices touch or move outside the channel, it's a trading opportunity. The ind
Adopt market correlation and indicator resonance Here are some trading recommendations based on the current market conditions: (1) Note: It doesn't mean you have a perfect deal, but rather helps you avoid bad trades (2) Why traditional indicators are prone to distortion. For example, the 10-day moving average is calculated by calculating the average price of the top 10 candlesticks. Result: I prove I want to rise, and the signal is easily distorted. This indicator adopts a self-proof + corrob
Linear Trend Predictor — 结合切入点和方向支撑线的趋势指标。按照突破高/低价通道的原理运作。该指标算法过滤市场噪音,考虑波动性和市场动态。 指示器功能  使用平滑方法,显示市场趋势和开立买入或卖出订单的切入点。  适合通过分析任何时间范围内的图表来确定短期和长期的市场走势。  输入参数可适应任何市场和时间范围,允许交易者独立定制指标。  设定的指示信号不会消失,也不会重新绘制——它是在蜡烛收盘时确定的。  几种类型的通知以箭头组合。  该指标既可以作为独立的交易系统使用,也可以作为其他交易系统的补充。  可供任何经验水平的交易者使用。 主要参数 Volatility Smoothing Level - 指标的主要参数,允许您配置指标以实现舒适的操作。 它的数字范围是 1 到 100,从而增加了您可以获得更长趋势运动的平滑度。 通过少量的数字,您可以获得短期走势并快速退出交易。 使用指标进行交易的时刻:  红线和箭头表示下降趋势和卖出开盘信号。止损应根据前一个上分形来设置。  黄线和箭头表示上升趋势和买入开盘信号。止损应根据前一个下分形来设置。
Gold Channel XAUUSD
Paulo Rocha
5 (4)
Gold Channel is a volatility-based indicator, developed with a specific timing algorithm for the XAUUSD pair, which consists of finding possible corrections in the market. This indicator shows two outer lines, an inner line (retracement line) and an arrow sign, where the theory of the channel is to help identify overbought and oversold conditions in the market. The market price will generally fall between the boundaries of the channel. If prices touch or move outside the channel it is a tradi
Quantum Breakout Indicator PRO
Bogdan Ion Puscasu
4.96 (26)
介绍     Quantum Breakout PRO   ,突破性的 MQL5 指标,正在改变您交易突破区域的方式!   Quantum Breakout PRO 由拥有超过 13 年交易经验的经验丰富的交易者团队开发,旨在通过其创新和动态的突破区域策略将您的交易之旅推向新的高度。 量子突破指标将为您提供带有 5 个利润目标区域的突破区域的信号箭头,以及基于突破框的止损建议。 它既适合新手交易者,也适合专业交易者。 量子 EA 通道:       点击这里 MT5版本:   点击这里 重要的!购买后请私信我领取安装手册。 建议: 时间范围:M15 货币对:GBPJPY、EURJPY、USDJPY、NZDUSD、XAUUSD 账户类型:ECN、Raw 或 Razor,点差极低 经纪商时间:GMT +3 经纪商:IC Markets、Pepperstone with Raw 和 Razor 的点差最低 规格: 不重漆! 最多 5 个建议利润目标区域 建议止损水平 可定制的盒子。您可以设置自己的 Box Time Start 和 Box Time End。 接触 如果您
Owl smart levels
Sergey Ermolov
4.26 (38)
在顺势交易中,主要的难点不在于找到一个水平位,而在于理解哪里才是一个真正有效的入场点。 价格经常对水平位产生反应,但无法延续 движение — 这会导致错误入场或错过行情。 Owl Smart Levels 不仅仅显示水平位 ,还会基于市场结构和回调构建区域。这使你可以以不同的方式评估入场点,并避免一部分虚假信号。 Owl Smart Levels 系统包含什么? Owl Smart Levels 不只是标记水平位,而是一个 完整的交易模型 ,其中每个元素相互配合。 系统包含: Owl Smart Levels(指标) 显示趋势方向、回调区域,以及预定义的入场、止损和止盈水平 系统指南 解释如何在实战中使用信号:哪些情况需要考虑,哪些需要忽略,以及如何管理交易 交易决策清单 帮助你快速评估信号,避免基于“感觉”入场 Owl Helper 辅助EA 简化交易执行和管理 (一键下单) 说明、示例和策略 帮助你快速上手,并在实践中理解系统逻辑 最终,你获得的不是一个单独的工具,而是一个完整的交易框架 —— 从分析到执行。 阅读更多: Owl Smart Levels 如何发展
MTF Supply Demand Zones
Georgios Kalomoiropoulos
4.82 (22)
下一代自动化供需区。适用于任何图表的创新算法。所有区域都是根据市场的价格行为动态创建的。 两种类型的警报 --> 1) 当价格触及区域时 2) 当新区域形成时 你不会再得到一个无用的指标。您将获得一个完整的交易策略和经过验证的结果。     新的功能:     价格触及供需区时发出警报     创建新的供应/需求区时发出警报     推送通知警报     以点为单位的区域宽度标签     关于 MTF 的又一个时间表。因此,现在您将能够看到高于当前 3 个时间帧,而不是高于当前 2 个时间帧     启用/禁用警报/区域/MTF 功能的按钮 您获得的优势:     消除交易中的情绪。     客观化您的交易条目。     通过高概率设置提高您的利润。     节省绘图区域的时间。     像专业人士一样交易金融市场。     任何市场的即时多时间框架分析。 你在图表上看到了什么?     蓝色和红色矩形是当前时间范围的供需区。     虚线样式线是当前上方第一个时间范围内的供需区域。     实线样式线是当前上方第二个时间范围内的
Cycle Sniper
Elmira Memish
4.39 (36)
Please contact us after your purchase and we will send you the complimentary indicators to complete the system Cycle Sniper is not a holy grail but when you use it in a system which is explained in the videos, you will feel the difference. If you are not willing to focus on the charts designed with Cycle Sniper and other free tools we provide, we recommend not buying this indicator. We recommend watching the videos about the indiactor and system before purchasing. Videos, settings  and descri
Congestioni
Stefano Frisetti
5 (1)
This indicator is very usefull to TRADE Trading Ranges and helps identify the following TREND. Every Trader knows that any market stay 80% of the time in trading ranges and only 20% of the time in TREND; this indicator has been built to help traders trade trading ranges. Now instead of waiting for the next TREND, You can SWING TRADE on trading ranges with this simple yet very effective indicator. TRADING with CONGESTIONI INDICATOR: The CONGESTIONI Indicator identify a new trading range and ale
ATC AlgoZone Indicator
Ameur Boudenne
5 (2)
Algo Trading Indicaor  With this indicator , you’ll have zones and trends that hight probability the price will reverse from it. so will gives you all the help that you need  MT5 Version                    https://www.mql5.com/en/market/product/170028 MT4 Version                    https://www.mql5.com/en/market/product/88034 Why should you join us !?  1-This indicator is logical since it’s working in previous days movement , to predict the future movements. 2-Algo trading indicator will hel
Miraculous 指标 – 100% 不重绘的外汇和二元期权工具,基于江恩九方图 这个视频介绍的 Miraculous 指标 是一款专为外汇和二元期权交易者开发的高精度、强大交易工具。该指标的独特之处在于它建立在传奇的 江恩九方图 和 江恩振动法则 之上,使其成为现代交易中可用的最精确预测工具之一。 Miraculous 指标 完全不重绘 ,这意味着它的信号在 K 线收盘后不会改变或消失——你看到的就是你得到的。这为交易者提供了可靠且一致的基础,让他们能够自信地进出场交易。 主要特点: 基于江恩九方图和江恩理论构建 100% 不重绘的信号系统 适用于所有时间周期(M1、M5、H1、H4、日线、周线) 适用于外汇和二元期权交易 清晰的买卖信号,准确率高 可用于剥头皮、日内交易或波段交易 兼容大多数 MT4 平台 这款工具旨在帮助初学者和专业交易者做出更好、更明智的决策。无论您是交易货币、指数还是二元期权,Miraculous 指标都将为您在市场中提供所需的优势。
All in One Trade
Alexey Minkov
4.5 (28)
All-in-One Trade Indicator (AOTI) – Since 2015. The All-in-One Trade Indicator (AOTI) determines daily targets for EURUSD, EURJPY, GBPUSD, USDCHF, EURGBP, EURCAD, EURAUD, AUDJPY, GBPAUD, GBPCAD, GBPCHF, GBPJPY, AUDUSD, and USDJPY. All other modules work with any trading instruments. The indicator includes various features, such as Double Channel trend direction, Price channel, MA Bands, Fibo levels, Climax Bar detection, and others. The AOTI indicator is based on several trading strategies, and
Supreme Commander
Ramon Sobrevals Arce
4.13 (8)
The indicator of the indicators. The Most Powerful Technique to Determine Forex Trend Strength in 2023. We have perfected Supreme Commander that it calculates an average of the selected indicators (up to 16) and the selected timeframe (all) with the result of a single trend that indicates the potential of buying and selling.  It includes the following indicators: Accelerator/Decelerator oscillator Average Directional Movement Index Awesome oscillator; Bulls and Bears  Commodity Channel Index; De
Volatility Trend System - a trading system that gives signals for entries. The volatility system gives linear and point signals in the direction of the trend, as well as signals to exit it, without redrawing and delays. The trend indicator monitors the direction of the medium-term trend, shows the direction and its change. The signal indicator is based on changes in volatility and shows market entries. The indicator is equipped with several types of alerts. Can be applied to various trading ins
GoldRush Trend Arrow Signal
Kirk Lee Holloway
5 (2)
GoldRush 趨勢箭頭信號 GoldRush 趨勢箭頭信號 指標為 XAU/USD 中的高速、短期短線交易者提供精確、實時的趨勢分析。 專為1分鐘時間框架設計,此工具顯示方向箭頭以明確顯示入場點,使短線交易者能在波動市場中自信操作。 該指標包含主要和次要警示箭頭。主要信號為白色和黑色方向箭頭,用於指示趨勢方向的轉變;次要信號為藍色和紅色箭頭,用於確認主要箭頭指示的方向並提示潛在交易入場點。 注意:當趨勢方向發生變化後僅出現一個主要警報箭頭時,請注意可能會出現多個次要藍/紅箭頭。次要信號將在滿足信號標準的任何蠟燭圖後出現,因此在長期趨勢移動中,螢幕上將顯示大量次要箭頭(如附帶的截圖所示)。您可在設置中開啟或關閉任一箭頭類型。 以下是我使用此指標進行交易的方式: - 對於買入入場,我會耐心等待白箭頭在蠟燭收盤時出現,並在下一根可用蠟燭收盤時出現藍箭頭時進行買入交易。 - 對於賣出入場,我會耐心等待黑箭頭在蠟燭收盤時出現,並在下一根可用蠟燭收盤時出現紅箭頭時進行賣出交易。 - 獲利了結/止損設置由使用者自行負責,但我個人使用最低R:R為1:2,並發現這在倫敦/紐約開盤等
NAM Order Blocks
NAM TECH GROUP, CORP.
3.67 (3)
MT4多時限訂單塊檢測指示器。 特徵 -在圖表控制面板上完全可自定義,提供完整的交互。 -隨時隨地隱藏和顯示控制面板。 -在多個時間範圍內檢測OB。 -選擇要顯示的OB數量。 -不同的OB用戶界面。 -OB上的不同過濾器。 -OB接近警報。 -ADR高低線。 -通知服務(屏幕警報|推送通知)。 概括 訂單塊是一種市場行為,它指示從金融機構和銀行收取訂單。著名的金融機構和中央銀行帶動了外匯市場。因此,交易者必須知道他們在市場上正在做什麼。當市場建立訂單塊時,它會像發生大多數投資決策的範圍一樣移動。 訂單建立完成後,市場將朝著上升和縮小的方向發展。訂單大宗交易策略的關鍵術語是它包括機構交易者正在做的事情。由於它們是主要的價格驅動因素,因此包括機構交易在內的任何策略都可以。 您將在任何時間範圍內實時看到訂單塊,使用我們的控制面板,您將能夠在所選的歷史記錄週期內檢測常規,拒收和未大寫的訂單塊。 現在您可以接收到訂單塊接近警報,我們在MT4上顯示屏幕通知,並將通知推送到您的手機!
Enigmera
Ivan Stefanov
5 (9)
ENIGMERA: 市场的核心 重要提示:MQL5.com 演示版本在策略测试器中运行,可能无法完全反映 Enigmera 的功能。请查看描述、截图和视频了解详细信息。如有任何问题,请随时联系我! 该指标的代码已完全重写。版本 3.0 增加了新功能并修复了自指标发布以来积累的错误。 简介 这个指标和交易系统是金融市场的一种独特方法。ENIGMERA 使用分形周期来精确计算支撑和阻力水平。它展示了真实的积累阶段,并提供了方向和目标。无论是在趋势中还是在修正中,这个系统都能工作。 它是如何工作的 指标的大部分功能通过图表左侧的按钮控制,使得能够快速响应不同的市场情况。 按钮 ON/OFF – 显示或隐藏整个指标。 Channel – 激活支撑通道,显示可接受的偏差范围。 Dev1 (第一偏差) – 指示价格在支撑偏差内的波动,信号表示市场正在整合或积累力量。 Dev2 (第二偏差) – 显示价格在偏差之间的波动,表示趋势形成和方向。 Dev3 (第三偏差) – 表示趋势的显著加速和高波动性。 45deg (45度) – 显示市场的节奏和相对于 45 度线的运动稳定性。 Tgt1/2
Meravith
Ivan Stefanov
5 (3)
做市商工具。 Meravith 将: 分析所有时间周期并显示当前正在运行的趋势。 标注流动性区域(成交量均衡区),即多头与空头成交量相等的位置。 在您的图表上直接显示来自不同时间周期的所有流动性水平。 生成并展示基于文本的市场分析供您参考。 根据当前趋势计算目标位、支撑位和止损位。 计算交易的风险回报比。 根据您的账户余额计算仓位大小,并估算潜在利润。 在市场出现重大变化时,Meravith 还会发出警告。 指标的主要线条: 多头/空头成交量衰竭线 —— 作为目标位使用。 趋势线 —— 指示市场趋势方向。根据市场是多头还是空头而改变颜色,并作为趋势支撑。其颜色主要反映市场情绪。 成交量均衡线(Eq)—— Eq(Volume Equilibrium)是系统的核心。它表示买卖双方成交量的平衡点,即市场流动性所在位置。向上突破 Eq 表示多头倾向,向下突破 Eq 表示空头倾向。突破后,应等待回调——当价格回到相反趋势的偏离线或衰竭线附近时。 使用方法:只需将其添加到图表中。 Meravith 可以分析一切——趋势和回调。 趋势线与某条成交量衰竭线之间的距离越大,说明该方向的成交量越高。 趋
作者的更多信息
Overview  Market Structure Analysis Indicator MT4 Structure Analysis Indicator   automatically identifies Market Structure based on Smart Money Concepts (SMC). It clearly displays Break of Structure (BoS), Change of Character (CHoCH), Higher Highs, Higher Lows, Lower Highs, and Lower Lows in real-time. Key Features Automatic Market Structure Detection   Break of Structure (BoS)   - Price breaks previous structure in trend direction   Change of Character (CHoCH)   - Trend reversal sig
Base Box Indicator MT4
Korabhat Phonwiang
Overview Base Box Indicator automatically detects and draws institutional supply and demand base zones using the Rally-Base-Rally (RBR) and Drop-Base-Drop (DBD) price action methodology — one of the most reliable frameworks for identifying high-probability reversal and continuation areas. Unlike basic support/resistance tools, this indicator isolates the precise consolidation phase (the "Base") between two impulse moves and renders it as a structured 3-layer box that separates candle bodies from
Overview  Market Structure Analysis Indicator MT5 Structure Analysis Indicator automatically identifies Market Structure based on Smart Money Concepts (SMC). It clearly displays Break of Structure (BoS), Change of Character (CHoCH), Higher Highs, Higher Lows, Lower Highs, and Lower Lows in real-time. Key Features Automatic Market Structure Detection Break of Structure (BoS) - Price breaks previous structure in trend direction Change of Character (CHoCH) - Trend reversal signals Hi
Volume Profile by Trading Session   — Visualize where price spent its time and where the smart money traded, automatically segmented by Sydney, Tokyo, London, or New York sessions. What is Market Volume Profile? Market Volume Profile (MVP)   is a professional-grade Volume Profile indicator built for traders who think in   sessions, not just candles . While most volume tools show you a single profile across an arbitrary range, MVP automatically segments your chart by the four major Forex session
筛选:
无评论
回复评论