Opening Range Pro MT4

Opening Range Pro


WHAT DOES THIS INDICATOR DO?


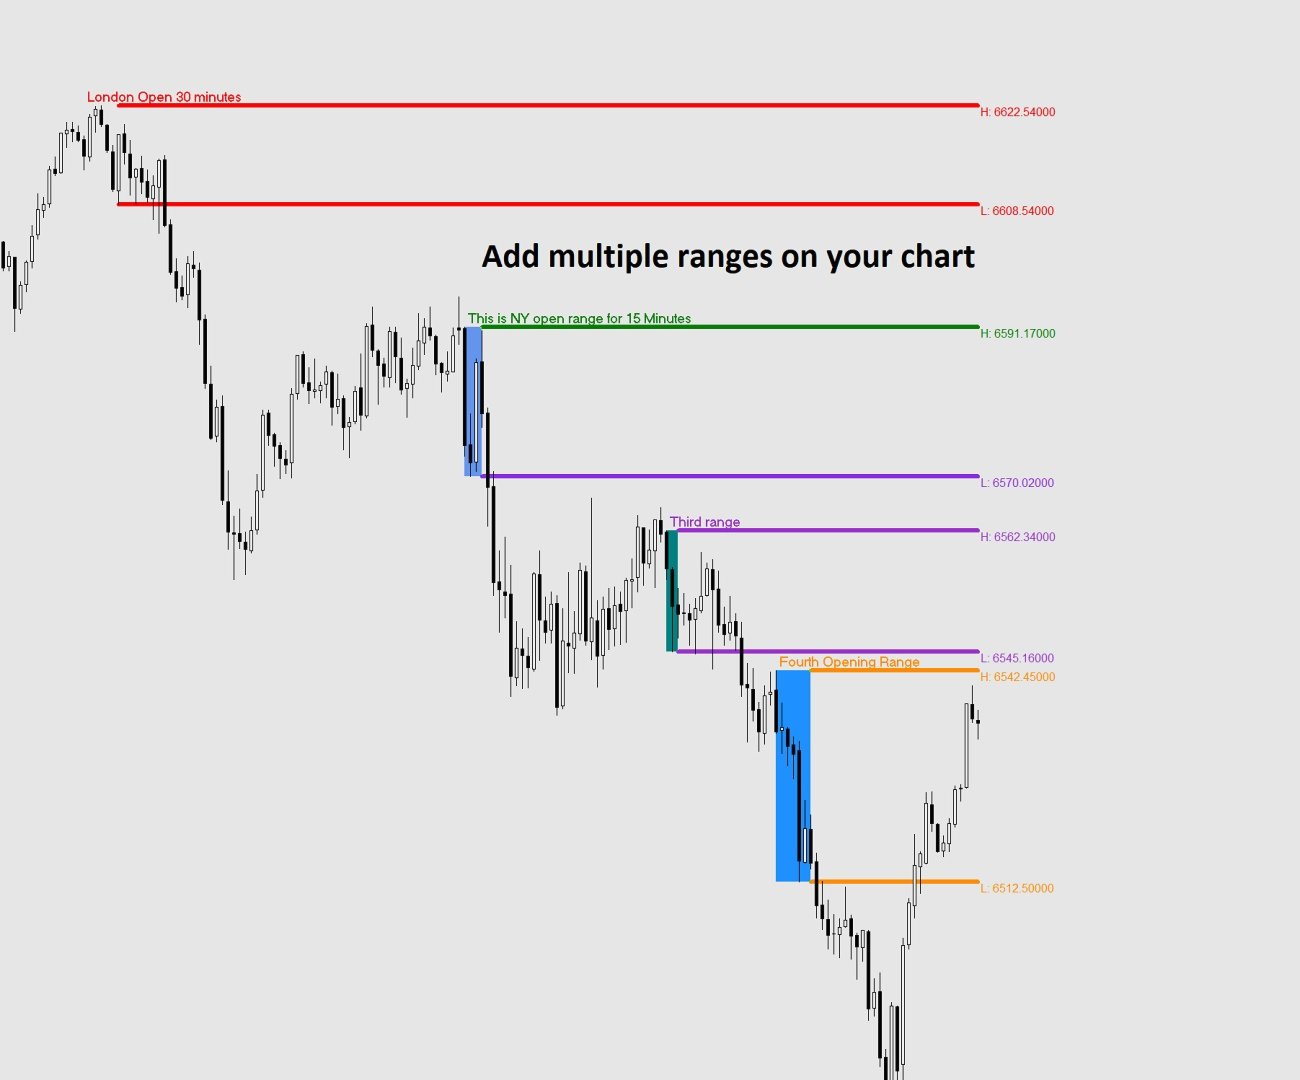
The Opening Range indicator marks the highest and lowest price reached during a

specific time window that you define (for example, the first 15 minutes of the

New York session). Once that window closes, it draws two horizontal lines — one

at the high and one at the low — extending across the rest of the trading day,

so you can see at a glance whether price is above or below the range, and use

those levels as reference for your trading decisions.


The indicator also draws a shaded box covering the formation period, and can

display the exact price of each level right on the chart.


All times used by the indicator are your broker's server time, which you can

see at the bottom of your MetaTrader platform.


SETTINGS REFERENCE


When you attach the indicator to a chart, a settings window will appear with

two tabs: General (description) and Inputs (your settings). All settings are

found in the Inputs tab.


-- IDENTIFICATION --


  Unique Identifier

      A short label used internally to tell apart multiple instances of the

      indicator running on the same chart. If you only use one instance, leave

      this as the default (OR1). If you add a second instance for a different

      session, change this to OR2 (or any unique text) to avoid conflicts.

      Example: OR1, OR2, London, NY


  Name of the Range (shown on chart)

      Optional. Whatever you type here will appear as a bold label directly on

      the chart at the top-left corner of the range box and at the start of the

      high line. Leave it blank if you do not want a label.

      Example: "London Open", "NY Open", "Asia Range"


-- TIME SETTINGS --

  All times refer to your broker's server time (shown at the bottom of MT4/MT5).


  Range Start Hour

      The hour at which the range formation period begins.

      Enter a number from 0 to 23 using the 24-hour clock.

      Example: 9 means 9:00 AM broker time.


  Range Start Minute

      The minute at which the range formation period begins.

      Always enter 2 digits: 00, 01, 05, 15, 30, 45, etc.


  Range End Hour

      The hour at which the range formation period ends.

      Enter a number from 0 to 23 using the 24-hour clock.


  Range End Minute

      The minute at which the range formation period ends.

      Always enter 2 digits: 00, 01, 05, 15, 30, 45, etc.


  Example — to capture the first 15 minutes of a session starting at 09:30:

      Range Start Hour   = 9

      Range Start Minute = 30

      Range End Hour     = 9

      Range End Minute   = 45


-- DISPLAY --


  Days Back to Display

      How many past trading days to draw on the chart. Higher values give you

      more history but may slow things down on low-powered computers.

      Recommended: 5 to 20.


  High Line Color

      The color of the horizontal line drawn at the top of the range.


  Low Line Color

      The color of the horizontal line drawn at the bottom of the range.


  Line Width

      Thickness of the high and low lines. Enter a number from 1 (thinnest)

      to 6 (thickest).


  Line Style  (MT5 only — dropdown)

  Line Style  (MT4 — enter a number: 0=Solid, 1=Dash, 2=Dot, 3=DashDot, 4=DashDotDot)

      The style of the high and low lines.


  Show Price Labels

      True = display the exact price of the high and low at the right end of

             each line, next to the last candle of the day.

      False = hide the price labels.


  Show Range Box

      True = draw a shaded rectangle covering the range formation period

             (between Range Start and Range End) showing you exactly where

             the high and low were established.

      False = hide the box. The high and low lines are still drawn.


  Box Color

      The fill color of the range box. Choose a color that is visible but

      not distracting on your chart background.


USING MULTIPLE RANGES ON THE SAME CHART


You can add the indicator more than once to study different session ranges

simultaneously (e.g. London open and New York open on the same chart).


To do this:

  1. Attach the indicator a first time and configure it for the first session.

     Set Unique Identifier to OR1.

  2. Attach the indicator a second time and configure it for the second session.

     Set Unique Identifier to OR2.


Each instance must have a different Unique Identifier. If two instances share

the same identifier, their objects will overlap and produce incorrect results.


TIPS

- The lines only appear AFTER the range formation period has closed. During the

  formation period you will see the shaded box building in real time, but the

  extending lines appear once the End Hour/Minute is reached.


- If no lines appear for today, it may be that the range end time has not yet

  passed on the current day. Historical days will still show correctly.


- If lines appear at the wrong time, double-check your broker's server time

  (visible at the bottom of your MetaTrader window) and adjust the start and

  end hours accordingly.


- Weekend days (Saturday and Sunday) are automatically skipped.


- Removing the indicator from the chart will cleanly delete all lines, boxes

  and labels it created.


推荐产品
QuantEx Pivot Indicator
Savia Forex Software Solutions
QuantEx Pivot Indicator is a practical MT4 technical analysis tool designed to help traders identify important Fibonacci-based pivot, support, and resistance levels directly on the chart. The indicator monitors price action and plots key levels using a structured calculation framework, giving traders a clearer view of potential reaction zones across different market conditions. QuantEx Pivot Indicator can be used on compatible currency pairs, indices, commodities, stocks, metals, and cryptocurre
KT Forex Blau Balance MT4
KEENBASE SOFTWARE SOLUTIONS
KT Forex Blau Balance combines elements of momentum and volatility. It helps you identify entry and exit points. Blau Balance consists of two moving averages (a slow-moving average and a fast-moving average) intersecting key transition points in market price. The indicator turns green or red when one is above or below the other, signaling to buy or sell trade signals. It can be used in currency pairs and other markets that your MT4 or MT5 platform supports. Both short-term and long-term trade
FREE
Dear Trader It is my pleasure to introduce to you my tool called the " Forex Sniper Indicator" . The major aim of this tool is to help serious traders and investors in all type of Financial Markets to catch price next movement right at the moment the price direction is about to change. This tool can be used to snipe the price direction in both down trend, uptrend and ranging markets. This tool can be used as the stand alone tool though it may be combined with other tools as well. My goal is to h
NIGHTCrusher Lite FREE
Christian Opperskalski
4.5 (2)
NIGHTCRUSHER is a fully automated expert advisor, designed for scalping on quite market situation. The Lite - Version is limited to minimal Lot per Pair and dont has lot mulitplier and dynamic function you can also run different strategies like swing trading or grid different Trade Entry Signals different Exit Strategies included (MA Cut / Signal Change / Trailing TP) clever Risk & Money management - Balance based - Longrun trades tracking You can also use a Grid function or Lot multipier, if ne
FREE
It could help to calculate Risk-Reward easily before placing a BUY-SELL position. TradeSizeCalculator is a Multi-Tasking Calculator. It will calculate the others when we define the value in one of the columns. Stoploss, risk percentage, risk-money, lot size, take-profit , reward-money, and reward-ratio. Depending on which value is changed. All values in the columns are editable. Also, we can get those calculation results by drag-drop the stop-loss/take-profit line. Parameter: The inputs below ar
Adelio
Jin Sangun
5 (1)
ADELIO 介绍   概述 ADELIO 是一款针对 黄金 (XAU/USD) 的强大而精准的自动交易系统。 它通过利用市场的波动性和趋势,采用多重进入策略进行风险管理。 ADELIO EA 使用趋势跟随的瞬间价格调整和波动的力量进行交易,设计为所有交易者都能轻松使用。 ADELIO EA 的特点 : ADELIO EA 利用黄金资产独特的单向趋势特性。 黄金通常是一种具有强烈波动性和长期单向趋势的资产。 为了匹配这种特性,ADELIO 通过 "DEPOSIT NEED" 功能管理账户资产,并持续保持仓位。 也就是说,当价格朝一个方向大幅波动时,ADELIO 会重新平衡资产,并调整平均价格,在最佳时机实现盈利。 重点在于如何频繁地使用 MAGIC 来进行资产管理。 该策略限制了最多使用 3 次 MAGIC 的配置,因此回测中的 DD 并不是主要关注点。 这一策略的核心在于长期的风险管理和资产配置,而不仅仅是追随市场趋势。 因此,传统的回测无法准确反映这一策略的效果。ADELIO 的核心价值在于其在真实市场中的资产管理能力和应对波动的能力,因此这款 EA 的真正价值在于实际交易中的风
KT Fisher Transform MT4
KEENBASE SOFTWARE SOLUTIONS
KT Fisher Transform is an advanced version of the original Fisher Transform oscillator equipped with divergence detection, crossover alerts, and many more features. Originally it was developed by John F. Ehlers. It converts the asset's price into a Gaussian normal distribution to find the local extremes in a price wave.  Features A light-weighted oscillator that efficiently identifies the upward and downward crossovers and marks them using vertical lines. It also finds regular and hidden diverg
FREE
Voorloper MT4
Pradana Novan Rianto
4.5 (18)
Voorloper Expert Advisor: Revolutionizing Trading with DDR System Introducing Voorloper, an innovative Expert Advisor that blends Moving Average (MA) and Relative Strength Index (RSI) indicators to redefine your trading experience. Voorloper stands out from the crowd with its unique feature: the Drawdown Reduction (DDR) System. Key Features: MA and RSI Integration:   Voorloper utilizes a powerful combination of Moving Average and Relative Strength Index indicators to identify optimal entry and
FREE
KT Knoxville Divergence MT4
KEENBASE SOFTWARE SOLUTIONS
5 (1)
KT Knoxville Divergence 是一个强大的工具,通过精心结合相对强弱指数(RSI)和动量振荡器,揭示金融市场中独特的价格背离。该指标能够有效捕捉市场动态中的微妙变化,帮助交易者更精准地识别潜在的盈利机会。 Knoxville Divergence 是由 Rob Booker 开发的一种交易背离类型。交易中的背离指的是资产价格的走势与技术指标(振荡器)的方向相反。这种差异通常预示着当前趋势可能正在减弱,并可能即将反转。 这对寻找最佳入场和出场点的交易者非常有用。每当出现背离信号时,该指标会在价格图表上以可视化形式进行提示。 理解 Knoxville Divergence Knoxville Divergence 既可以用来逆势交易,也可以用于等待小幅回调后顺势进入长期趋势。因此,它被认为是一个逆趋势指标。这个指标的形成依赖于两个关键组成部分的协同工作。 首先是动量指标(Momentum)。当价格持续上涨,但动量指标开始下降时,这就是潜在 Knoxville Divergence 出现的第一信号。然而,仅凭动量变化还不足以确认,需要第二个条件 —— 相对强弱指数(RS
FREE
Titan Tri-Filter EA Titan Tri-Filter EA, yapılandırılmış trend sömürü ve hassas risk azaltma için tasarlanmış gelişmiş bir algoritmik işlem sistemidir. Makro-yönlü trendleri kısa vadeli momentum sinyalleriyle sistematik olarak hizalayarak, algoritma gün içi piyasa gürültüsünü filtrelemeyi ve çok katmanlı teknik koşullar sağlandığında işlemleri yalnızca gerçekleştirmeyi amaçlar. Çekirdek Mimari (Üç Katmanlı Filtreleme Mantığı): Katman 1: Makro Trend Filtresi (Günlük Temel): Birincil piyasa yanlıl
MACD Scanner With Alerts
Niravkumar Maganbhai Patel
4 (2)
MACD仪表盘面板   该指标可帮助您扫描Market Watch窗口中的交易品种并根据MACD过滤趋势。 移动平均线趋同散度(MACD)是一种趋势跟踪动量指标,它显示了证券价格的两个移动平均线之间的关系。通过从12个周期EMA减去26个周期的指数移动平均线(EMA)来计算MACD。 该计算的结果是MACD行。然后在MACD线上方绘制MACD的为期9天的EMA,称为“信号线”,它可以触发买入和卖出信号。当MACD越过信号线上方时,交易者可以买入该证券;当MACD越过信号线下方时,交易者可以卖出或做空该证券。移动平均趋同散度(MACD)指标可以用几种方法来解释,但更常见的方法是交叉,散度和快速上升/下降。 它显示了单个窗口中每个时间帧的MACD趋势。您也可以通过单击值来打开图表
FREE
please leave 5 stars to me A   support level   is a level where the price tends to find support as it falls. This means that the price is more likely to "bounce" off this level rather than break through it. However, once the price has breached this level, by an amount exceeding some noise, it is likely to continue falling until meeting another support level. A   resistance level   is the opposite of a support level. It is where the price tends to find resistance as it rises. Again, this means t
FREE
Range Filter - BreakOut EA What is the Range Filter? The   Range Filter   is an innovative tool designed to smooth out market noise and highlight meaningful price movements. Rather than focusing on every small fluctuation, the Range Filter eliminates insignificant activity, allowing traders to see trends more clearly. The idea comes from the QQE’s volatility filter, but instead of applying it to RSI, this approach is applied directly to price action. Here’s how it works: A smoothed average of t
FREE
Read detailed blogpost here: https://www.mql5.com/en/blogs/post/772233 Features at a Glance Linear regression center line with statistically accurate curved deviation bands Three band calculation modes: RMA of High-Low Range, Standard Deviation, and True ATR Candle coloring in two modes: Heatmap (position inside the bands) and Volume-Weighted Colored Bars (VWCB) Straight regression channel (Channel 1) with up to 3 deviation levels Future projection channel (Channel 2) with optional Higher Timef
Similar to logic used in: Golden MA MTF TT   Overview "Golden MA" indicator for OB/OS levels. It's based on High/Lows of higher timeframe (HTF) previous bar. Only useful in swing trading or scalping. Best for at least M15+. For lower timeframes you'll need to change StartPips to lower value to get consistent lines. Because lower timeframes will have smaller pip distances.   Features - Define Higher Timeframes for Current Timeframe: Use a comma-separated list to define the higher timeframe for th
FREE
UT Bot Alerts for MT4
Ulises Calderon Bautista
5 (1)
UT Bot Alerts — 基于ATR的自适应追踪止损系统 将TradingView上QuantNomad开发的传奇指标「UT Bot Alerts」完整移植到MQL5和MQL4。 原始概念由HPotter提出,初始实现由Yo_adriiiiaan完成,Pine Script v4警报版本由QuantNomad(Vadim Cissa)开发——他是TradingView上拥有超过10万粉丝的知名量化开发者。原始脚本在TradingView上获得了 超过110万次浏览和35,500次收藏 ,是有史以来最受欢迎的开源交易指标之一。 本移植版以 100%的逻辑忠实度 复现了原始算法:相同的4分支递归追踪止损逻辑、相同的交叉检测、相同的信号生成。在已确认K线上不会重绘。 什么是UT Bot Alerts? UT Bot Alerts是一个 趋势跟踪信号系统 ,基于一个简洁而优雅的核心概念:利用平均真实波幅(ATR)动态调整与价格距离的自适应追踪止损。 在上升趋势中,追踪止损只向上移动,绝不下降——锁定利润。在下降趋势中,止损只向下移动,绝不上升。当价格穿越追踪止损线时,系统切换方向并生成
FREE
QuantumAlert Stoch Navigator is a free indicator available for MT4/MT5 platforms, its work is to provide "alerts" when the market is inside "overbought and oversold" regions in the form of "buy or sell" signals. This indicator comes with many customization options mentioned in the parameter section below, user can customise these parameters as needful. Join our   MQL5 group , where we share important news and updates. You are also welcome to join our private channel as well, contact me for the p
FREE
Scalp Arrow Exit Signals (MT4 Indicator) A powerful all‑in‑one MT4 indicator providing precise entries, exits, and re‑entries across any timeframe or trading style. The Scalp Arrow Exit Signals is a complete “black‑box” signal system engineered for MT4 traders who want clarity, speed, and reliability. It generates clean buy/sell arrows along with exit, re‑entry, retracement, and pull‑back entry signals — all supported by flexible alerts and customizable risk settings. Whether you scalp fast ch
Milch Cow Harmonic EA "Tool designed to trade 28 currency pairs according to 88 harmonic patterns plus one customized according to your parameters The expert graph interface guides you to the pattern names when passing over the pattern circle You can activate or disable any number of currency pairs and patterns for your trade by clicking on the currency pair circle or the harmonic pattern (green = activate    red = disable) You can set more than one time frame within which the expert will look f
AuroraV5
Ron Fritzhugh Bryan
I could write a fantastic description with lots of quantitative testing parameters but we have a saying that "taste of a pudding is in the eating " so I will simple put a CHALLENGE :Test this EA on any of the major and minor pairs (AUD,USD,EUR,CHF,NZD )and I guarantee you  50% discount if you can prove in a test on any of the major pairs above  that you have incurred  more than 3 error runs. *NOW HAPPY TESTING* Then you get to write the description unhindered!!!!!!!!!!!!!!!!!!!!!!!!!!!!!!!
I will support only my client. สำหรับลูกค้า Parameters General Trade Settings Money Management  Lot : Fixed (can change) Strategies  - H4 Strategies it is fixed with MA, Bollinger band, Candlestick Levels Close Functions  - H4 Strategies MagicNumber  - individual magic number. The EA will only manage position of the chart symbol with this magic number. NextOpenTradeAfterMinutes  - 15 minutes is default, can change it MaxSpread  - upto currency pairs, MaxSlippage  - upto currency pairs, Push No
Custom Candle
Robby Suhendrawan
Custom Candle – Multi-Timeframe Visualization Analyzing multiple timeframes is essential for accurate trading decisions, but switching between charts can be inconvenient and inefficient. The Custom Candle indicator solves this problem by overlaying higher-timeframe (HTF) candles directly onto your lower-timeframe (LTF) chart. This allows you to see the bigger picture at a glance, align with the higher trend, and improve trade accuracy—without leaving your current chart. Key Features Multi-Timefr
FREE
Tarantula
Sergey Kruglov
4.2 (5)
Tarantula is a trend Expert Advisor that looks for entry points based on the standard Moving Average indicator. It works with two timeframes selected in the settings. The EA looks for the points of trend change and opens an order when the signal matches on different timeframes. All orders are protected by stop loss. However almost all orders are closed by the EA on a signal change. Parameters SL - stop loss. TP - take profit. OnWork_1 - enable/disable searching for signals on the first timefram
FREE
VolatilityScalperEA
Nikolaos Pantzos
3 (2)
This expert is a pure volatility scalper working with two pending orders (buy stop and sell stop). Expert not use any indicator, only use prices action and volatility of price to generate signals. There are three conditions for it to work: Tight spread  Fast execution Stop level = 0 Please during the tests of this EA do not simultaneously use another EA in the same terminal because it affects the modification speed. Try expert on demo account first before use it on real one.
FREE
Moving pivot Average Fibonacci The  indicator compares the selected period with its counterpart from the previous period. The indicator determines the moving Fibonacci levels for the day or any time interval to assess the price movement range from the time average. The indicator helps predict the expected high or low for the day based on historical time data. The pivot line can be considered an average trend line and use it in a variety of trading strategies. If you have any question about the
MA Line with Filter
Erwin Rustandi
4 (7)
Expert Advisor = MA Line with Filter Executor = Crossing Candle and Moving Avereage Line Filter = Moving Average, Stochastic, Parabolic SAR Parameter Information: Lot Mode --> 1 = Fixed Lot, 2 = Freeze%Balance Lot, 3 = Martingale System Position Type --> 1 = Every time there is a signal ea will open a position, 2 = Only one position per trade you can choose filter some, all or nothing
FREE
My Point MT4
Claudia Ramona Angerer
4 (1)
Diagnosis of major and minor pivot Trend detection with many signals Can be used in all symbols Can be used in all time frames Settings: Back Show: The number of candles it displays If you need any adjustments, or have any questions or suggestions, message me How to trade: Blue: sell signal Red: buy signal Blue and red at the same time: no signal Exit signal: Opposite signal
Atr Mtf Trend
Jalitha K Johny
The Average True Range (ATR) is a tool to measure volatility. ATR MTF (Multi Time Frame) indicator provides all timeframe trends helps to identify in which kind of volatility environment the market .This indicator can be used with any Trading Systems for additional confirmation of trading entries or exits. It is a very helpful tool to calculate Targets and Stops according the current market conditions.
朋友们好,欢迎了解我的EA,这里我将从3个方面介绍这款EA,第一个是我对 EA的基本看法 ,第二是 这款EA的优势 ,第三是怎样 运用好这款EA 。 EA运营的实盘信号 https://www.mql5.com/zh/signals/518243 复利测试优酷视频 我对EA的基本看法: 1、策略的研究最终还是要回归到概率问题上,也就是这个策略在长期的运行过程中,是否是正期望的系统。 2、EA能不能用,需要检验其测试效果和实盘效果的吻合度,持仓时间太短(几分钟甚至一分钟以内的),测试和实盘基本上是两码事,典型代表就是超短和早盘头皮系统。 3、EA要经得起时间检验,回测近5年以上不能爆仓,并且1000单以上,无过度优化或特意过滤,最好能在多个品种上有较好的表现,这样才算有效策略。 4、没有风控的马丁系统不能用,如果单次止损就达到30%以上,那么这个系统你自己也用不下去,止损了就会放弃,最好是一单一单做,并且带止损的系统,这样黑天鹅相对也要安全许多。 5、EA的稳定性要好,这个指的是回撤的时间和幅度不能太长,连续3个月亏损,估计很少有人能坚持下去。 这款EA的优势: 1、市场上大部分策略都
TA Inspector
Sergey Borisov
Индикатор TA Inspector - инструмент, который позволит улучшить анализ рынка и поможет определить дальнейшее движение цены на основе геометрических построений и ориентацию целей ценового развития. Индикатор производит самостоятельно построение трендовых линий и предполагаемого расчетного уровня окончания тренда (HP / Hypothetical Point). Индикатор выполняет автоматическое построения моделей метода Tactica Adversa. С точки зрения Tactica Adversa движение цены представляет собой последовательную см
该产品的买家也购买
Gann Made Easy
Oleg Rodin
4.84 (168)
Gann Made Easy 是一个专业且易于使用的外汇交易系统,它基于使用先生理论的最佳交易原则。 W.D.江恩。该指标提供准确的买入和卖出信号,包括止损和获利水平。您甚至可以使用推送通知在旅途中进行交易。 购买后请联系我,即可免费获得交易指导和超棒的额外指标! 您可能已经多次听说过江恩交易方法。通常 Gann 的理论不仅对于新手交易者而且对于那些已经有一定交易经验的人来说都是非常复杂的东西。这是因为江恩的交易方法在理论上并不那么容易应用。我花了几年时间来完善这些知识,并将最好的原则应用到我的外汇指标中。 该指标非常易于应用。您所需要的只是将其附加到您的图表并遵循简单的交易建议。该指标不断进行市场分析工作并寻找交易机会。当它检测到一个好的入口点时,它会为您提供一个箭头信号。该指标还显示止损和获利水平。 换句话说,当您像先生一样进行交易时,该指标会为您提供最佳江恩建议。江恩亲自告诉你此时此刻该做什么。但最好的部分是您不需要了解任何有关江恩交易原则的知识,因为该指标会为您完成整个市场分析工作。
Super Signal – Skyblade Edition 專業級無重繪 / 無延遲趨勢信號系統,擁有卓越勝率 | 適用於 MT4 / MT5 在較低的時間週期上效果最佳,例如 1 分鐘、5 分鐘與 15 分鐘圖表。 核心特色: Super Signal – Skyblade Edition 是一套專為趨勢交易設計的智能信號系統。 其採用多重濾波邏輯,僅篩選出具有明確方向性、動能強勁且波動結構健康的走勢進場點。 本系統 不預測高點或低點 ,只有在同時滿足以下三項條件時才會觸發交易信號: 趨勢方向明確 動能持續增強 波動率結構穩定 此外,系統還結合市場流動性分析,以進一步提升信號的準確性與觸發時機。 信號特性: 所有箭頭信號皆為 100% 無重繪,無延遲 信號一旦出現即固定於圖表,不會閃爍或消失 提供圖表箭頭、資訊面板、彈出通知、聲音提示及推播訊息 支援 EA 呼叫(Buffer 輸出),可整合至自動化交易或信號跟單系統 提供預設參數模板,免調整即可使用,適合新手快速上手 總結: Super Signal – Skyblade Edition 是一款邏輯清晰、穩定高效的專業趨勢型
Neuro Poseidon MT4
Daria Rezueva
4.82 (44)
Neuro Poseidon is a new indicator by Daria Rezueva. It combines precise trading signals with adaptive TP/SL levels - creating best possible trades as a result! Message me and get  Neuro Poseidon Assistant  as a gift to automize your trading process! What makes it stand out? 1. Proven profitability on all assets and timeframes 2. Only confirmed BUY and SELL signals present on the chart 3. Adaptive TP & SL levels generated by the software for each trade 4. Easy to understand - suitable for all
Prop Firm Sniper
Mohamed Hassan
5 (6)
Prop Firm Sniper MT4  is a professional market structure indicator that automatically identifies high-probability BUY and SELL opportunities using BOS and CHoCH analysis. Recommended Timeframes: For backtesting, use the indicator on   M5 or M15   for Gold (XAUUSD), and   M15 or H1   for more volatile Forex pairs such as   GBPUSD, USDJPY, EURGBP , and similar markets. CONTACT ME AFTER PURCHASE TO CLAIM YOUR FREE BONUSES! Prop Firm Sniper  is a professional market structure indicator designed t
M1 Sniper
Oleg Rodin
5 (26)
M1 SNIPER 是一款易于使用的交易指标系统。它是一个专为 M1 时间框架设计的箭头指标。该指标可以作为独立的系统在 M1 时间框架下进行剥头皮交易,也可以作为您现有交易系统的一部分使用。虽然该交易系统专为 M1 时间框架交易而设计,但它也可以用于其他时间框架。我最初设计此方法是为了交易 XAUUSD 和 BTCUSD。但我发现这种方法在其他市场交易中也同样有用。 指标信号既可以顺势交易,也可以逆势交易。我教授一种特殊的交易技巧,帮助您利用指标信号进行双向交易。该方法基于使用特殊的动态支撑位和阻力位区域。 购买后,您可以立即下载 M1 SNIPER 箭头指标。此外,我还为所有 M1 SNIPER 工具用户免费提供下方屏幕截图所示的 Apollo Dynamic SR 指标!这两个指标的组合可以帮助您更轻松、更准确地利用 M1 时间框架进行交易。 购买后请联系我,免费获取交易提示和奖励指标! 祝您交易成功!
Smart Trend Trading System
Issam Kassas
4.71 (7)
本产品已针对 2026 年市场进行更新,并针对最新 MT5 版本进行了优化。 价格更新通知: Smart Trend Trading System 目前价格为 $99 。 接下来的 30 次购买 后,价格将上涨至 $199 。 特别优惠: 购买 Smart Trend Trading System 后,请发送私信给我,即可免费领取 Smart Universal EA ,并将您的 Smart Trend 信号转换为自动交易。 Smart Trend Trading System 是一套完整的交易系统,具备不重绘、不回绘、不延迟的特点,专为希望获得更清晰信号、更准确趋势方向以及更有组织交易方式的交易者打造。 Online course , manual and [download presets] . 它将 10 多种交易工具 整合到一个系统中,包括趋势检测、反转区域、Smart Cloud、移动止损逻辑、支撑与阻力、K线着色、提醒以及多周期分析。 该系统旨在帮助您应对不同的市场环境: 趋势市场: 识别主要趋势,发现回调,跟随动能,并通过止损指导和移动止损选项寻找更清晰的入场机会。
Atomic Analyst
Issam Kassas
5 (9)
本产品已针对 2026 年市场进行更新,并针对最新 MT5 版本进行了优化。 价格更新通知: Atomic Analyst 目前价格为 $99 。 接下来的 30 次购买 后,价格将上涨至 $199 。 特别优惠: 购买 Atomic Analyst 后,请发送私信给我,即可免费领取 Smart Universal EA ,并将您的 Atomic Analyst 信号转换为自动交易。 Atomic Analyst 是一款不重绘、不回绘、不延迟的 Price Action 交易指标,专为手动交易、清晰信号和 EA 自动化而设计。 User manual: settings, inputs and strategy.      &   User Manual PDF . 它分析价格行为、强度、动能、多周期方向和高级过滤器,帮助交易者减少噪音,避免弱势交易机会,并做出更有结构的交易决策。 该指标将复杂的市场计算转换为简单的视觉信号、彩色K线、趋势读数、止损水平和多个止盈区域,使交易者能够快速理解并应用于真实市场环境。 主要交易用途: 剥头皮和日内交易: 专为快速决策、清晰箭头、提醒、K线
Currency Strength Wizard
Oleg Rodin
4.85 (60)
货币强度向导是一个非常强大的指标,为您提供成功交易的一体化解决方案。该指标使用多个时间范围内所有货币的数据来计算这个或那个外汇对的力量。此数据以易于使用的货币指数和货币电力线的形式表示,您可以使用它们来查看这种或那种货币的力量。 您所需要的只是将指标附加到您要交易的图表上,该指标将向您显示您交易的货币的真实强度。该指标还向您显示买卖量压力的极值,您可以在顺势交易时利用这些压力。该指标还显示了基于斐波那契的可能目标。该指标可用于各种交易时间范围。该指标支持各种货币对的交易。 该指标为您提供所有类型的警报,包括推送通知。 购买后请联系我。我将与您分享我的交易技巧,并免费为您提供丰厚的红利指标! 祝您交易愉快,获利丰厚!
Gold Signal Swing Pro XAUUSD with Auto TP SL (MT4) — 7层过滤器 + RR保证系统的XAUUSD摆动交易完整系统 无重绘。无重画。无延迟。所有信号在确认后锁定。 买家奖励:购买现货许可证可免费获得AI Zone Radar(价值$59)+ PDF手册。购买后在MQL5上向我发送消息。 AI Zone Radar: https://www.mql5.com/en/market/product/175834 MT5版本也已发售: https://www.mql5.com/en/market/product/170916?source=Site +Profile+Seller 在活跃的交易社区中被黄金交易者使用和信赖。专为精确度和易用性而构建。 这是为谁设计的 工作或生活太忙无法盯盘M5/M15的交易者 只想交易经过过滤的高质量信号的人 隔夜持仓或离开屏幕时持仓的交易者 想要每个信号获得更大波动的交易者(M30上$8-$25,H1上$15-$40,H4上$30-$150) 厌倦了猜测TP/SL设置位置的人 因低时间框架虚假信号而疲惫的交易者
MTF Supply Demand Zones
Georgios Kalomoiropoulos
4.82 (22)
下一代自动化供需区。适用于任何图表的创新算法。所有区域都是根据市场的价格行为动态创建的。 两种类型的警报 --> 1) 当价格触及区域时 2) 当新区域形成时 你不会再得到一个无用的指标。您将获得一个完整的交易策略和经过验证的结果。     新的功能:     价格触及供需区时发出警报     创建新的供应/需求区时发出警报     推送通知警报     以点为单位的区域宽度标签     关于 MTF 的又一个时间表。因此,现在您将能够看到高于当前 3 个时间帧,而不是高于当前 2 个时间帧     启用/禁用警报/区域/MTF 功能的按钮 您获得的优势:     消除交易中的情绪。     客观化您的交易条目。     通过高概率设置提高您的利润。     节省绘图区域的时间。     像专业人士一样交易金融市场。     任何市场的即时多时间框架分析。 你在图表上看到了什么?     蓝色和红色矩形是当前时间范围的供需区。     虚线样式线是当前上方第一个时间范围内的供需区域。     实线样式线是当前上方第二个时间范围内的
Scalper Inside PRO
Alexey Minkov
4.74 (68)
Scalper Inside PRO Scalper Inside PRO 是一款日内趋势与剥头皮指标,采用独家的内置算法来评估市场方向和关键目标位。该指标会自动计算进场点、出场点以及多个止盈目标位,并显示详细的绩效统计数据,让您能够看到不同品种和策略在历史数据上的表现。这有助于您选择符合当前市场状况的交易品种。您还可以将自己的箭头指标连接到 Scalper Inside PRO,并快速查看它们的统计数据和历史信号。 Scalper Inside PRO 使用手册及参数说明: 点击阅读 该指标适用于任何品种和时间周期(日内交易推荐使用 M5),并包含多种内置策略。它既可作为独立的剥头皮工具使用,也可作为您交易系统的分析组件。 主要功能 基于独家的新一代趋势检测算法 Next-Generation Trend Detection Algorithm (NG TDA) 进行趋势识别。 自动计算进场点和出场点,并提供多级止盈目标(TP1、TP2、TP3)。 三种内置策略和一个优化器,用于将信号适配到当前品种和时间周期(仅在实时模式下可用)。 提供品种和策略在历史数据上的详细绩效统计。 提
Congestioni
Stefano Frisetti
5 (1)
This indicator is very usefull to TRADE Trading Ranges and helps identify the following TREND. Every Trader knows that any market stay 80% of the time in trading ranges and only 20% of the time in TREND; this indicator has been built to help traders trade trading ranges. Now instead of waiting for the next TREND, You can SWING TRADE on trading ranges with this simple yet very effective indicator. TRADING with CONGESTIONI INDICATOR: The CONGESTIONI Indicator identify a new trading range and ale
PZ Trend Trading
PZ TRADING SLU
4.8 (5)
许多盈利交易者不仅知道如何识别市场趋势,而且也能把握趋势建立后的交易机会。 Pz 趋势交易 指标设计用来在趋势行情中尽可能的赚取利润。 已建立的趋势提供了一揽子交易机会,但大多数趋势交易指标完全忽视了它们,让交易者在趋势行情时完全不知道该如何做!一般趋势指标只通知有关的趋势变化,但根本不足以得到卓越的回报. Pz 趋势交易 指标比一般趋势指标显示多达 20 倍的交易 , 因为它注重所谓的市场时机。它不仅显示当前的市场趋势,也有回调,内柱线的突破和调整。它令您在趋势回调之后介入,安全的柱线内突破金字塔加仓,以及发现潜在的反转,和已知的调整。 趋势改变 一个趋势改变在市场方向变化时发生。趋势变化在图表上用带数字的彩色圆圈显示。蓝色 (1) 信号为上涨开始, 而红色 (1) 信号为下跌开始。趋势变化并非评估当前价格动作的结果, 它意味着交易设置是不定时地。如果您正确使用本指标, 在趋势变化时, 您将将已经入场 (参看下面的调整)。 回调 但凡趋势在运动中,行情上下抖动,盈利者收割利润,且其它参与者入场。趋势回调代表好的买入机会,通常是由主力获利离场导致。如果行情在回调后回归上行, 指标将
Currency Strength Exotics
Bernhard Schweigert
4.88 (33)
目前8折优惠! 对任何新手或专家交易者来说都是最好的解决方案! 这个指标是专门用来显示任何符号的货币强度,如异国货币对、商品、指数或期货。它是同类产品中的第一个,任何符号都可以添加到第9行,以显示黄金、白银、石油、DAX、US30、MXN、TRY、CNH等的真实货币强度。这是一个独特的、高质量的、负担得起的交易工具,因为我们已经纳入了一些专有的功能和一个新的公式。想象一下,你的交易将如何改善,因为你能够准确地确定新趋势或剥头皮机会的触发点? 用户手册:点击这里   https://www.mql5.com/en/blogs/post/708876 它适用于所有时间框架。你将很快能够看到TREND! 根据新的基础算法设计,它使识别和确认潜在交易变得更加容易。这是因为它以图形方式显示了8种主要货币和一种符号的强弱。 该指标显示了8种主要货币(澳元加元瑞士法郎欧元英镑日元新西兰美元)的强弱线,再加上一个符号! 该指标显示了符号的真实价值。例如:对于XAUUSD(黄金):价格以美元报价。如果黄金在上涨,你怎么能知道是黄金的强势还是美元的弱势?只有当黄金走强时,我们才会进行交易。该指
Zoryk Gold mt4
Reda El Koutbane
联系我获取推荐设置 首发名额有限 ZORYK — MetaTrader 4 专业 XAUUSD 黄金信号与交易计划系统 你一定经历过这种感觉。 你花时间分析黄金,等待入场,终于打开交易后,价格却立即向相反方向移动。你过早平仓,移动止损,或者因为犹豫几秒而错过机会。随后市场在没有你的情况下,准确到达你最初预期的目标。 问题并不总是方向错误。 真正的问题是不确定性。 你不知道真正的入场位置在哪里,不知道交易逻辑在什么位置失效,也不知道应该先保护较小的利润,还是继续等待更大的行情。你甚至不知道当前信号是否足够强,还是自己只是在勉强寻找一笔交易。 黄金移动速度非常快。没有明确计划的正确判断,也可能在几秒钟内变成错误决定。 ZORYK 正是为了解决这个问题而开发。 什么是 ZORYK ZORYK 是一套专门为 MetaTrader 4 和 XAUUSD M5 周期开发的完整黄金信号与交易计划系统。 它不是一个只显示 BUY 或 SELL 箭头,然后让你独自处理所有后续决定的普通指标。 每个确认信号都可以在图表上显示完整交易结构,包括入场位置、止损、第一止盈、主要止盈、
Cycle Sniper
Elmira Memish
4.39 (36)
Please contact us after your purchase and we will send you the complimentary indicators to complete the system Cycle Sniper is not a holy grail but when you use it in a system which is explained in the videos, you will feel the difference. If you are not willing to focus on the charts designed with Cycle Sniper and other free tools we provide, we recommend not buying this indicator. We recommend watching the videos about the indiactor and system before purchasing. Videos, settings  and descri
Supply and Demand Dashboard PRO
Bernhard Schweigert
4.81 (21)
目前八折优惠! 这个仪表板是一个非常强大的软件,可用于多个符号和多达9个时间段。 它是基于我们的主要指标(最佳评论:高级供应需求)。 Advanced Supply Demand 该仪表板提供了一个伟大的概述。它显示。   筛选后的供需值,包括区域强度评级。 区间内和区间外的点位距离。 它突出了嵌套的区域。 在所有(9个)时间段内,它对所选符号发出4种警报。 它是高度可配置的,以满足您的个人需求! 您的利益! 对每个交易者来说,最重要的问题是。 什么是入市的最佳水平? 在强大的供应/需求区域内或附近进入你的交易,以获得最佳的成功机会和风险/回报。 我的止损的最佳位置是哪里? 把你的止损放在强势供应/需求区的下方/上方是最安全的。 我的最佳盈利目标是什么? 你的退出策略和你的进入策略一样重要,了解更高的时间框架图可以帮助你。对于买入,使用下一个供应区作为目标,对于卖出,使用下一个需求区作为目标。在回撤到供应区或需求区时进场,以确保有足够的利润空间,达到更高的时间框架的供应和需求,将增加你的利润。 为什么我们要过滤强区和弱区? 不平衡性越大,价格的变动就
ORB Seeker
Marcela Goncalves De Oliveira
特价上市! 仅售 79 美元! 售出 10 件后价格将上涨,最终价格为 199 美元。 购买后联系我,即可获得免费的EA奖励,该EA可以全自动交易突破信号,并拥有优化的设置文件。 自信地捕捉干净利落的比赛片段! ORB Seeker 是一款专业的开盘区间突破 (ORB) 指标,专为追求准确性、简洁性、灵活性和清晰图表结构的交易者而设计。 它能自动绘制任何交易品种的盘前或自定义交易时段区间,然后给出清晰的突破信号,包括入场点、止损点、止盈点以及可选的50%部分止盈位。所有数据均实时计算并直接显示在图表上。 您可以选择交易伦敦开盘、纽约交易时段、亚洲交易时段,或者您自定义的交易时段。ORB Seeker 会根据您选择的交易时段自动调整,让您精准掌握市场波动范围、突破位和交易位的位置。 每次购买均免费赠送 ORB Seeker EA 智能交易系统。该 EA 系统读取指标的突破信号并可自动下单,您可以选择手动交易,也可以让 EA 系统根据指标的信号逻辑自动处理入场。   为什么选择 ORB Seeker 支持多个交易时段 - 您可以自行设置伦敦、纽约、亚洲或自定义交易时段的盘前交易时间和交
DayTrader PRO DayTrader PRO 是一款先进的交易指标,它结合了约翰·埃勒斯 (John Ehlers) 的 Laguerre 滤波器与强大的自动优化引擎。该指标不依赖固定的参数,而是根据最新的市场状况自动搜寻最佳设置,帮助您在无需手动调整的情况下适应不断变化的市场波动。 该指标可生成清晰的买入 (BUY) 和卖出 (SELL) 信号,并提供根据当前市场波动率计算得出的自适应止损 (Stop Loss) 和止盈 (Take Profit) 水平。内置的趋势、效率系数 (Efficiency Ratio)、波动率和蜡烛图过滤功能,有助于剔除低质量的交易设置,从而提高信号的准确性。 实时性能面板会显示当前已优化的设置、利润因子 (Profit Factor)、胜率 (Win Rate)、回撤 (Drawdown) 以及其他交易统计数据。DayTrader PRO 还支持弹出窗口、推送、邮件和声音提醒,确保您不会错过任何交易机会。 主要功能 全自动参数优化 自适应买入与卖出信号 基于 ATR 的动态止损与止盈 支持每日、每周或每月重新优化 内置趋势与市场过滤功能 性能统
Gold Pro Scalper
Aleksandr Makarov
4.8 (5)
Gold Pro Scalper Precise entry points for currencies, crypto, metals, stocks, indices! Indicator 100% does not repaint!!! If a signal appeared, it does not disappear! Unlike indicators with redrawing, which lead to loss of deposit, because they can show a signal, and then remove it. Trading with this indicator is very easy. Wait for a signal from the indicator and enter the deal, according to the arrow  (Blue arrow - Buy, Red - Sell). I recommend using it with the Trend Filter (download
BlueDigitsFx Easy 1 2 3 System
Ziggy Janssen
4.87 (299)
BlueDigitsFx 官方生态系统入口 获取基础设施更新、交易资源、产品发布信息以及 BlueDigitsFx 官方生态系统访问权限。 Telegram 生态系统 官方网站 MT5 版本 BlueDigitsFx Easy 123 System —— 强大的 MT4 反转与突破识别系统 一体化无重绘交易系统,专为识别市场反转与突破而设计 —— 适合重视市场结构、清晰信号以及确认型交易流程的交易者。 BlueDigitsFx Easy 123 System 是一款可视化 MT4 指标,并带有提醒功能,可帮助交易者轻松识别市场结构变化、突破以及趋势反转。 该指标遵循结构化的“123”交易模型: 步骤 1 :通过大箭头识别潜在衰竭区域中的新高或新低。 步骤 2 :发出市场结构突破信号,确认潜在趋势反转。 步骤 3 :通过小箭头和支撑/阻力点提供入场确认。 注意 :大箭头在K线收盘前可能会重绘,因为它会根据实时市场结构变化进行调整。 小箭头一旦出现后则为 100% 无重绘信号。 功能特点 大箭头:识别强烈的市场结构变化及潜在反转机会。 小箭头:100% 无重绘趋势信号。 支撑与阻力点
Day Trader Master
Oleg Rodin
5 (15)
Day Trader Master 是一个完整的日间交易者交易系统。该系统由两个指标组成。一个指标是买入和卖出的箭头信号。这是你得到的箭头指示器。我将免费为您提供第二个指标。第二个指标是专门设计用于与这些箭头结合使用的趋势指标。 指标不重复也不迟到! 使用这个系统非常简单。您只需按照当前趋势方向的箭头信号,显示为双色线。蓝色是买入趋势。红色是一种销售趋势。蓝色箭头是买入信号。红色箭头是卖出信号。您需要箭头的颜色和信号的方向来匹配趋势线的颜色。 箭头指标主要是为 M5 和 M15 时间间隔的日内交易而创建的。但从技术上讲,该系统可以用于其他时间间隔。 指示器配备带有推送消息功能的弹出警报。 购买后一定要写信给我!我将为您提供与系统交易的个人建议,以及我的趋势指标。此外,还有丰厚的奖励等着您!
Smart Phase Box (SPB) — Indicator Description Smart Phase Box automatically locates consolidation zones (bases, flats) on the chart and analyzes the candle microstructure inside each zone — wicks, tick volume, body-to-range ratio, and where price closes relative to the zone — to estimate whether the zone looks more like accumulation (buyers absorbing supply) or distribution (sellers absorbing demand), based on classic Wyckoff / Smart Money concepts. MT5-version:  https://www.mql5.com/en/market/p
Gold Trend M1
Van Minh Nguyen
Gold Trend M1 - Optimized Scalping Tool for Gold (XAUUSD) Gold Trend M1 is a high-frequency trading indicator for the MetaTrader 4 platform, specifically optimized for the M1 timeframe on the Gold market. It combines a powerful SuperTrend trend filter with buy/sell signals derived from Heiken Ashi calculation logic, helping traders identify precise and disciplined entry points for optimal trading performance. Key Features Optimized for M1 Scalping: Specifically developed for high-speed scalping
Special offer : ALL TOOLS , just $35 each! New tools   will be   $30   for the   first week   or the   first 3 purchases !  Trading Tools Channel on MQL5 : Join my MQL5 channel to update the latest news from me 多时间框架的体积订单块 指标是一个为寻求通过识别重要市场参与者积累订单的关键价格区域来深入洞察市场行为的交易者设计的强大工具。这些区域称为体积订单块,可以作为潜在的支撑和阻力区,为明智的交易决策提供重要的优势。 查看MT5版本:  Volumetric Order Blocks MT5 Multi Timeframe See more products at:   https://www.mql5.com/en/users/ndhsfy/seller 核心功能 1. 自动检测体积订单块 该指标标注了积累买入或卖出订单的重要价格水平,提供两种不同类型: 看涨体积订单块
Market Structure Break Out
Ashkan Hazegh Nikrou
5 (8)
价格将于明天上涨至 119 美元 。 Market Structure Break Out(MSB) 是一款为 MT4 和 MT5 平台 设计的高级工具,帮助交易者以结构的角度观察市场走势。它通过箭头和警报提示,标示出趋势方向和反转方向的关键 交易信号 。 其一大亮点功能是能够绘制 持续的供需区域 ,让交易者清晰了解关键价格区域。此外, 实时回测功能 使用户能够在图表上直接查看该指标在历史中的表现,增强了信号的透明度与可信度。 领取您的免费EA: 获取免费的 Market Structure Breakout EA ,它可以根据突破箭头自动开仓,使用固定手数,并可自定义止损和止盈水平。 如何领取: 点击此处下载 EA 。请注意,此 EA 仅在您已购买 Market Structure Break Out 指标 后才能使用。 MT5 版本的产品在此: https ://www .mql5 .com /en /market /product /124690 该指标正在持续更新。 我们努力提供基于市场结构的高精度进场和出场点。当前版本为1.6,以下是最新的更新内容,欢迎加入我们: 买
TrendMaestro
Stefano Frisetti
4 (4)
Attention: beware of SCAMS, TRENDMAESTRO is only ditributed throught MQL5.com market place. note: this indicator is for METATRADER4, if you want the version for METATRADER5 this is the link:  https://www.mql5.com/it/market/product/108106 TRENDMAESTRO ver 2.5 TRENDMAESTRO recognizes a new TREND from the start, he never makes mistakes. The certainty of identifying a new TREND is priceless. DESCRIPTION TRENDMAESTRO identifies a new TREND in the bud, this indicator examines the volatility, volumes a
CRT Candle Range Theory HTF MT4.   Ultimate CRT Indicator: Advanced ICT Concepts and Malaysian SnR Trading System Master the Market Maker's Footprints with the Most Advanced Candle Range Theory Indicator Unlock the true power of  Smart Money Concepts (SMC)  and trade precisely like the institutions with the  Ultimate CRT Indicator . Built exclusively for serious traders, this indicator automates the highly effective  Candle Range Theory (CRT) , a core pillar of  ICT Concepts (Inner Circle Trader
本产品已针对 2026 年市场进行更新,并针对最新 MT5 版本进行了优化。 价格更新通知: Smart Price Action Concepts 目前价格为 $200 。 接下来的 30 次购买 后,价格将上涨至 $299 。 特别优惠: 购买后,请发送私信给我,即可领取 免费赠品 + 礼物 。 首先需要强调的是,这款交易工具是不重绘、不回绘、不延迟的指标,因此非常适合专业交易使用。 Online course , and manual Smart Price Action Concepts 指标是一款非常强大的工具,适合新手和有经验的交易者使用。它将 20 多个实用指标整合到一个系统中,结合了 Inner Circle Trader Analysis 和 Smart Money Concepts Trading Strategies 等高级交易理念。该指标专注于 Smart Money Concepts,帮助交易者理解大型机构如何交易,并辅助预测其市场行为。 它特别擅长流动性分析,使交易者更容易理解机构交易逻辑。它也非常适合预测市场趋势并仔细分析价格走势。通过让交易与机构策略保
PZ Day Trading
PZ TRADING SLU
3.67 (3)
该指标仅使用价格行为分析和donchian渠道以锯齿形检测价格反转。它是专门为短期交易而设计的,根本不需要重新粉刷或补漆。对于精明的交易者来说,这是一个绝佳的工具,旨在增加他们的运作时间。 [ 安装指南 | 更新指南 | 故障排除 | 常见问题 | 所有产品 ] 极易交易 它在每个时间段都提供价值 实施自我分析统计 它实现了电子邮件/声音/视觉警报 基于可变长度的突破和拥挤区域,该指标仅使用价格行为来选择交易并对市场快速做出反应。 显示过去信号的潜在利润 该指标分析其自身的质量和性能 突围的损失突出显示并解决 该指标是不可重涂和不可重涂的 该指标将帮助盘中交易者不要错过单个价格反转。但是,并非所有价格反转都是一样的,也不是具有相同的可行质量。决定要突破哪些突破而忽略哪些取决于交易者的良好判断。 如何解释统计数据 该指标研究其自身信号的质量,并在图表上绘制相关信息。将分析每笔交易,并在图表的左上角显示总体历史结果,这使您可以针对任何给定的工具和时间范围自行优化指标参数。每个乐器和时间表都有其自己的最佳设置,您可以自己找到它们。 最大优惠交易:对于任何给定的交易,MFE都是最好的结
作者的更多信息
CRT Pro Scanner MT4
Frank Jose Olivo Flores
CRT Pro Scanner ===============   Stop wasting hours watching multiple charts and missing setups while you blink. CRT Pro Scanner solves the most painful problem every trader faces: being in the wrong chart at the right moment. Instead of jumping between pairs and constantly asking yourself "did I miss something?", the scanner does the watching for you. It monitors all your symbols simultaneously, detects Candle Range Theory setups the instant they form, and alerts you immediately — so you can
CRT Pro Scanner
Frank Jose Olivo Flores
CRT Pro Scanner ===============   Stop wasting hours watching multiple charts and missing setups while you blink. CRT Pro Scanner solves the most painful problem every trader faces: being in the wrong chart at the right moment. Instead of jumping between pairs and constantly asking yourself "did I miss something?", the scanner does the watching for you. It monitors all your symbols simultaneously, detects Candle Range Theory setups the instant they form, and alerts you immediately — so you can
Draws high of the day and low of the day anchored VWAPs for multiple days.                   DaysBack = Today only, today + 1 day back, today + 2 days back...               Today recalculates live                             Historical days are computed ONCE and frozen (static).                Colors tab shows exactly 2 entries:                                  High of the day VWAP color  (default: Green)                                   Low of the day VWAP color  (default: Red)               
Anchored VWAP with StdDev MT4
Frank Jose Olivo Flores
HOW TO USE                                                       1. Drag the indicator onto any chart.                            2. Set AnchorDate (YYYY.MM.DD) and AnchorTime (HH:MM) to the        bar where you want the VWAP to start calculating from.        3. The VWAP line and up to 3 standard deviation bands will          appear from that anchor point to the current bar.             MULTIPLE INSTANCES                                                Set a different IndicatorID (e.g. 1, 2, 3
VWAP Trend Dashboard MT4
Frank Jose Olivo Flores
# VWAP Trend Dashboard  --- ## What It Does Displays a compact dashboard on any MT5 chart showing the **VWAP-based bias** for up to **5 symbols simultaneously**. For each symbol it checks the current price against four VWAP levels and summarises the overall directional bias in a single Trend column. --- ## Dashboard Columns | Column | What It Means | |---|---| | **Symbol** | Your custom display label | | **NY VWAP** | VWAP anchored at NY session open today | | **Day VWAP** | VWAP anchored
Trading Stats MT4
Frank Jose Olivo Flores
Stop wasting time digging through MT4/MT5 account statements to understand how your trading is performing. The Trading Stats Indicator puts every number you need — Win Rate, Avg Profit, Avg Loss, Risk:Reward Ratio, Expected Value, and Total Profit — right on the chart, updated live with every tick. Why Trading Stats Exists? Every serious trader eventually asks the same questions at the end of a session: How many trades did I take today? What was my average winner versus my average loser? Do I a
CRT Pro WHAT PROBLEM DOES CRT PRO SOLVE? --------------------------------- When trading on low timeframes such as M1, M5, M15 or M30, it is easy to lose sight of the broader market structure. CRT Pro solves this  by overlaying H1 candles and H4 High/Low range lines directly behind your  low timeframe chart, in real time, so you always know where the higher timeframe market structure sits relative to current price — without switching charts or opening multiple windows. -----------------------
Draws high of the day and low of the day anchored VWAPs for multiple days.                   DaysBack = Today only, today + 1 day back, today + 2 days back...               Today recalculates live                             Historical days are computed ONCE and frozen (static).                Colors tab shows exactly 2 entries:                                  High of the day VWAP color  (default: Green)                                   Low of the day VWAP color  (default: Red)               
VWAP Trend Dashboard
Frank Jose Olivo Flores
# VWAP Trend Dashboard  --- ## What It Does Displays a compact dashboard on any MT5 chart showing the **VWAP-based bias** for up to **5 symbols simultaneously**. For each symbol it checks the current price against four VWAP levels and summarises the overall directional bias in a single Trend column. --- ## Dashboard Columns | Column | What It Means | |---|---| | **Symbol** | Your custom display label | | **NY VWAP** | VWAP anchored at NY session open today | | **Day VWAP** | VWAP anchored
Trading Stats
Frank Jose Olivo Flores
Stop wasting time digging through MT4/MT5 account statements to understand how your trading is performing. The Trading Stats Indicator puts every number you need — Win Rate, Avg Profit, Avg Loss, Risk:Reward Ratio, Expected Value, and Total Profit — right on the chart, updated live with every tick. Why Trading Stats Exists? Every serious trader eventually asks the same questions at the end of a session: How many trades did I take today? What was my average winner versus my average loser? Do I a
Opening Range Pro
Frank Jose Olivo Flores
Opening Range Pro WHAT DOES THIS INDICATOR DO? The Opening Range indicator marks the highest and lowest price reached during a specific time window that you define (for example, the first 15 minutes of the New York session). Once that window closes, it draws two horizontal lines — one at the high and one at the low — extending across the rest of the trading day, so you can see at a glance whether price is above or below the range, and use those levels as reference for your trading decisions.
CRT Pro Candle Range Theory
Frank Jose Olivo Flores
CRT Pro WHAT PROBLEM DOES CRT PRO SOLVE? --------------------------------- When trading on low timeframes such as M1, M5, M15 or M30, it is easy to lose sight of the broader market structure. CRT Pro solves this  by overlaying H1 candles and H4 High/Low range lines directly behind your  low timeframe chart, in real time, so you always know where the higher timeframe market structure sits relative to current price — without switching charts or opening multiple windows. -----------------------
筛选:
无评论
回复评论