SupplyDemandZoneLines
- 지표
- 버전: 1.2
- 업데이트됨: 12 5월 2025
- 활성화: 5

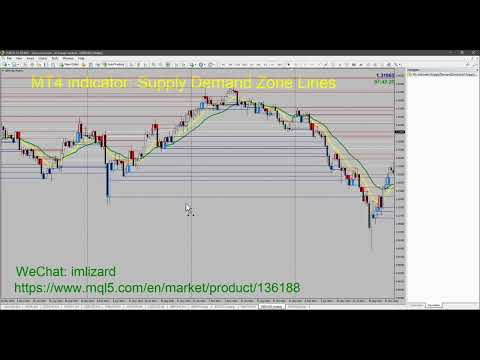
공급 및 수요 구역 주요 가격 지표
배경
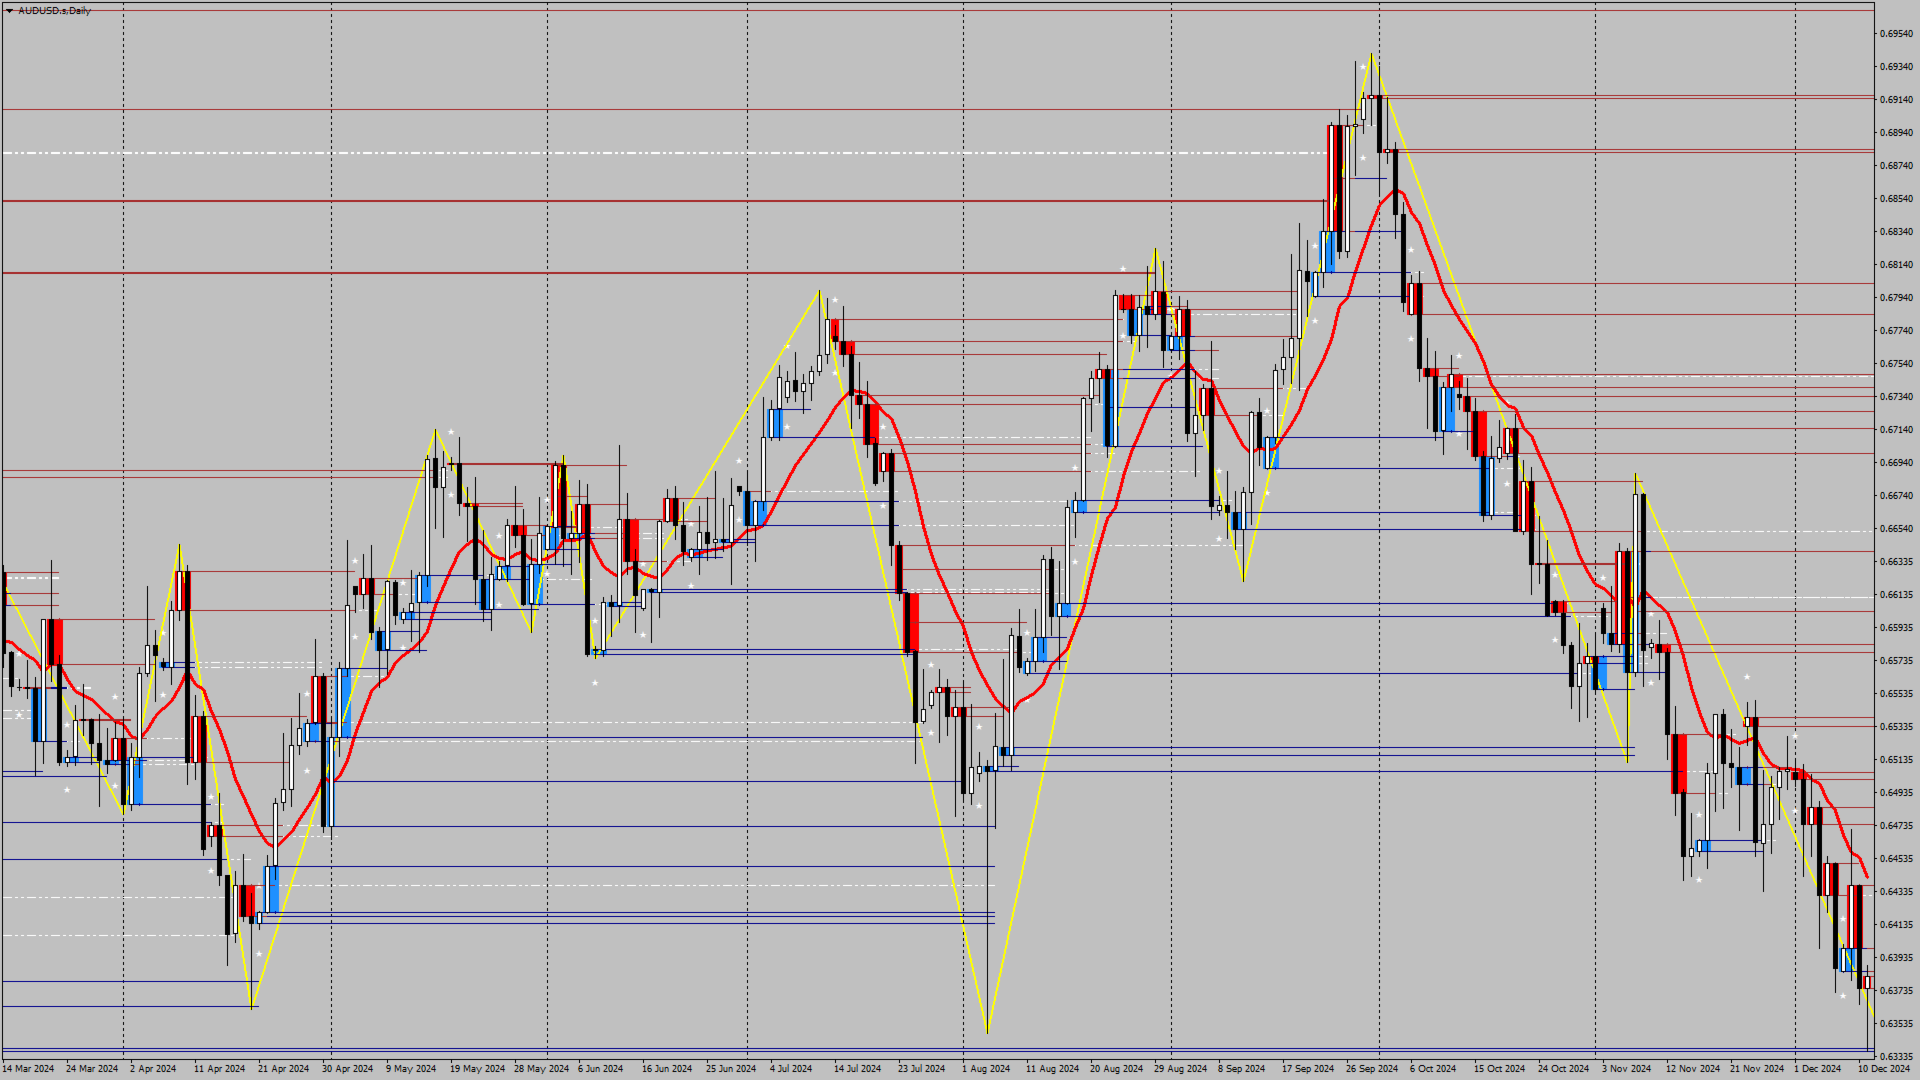
시스템은 K-라인에서 자동으로 공급 및 수요 영역을 검색하고 실시간 주요 가격선을 그립니다. 거래자는 가격 거래선을 기준으로 거래할 수 있습니다.
주요 특징
시스템은 K-라인의 공급 및 수요 지역을 자동으로 검색합니다. 이 시스템은 또한 실시간 주요 가격선을 도출하고, 거래자는 가격 거래선을 기준으로 거래할 수 있습니다. 따라서 공급과 수요 구역 전략을 사용하는 거래자는 더 이상 공급과 수요 구역의 징후를 찾는 데 시간을 허비할 필요가 없습니다. 대신, 그들은 공급과 수요 영역 및 주요 가격에 대한 가격 반응에 집중하고 이에 맞는 거래 전략을 개발할 수 있습니다.
하지만 공급과 수요 구역 전략 자체는 변동성이 큰 기간 동안 더욱 효과적인 전략이므로 시장이 강한 추세를 보일 때는 주의해서 사용하거나 지표가 제시하는 제안을 추세 방향으로 사용해야 합니다.
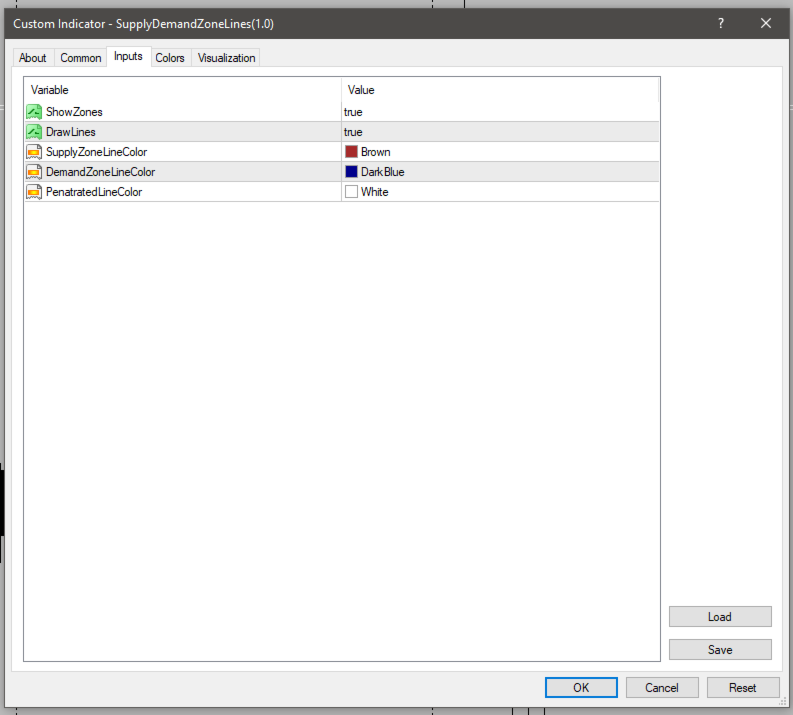
범위
ShowZones: 공급 및 수요 구역을 표시할지 여부
DrawLines: 주요 가격을 표시할지 여부
SupplyZoneLineColor: 공급 구역 가격선 색상
DemandZoneLineColor: 수요 구역 가격선 색상
PenatratedLineColor: 침투된 가격선의 색상
구현하다
차트에 지표를 붙이기만 하면 됩니다.
귀하의 소중한 피드백을 통해 지표를 개선할 수 있도록 노력하겠습니다.
문의사항이 있으시면 WeChat: imlizard로 연락주세요.