RaysFX Strategy
- 指标
- 版本: 1.40
- 更新: 20 二月 2024
- 激活: 5

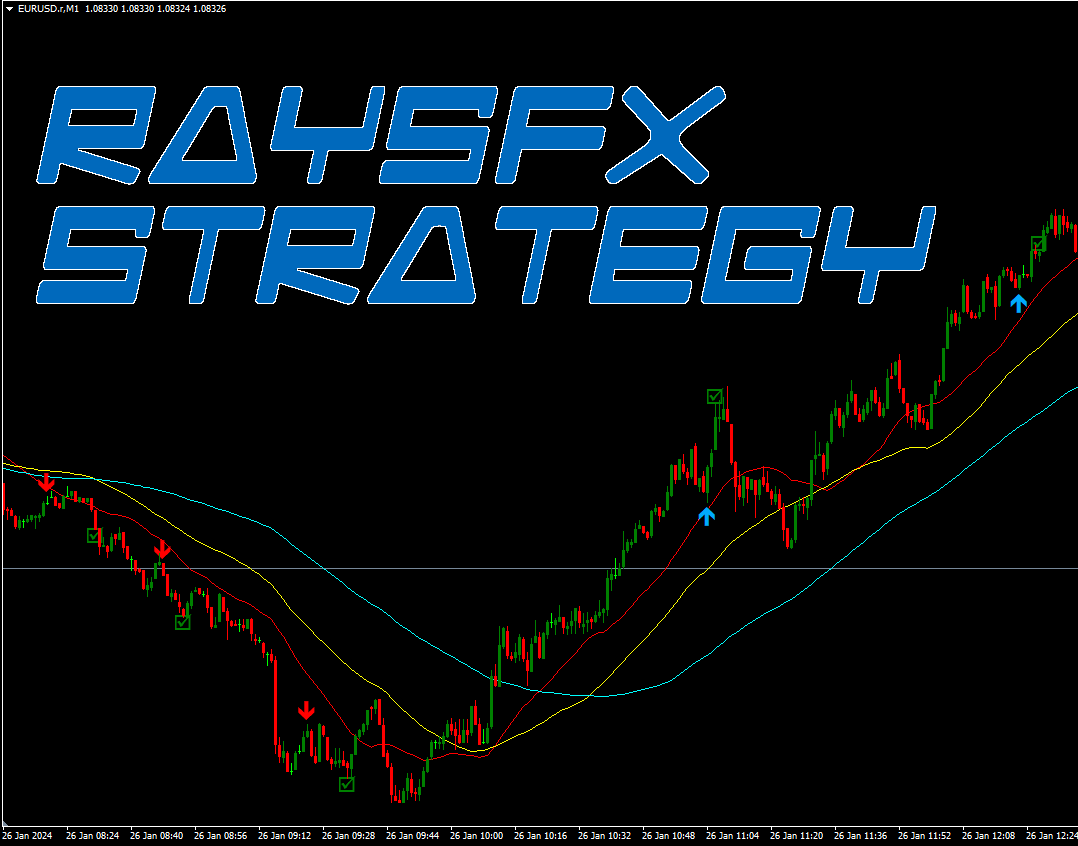
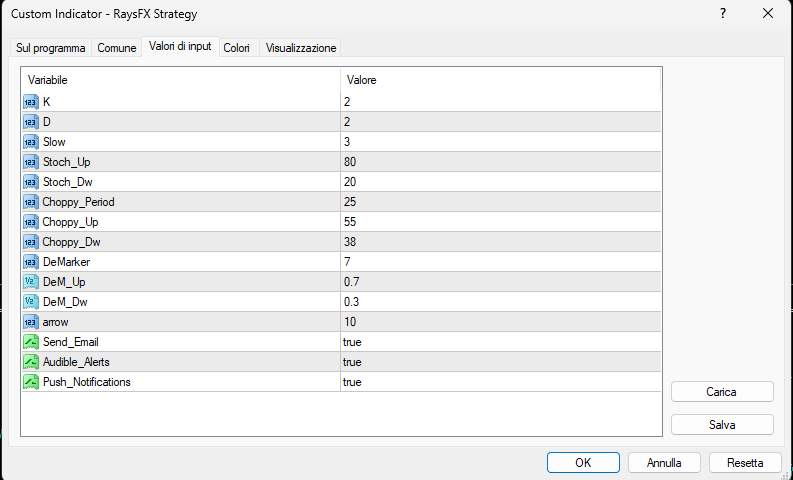
RaysFX Strategy è un sofisticato strumento di trading che genera segnali di ACQUISTO e VENDITA basati su una combinazione di quattro indicatori tecnici: 3 SMA (Simple Moving Average), 1 StochasticRSI, 1 Choppy, e 1 DeMarker.
Only M1 TimeFrame!
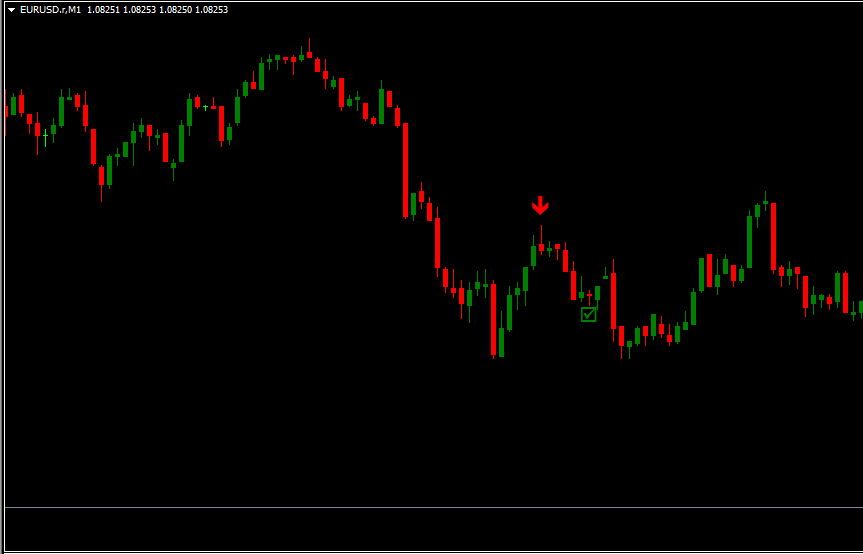
**Segnale di VENDITA**
Quando la candela precedente è sotto i 3 SMA, sopra il livello 80 dello Stochastic, sotto il livello 38 del Choppy e sopra il livello 0.3 del DeMarker, l'indicatore genera un segnale di VENDITA, rappresentato da una freccia rossa.
**Segnale di ACQUISTO**
Viceversa, quando la candela precedente è sopra i 3 SMA, sotto il livello 20 dello Stochastic, sotto il livello 38 del Choppy e sotto il livello 0.7 del DeMarker, l'indicatore genera un segnale di ACQUISTO, rappresentato da una freccia blu.
**Segnale di CHIUSURA**
Per quanto riguarda la chiusura dell'ordine, l'indicatore crea un segno di spunta verde esattamente quando il DeMarker incrocia il livello 0.7 (per un ordine di ACQUISTO ) o 0.3 (per un ordine di VENDITA ). Questo segnale di chiusura dell'ordine aiuta a proteggere i tuoi profitti e a limitare le perdite.
Per un corretto funzionamento dovrete scaricare anche questo indicatore: https://www.mql5.com/it/market/product/112270 (StochRSI) altrimenti l'indicatore non funzionerà.