Royal Blue Forex Strategy
- 指标
- 版本: 1.0
- 激活: 5

Swing trading is a method in which traders attempt to take advantage of market fluctuations. They buy a security when they believe the market will rise and sell if they feel the market will fall, which, as you can imagine, is common in most trading strategies, irrespective of trading style.
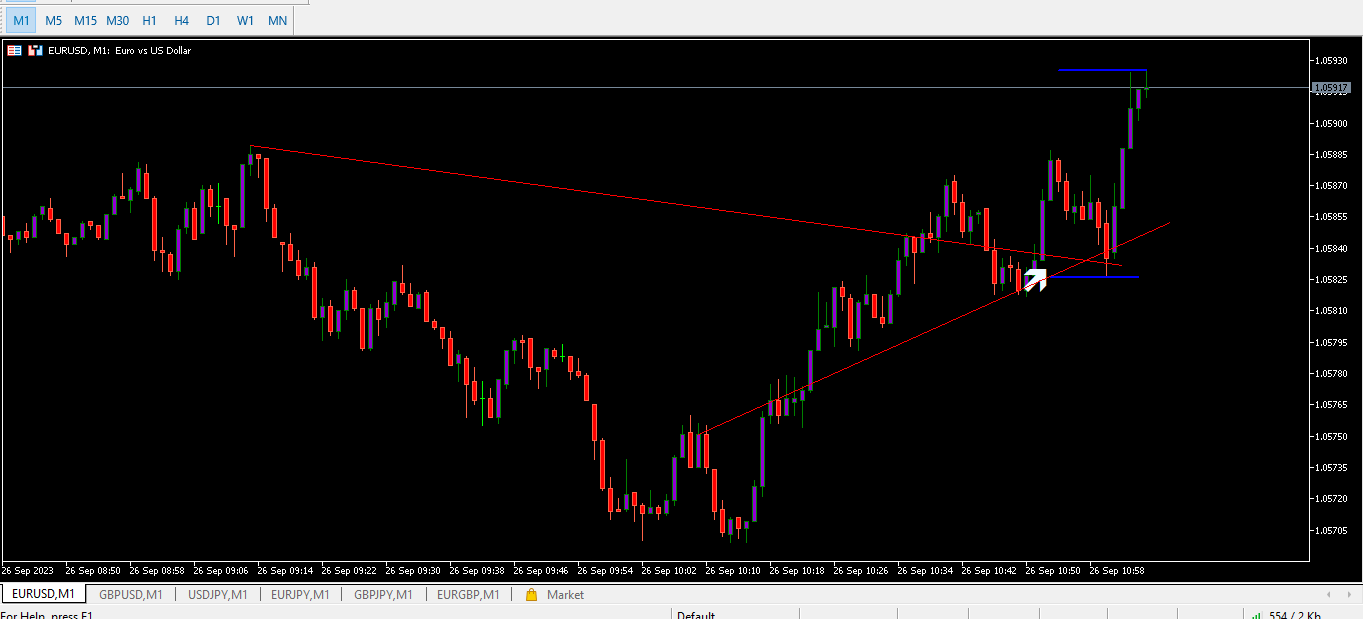
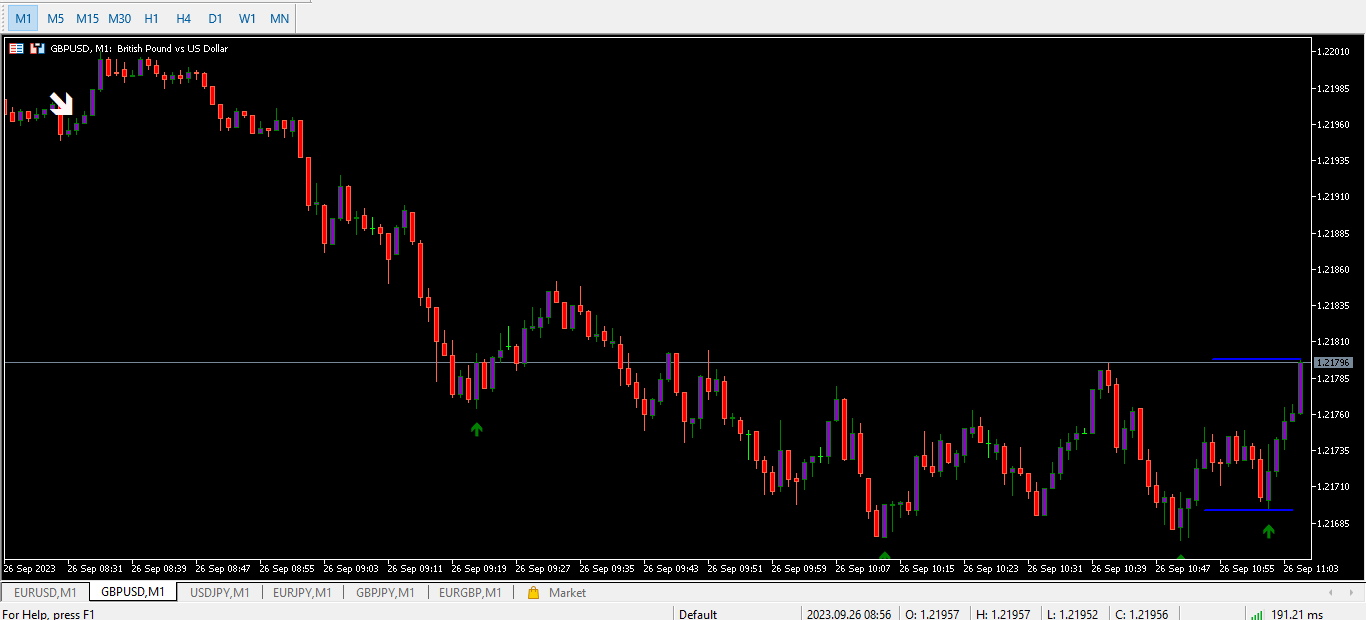
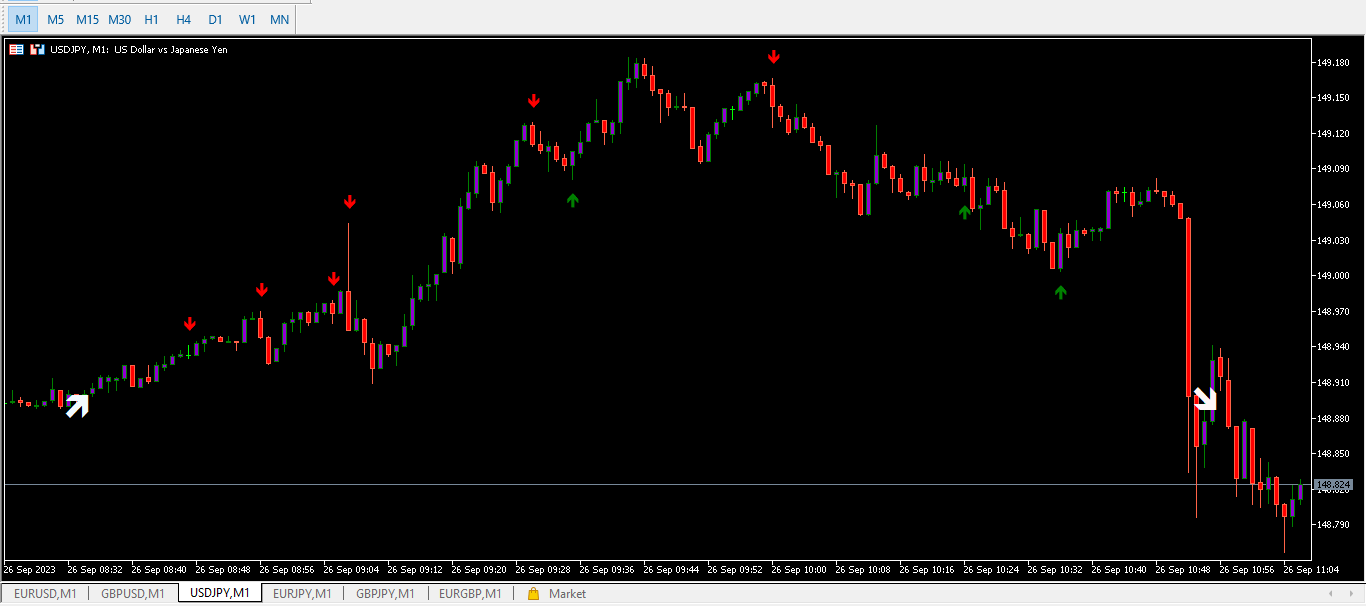
The four most frequently occurring patterns in the swing trading domain are reversal, retracement (or pullback), breakouts, and breakdowns.
FOR MORE INFO Message Us
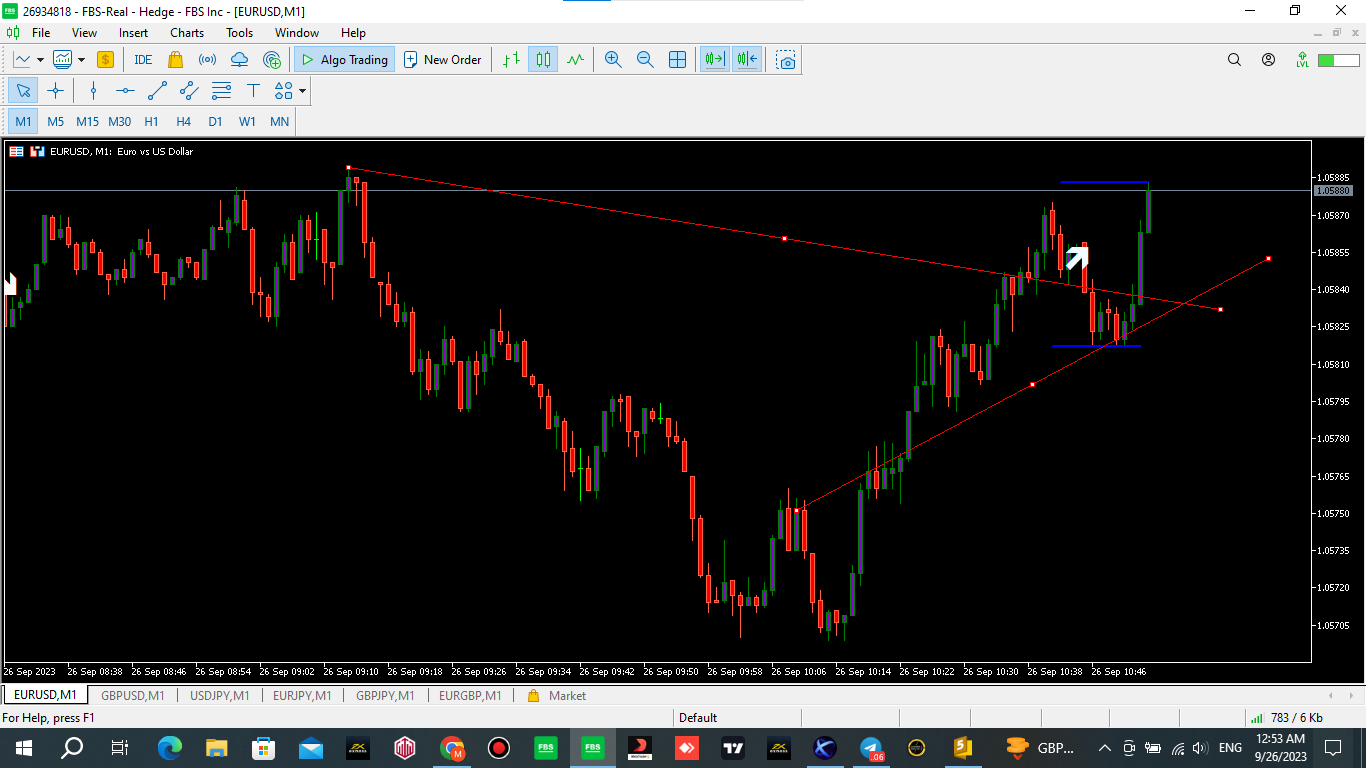
Work All currency pair,
work all timeframe
100%non repaint, no delays instant arrow appear
THANK YOU
FOR MORE INFO Message Us
Work All currency pair,
work all timeframe
100%non repaint, no delays instant arrow appear
THANK YOU