 MetaTrader 5
 专家
专家
 指标
指标
 程序库
程序库
 实用工具
实用工具
 窗口小部件
窗口小部件
 规则
规则
适用于MetaTrader 5的新技术指标 - 187
 技术指标的信号外汇和股票市场的开仓交易和平仓交易起着至关重要的作用。指标的本质就是一种交易品种的数学转换,旨在预测未来的价格变化。
测试技术指标可以更有利于预测市场行为并从中获利。
技术指标的信号外汇和股票市场的开仓交易和平仓交易起着至关重要的作用。指标的本质就是一种交易品种的数学转换,旨在预测未来的价格变化。
测试技术指标可以更有利于预测市场行为并从中获利。 
我们的指标将提供一个价差筛选器来同时监控多对的价差,并且蜡烛计时器倒计时显示当前柱关闭和新柱形成之前的剩余时间。
限时优惠:我们所有的溢价指标仅售 50 美元,通过访问我们的 MQL5 博客,您将找到我们溢价指标的所有详细信息。 点击这里。
主要特征 我们的指标将提供一个价差筛选器来同时监控多对的价差,并且蜡烛计时器倒计时显示当前柱关闭和新柱形成之前的剩余时间。
监控多对同时传播。 跟踪服务器时间,而不是本地时间。 可配置的文本颜色和字体大小 优化以减少 CPU 使用率 个性化的配对列表。
接触 如果您有任何问题或需要帮助,请通过私信联系我。
警告 警告 我们所有的指标和工具只能通过官方 Metatrader 商店 (MQL5 市场) 获得。
作者 SAYADI ACHREF,金融科技软件工程师和 Finansya 创始人
FREE
具有双线信号、零水平系统、多时间框架支持、可自定义视觉信号和高度可配置警报系统的高级相对活力指数(RVI)指标。
自由编程服务、更新和其他 TrueTL 产品可在我的 MQL5 资料页 上获取。
非常感谢您的反馈和评价!
什么是相对活力指数(RVI)? 相对活力指数(RVI)是由 John Ehlers 开发的动量振荡器,通过将收盘价与开盘价进行比较(以交易区间为标准化基准),来衡量近期价格走势的可信度。其基本原理是:在牛市中,收盘价往往高于开盘价;而在熊市中则相反。 RVI 在零线附近振荡——正值表示看涨动量,负值表示看跌动量。该指标由两条线组成:主线(RVI 值)和信号线(主线的 4 根K线对称加权移动平均线)。两条线之间的交叉通常被用作进场和出场信号。 功能: 具有零水平参考系统的双线 RVI(主线和信号线) 具有三个独立可配置信号缓冲区的视觉信号标记(箭头、垂直线) 高级信号检测:方向变化、线交叉、级别交叉、两条线的峰值/谷值 可配置的警报功能(电子邮件、推送、声音、弹出窗口),带有时间范围过滤 带插值的多时间框架(MTF)、多种颜色模式以及用于 EA 集成的 iCust
FREE

直接在您的 MetaTrader 5 图表上看到您正在哪个外汇交易时段交易,以及每个时段走了多少点(pips)。 KT Forex Sessions MT5 是一款交易时段指标,它用彩色方框画出东京、伦敦和纽约时段,并把每个时段的波动幅度以点数写在它的方框上。 指标会自动读取您经纪商的 GMT 时差,每个时段都按照所在城市的当地时间和夏令时运行。方框全年都在正确的位置,无需任何设置。 您在图表上看到的内容 每个方框上的点数: 在您交易的每个货币对上,一眼就能分清平静的时段和活跃的时段。 无需换算时区: 不用查 GMT 时差,春季和秋季调整时钟时也不用做任何更改。 重叠时段有自己的方框: 伦敦和纽约同时开盘的几个小时,有一个单独的紫色方框。 正在进行的时段实时扩展: 它的方框跟随每一个新高和新低,直到时段结束,它的标签实时计算点数。 下一个时段以虚线方框显示: 在东京、伦敦和纽约时段开盘之前,您就能看到它们的位置。 显示时间的面板: 您经纪商的时钟、当前时段及其收盘剩余时间,以及距离每个下一个时段开盘的时间。 五个时段,样式由您选择: 悉尼、东京、法兰克福、伦敦和纽约,每个都可以显示为填
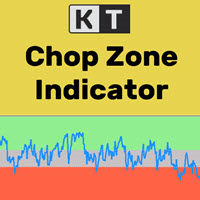
众所周知,金融市场只有大约30%的时间处于趋势状态,其余70%的时间都在区间震荡。然而,大多数初学者交易者很难判断市场当前是处于趋势还是震荡区间。 KT Chop Zone 通过将市场状态清晰地划分为三个区域:看跌区、看涨区和震荡区(Chop Zone),有效地解决了这个问题。
功能特点
通过避免在震荡行情中交易(Chop Zone),即时提高您的交易表现。 也可以用作离场信号。例如,当市场进入震荡区时,您可以选择平掉多单离场。 完全支持自动交易系统(EA),可轻松集成至您的EA中优化交易策略。 包含所有 MetaTrader 平台的提醒功能。
输入参数 主周期: 用于震荡指标的整数值。建议设置在10到30之间。 看涨区间值: 设置看涨区的参考值。 看跌区间值: 设置看跌区的参考值。 颜色设置 提醒设置
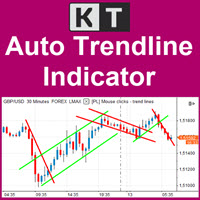
让关键趋势线随图表结构保持更新 KT Auto Trendline 根据近期 ZigZag 摆动点自动绘制上方和下方趋势线,并在当前图表上向前延伸。您无需反复手动画线,即可通过清晰的价格结构观察正在形成的突破、回落以及方向变化。 同时观察较近与更广的摆动结构 第一组趋势线默认启用,采用反应较快的 ZigZag 配置。需要更广的市场视角时,可以启用第二组趋势线,加入另一对具有独立灵敏度的上方和下方趋势线。这样便能在同一图表中比较较近的价格结构与更大的市场摆动。 控制每组趋势线的反应方式 Show First Trendline: 显示或隐藏主要的上方和下方延伸趋势线。 Depth、Deviation 和 Back Step: 调整第一组 ZigZag 识别摆动点的方式。 Show Second Trendline: 添加或移除可选的第二组上方和下方趋势线。 第二组灵敏度: 为更广或不同的摆动视角单独设置 Depth、Deviation 和 Back Step。 价格穿越延伸趋势线时及时获知 当价格向上穿越延伸的上方趋势线,或向下穿越延伸的下方趋势线时,指标可以发出提醒。您可组合使用弹窗、
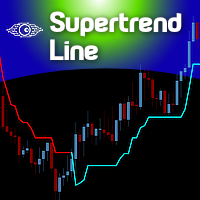
The Supertrend indicator was originally created by a french fellow named Olivier Seban , and its goal is to identify the Primary Trend of prices . Its calculation is easy and based on the average of Highs and Lows and then we add the volatility of a custom period, plus a multiplier. This way we get the Supertrend Line. You can find in the web several approaches and trading strategies using this very useful indicator.
HOW TO "READ" THIS INDICATOR
If the closing prices are above Supertrend Line,
FREE

The Analytical cover trend indicator is a revolutionary trend trading and filtering solution with all the important features of a trend tool built into one tool! The Analytical cover indicator is good for any trader, suitable for any trader for both forex and binary options. You don’t need to configure anything, everything is perfected by time and experience, it works great during a flat and in a trend.
The Analytical cover trend indicator is a tool for technical analysis of financial markets
Key Features: Multi-Target Volatility: Configure multiple Take Profit and Stop Loss levels based on real-time market volatility. Fully Customizable: Set specific volatility multipliers (e.g., 4x for Stop, 10x for Take) using any look-back period (e.g., previous 20 bars on a 2-minute chart). Clear Visuals: Assign unique names to each level to be displayed directly on your symbol's chart for easy monitoring. Consistency: Every level calculated is synchronized with the volatility of your chosen per
FREE
OBOS indicator
OBOS Indicator is an exclusive indicator to spot entries based on price action.
The OBOS Indicator is both effective and user friendly.
Indicator uses simple color codes and levels to indicate Overbought and Oversold conditions. No more headache.
The OBOS Indicator will only gives you indication when there are possible entries. Means you only get useful information.
Inputs of the indicator are:
MaxBars : number of bars to display in your chart Smoothing period : number of b

Tick imbalance bars (TIB), described in the book Advances in Financial Machine Learning (2018) by Marcos López de Prado. Indicator that show candlestick bars with an different sampling method than time fixed. Real time data is sourced to the indicator and it may be used as substitute of the default graph. Each bar is formed when a predefined tick balance is exceeded, showing in the graph the OHLC of this cluster of ticks. The input variable is the amount of ticks of each bar. The indicator may
FREE
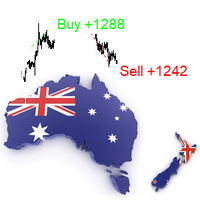
The indicator is a trading system for AUDUSD or NZDUSD currency pairs.
The indicator was developed for time periods: M15, M30.
At the same time, it is possible to use it on other tools and time periods after testing.
"Kangaroo Forex" helps to determine the direction of the transaction, shows entry points and has an alert system.
When the price moves in the direction of the transaction, the maximum length of the movement in points is displayed.
The indicator does not redraw, all actions occ
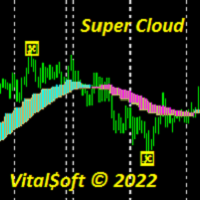
The Super Cloud indicator helps to determine the direction of the trend when trading. Shows on the chart signals about a possible upcoming trend change. The indicator provides an opportunity to detect various features and patterns in price dynamics that are invisible to the naked eye. Based on this information, traders can anticipate further price movement and adjust their strategy accordingly. Works on all timeframes except MN.

Trend Direction ADX indicator Trend Direction ADX is part of a serie of indicators used to characterize market conditions.
Almost any strategy only work under certain market conditions.
Therefore it is important to be able to characterize market conditions at any time: trend direction, trend strength, volatility, etc..
Trend Direction ADX is an indicator to be used to characterize trend direction:
trending up trending down ranging Trend Direction ADX is based on ADX standard indicator.
Tre

Trend Strength MA indicator Trend Strength MA is a part of a series of indicators used to characterize market conditions.
Almost any strategy only works under certain market conditions.
Therefore, it is important to be able to characterize market conditions at any time: trend direction, trend strength, volatility, etc.
Trend Strength MA is an indicator to be used to characterize trend strength:
Up extremely strong Up very strong Up strong No trend Down strong Down very strong Down extremely

Trend Direction Up Down Indicator Trend Direction Up Down is part of a series of indicators used to characterize market conditions.
Almost any strategy only works under certain market conditions.
Therefore it is important to be able to characterize market conditions at any time: trend direction, trend strength, volatility.
Trend Direction Up Down is an indicator to be used to characterize trend direction (medium term trend):
trending up trending down ranging Trend Direction Up Down is based
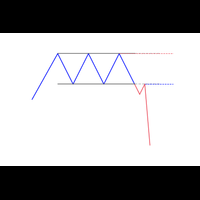
A new box will be added, if the closing price is higher than the maximum (lower than the minimum) of the current box series no less than for the specified value. Reversal will be made, if the closing price is higher (lower) than the last box on a value no less than the specified.
T his is a trend indicator and it can be used as an alternative for the trend definition instruments which use averaging.

KT Risk Reward shows the risk-reward ratio by comparing the distance between the stop-loss/take-profit level to the entry-level. The risk-reward ratio, also known as the R/R ratio, is a measure that compares the potential trade profit with loss and depicts as a ratio. It assesses the reward (take-profit) of a trade by comparing the risk (stop loss) involved in it. The relationship between the risk-reward values yields another value that determines if it is worth taking a trade or not.
Features
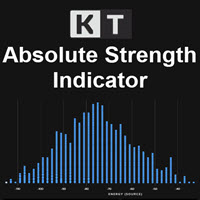
KT Absolute Strength measures and plots the absolute strength of the instrument's price action in a histogram form. It combines the moving average and histogram for a meaningful illustration. It supports two modes for the histogram calculation, i.e., it can be calculated using RSI and Stochastic both. However, for more dynamic analysis, RSI mode is always preferred.
Buy Entry
When the Absolute Strength histogram turns green and also it's higher than the previous red column.
Sell Entry
When th
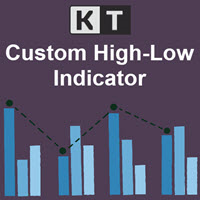
KT Custom High Low shows the most recent highs/lows by fetching the data points from multi-timeframes and then projecting them on a single chart. If two or more highs/lows are found at the same price, they are merged into a single level to declutter the charts.
Features
It is built with a sorting algorithm that declutters the charts by merging the duplicate values into a single value. Get Highs/Lows from multiple timeframes on a single chart without any fuss. Provide alerts when the current pri
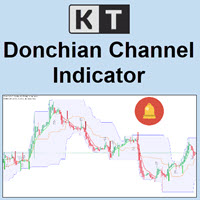
KT Donchian Channel is an advanced version of the famous Donchian channel first developed by Richard Donchian. It consists of three bands based on the moving average of last high and low prices. Upper Band: Highest price over last n period. Lower Band: Lowest price over last n period. Middle Band: The average of upper and lower band (Upper Band + Lower Band) / 2. Where n is 20 or a custom period value is chosen by the trader.
Features
A straightforward implementation of the Donchian channel ble
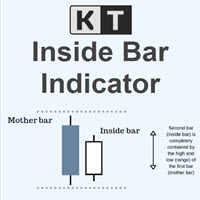
KT Inside Bar plots the famous inside bar pattern in which the bar carries a lower high and higher low compared to the previous bar. The last bar is also known as the mother bar. On smaller time-frames, the inside bar sometimes appears similar to a triangle pattern.
Features
Also plots entry, stop-loss, and take-profit levels with the inside bar pattern. No complex inputs and settings. Erase unwanted levels when the price reaches the entry line in either direction. All Metatrader alerts include
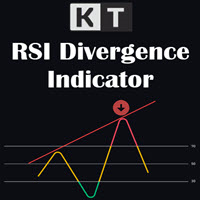
KT RSI Divergence shows the regular and hidden divergences built between the price and Relative Strength Index (RSI) oscillator. Divergence can depict the upcoming price reversal, but manually spotting the divergence between price and oscillator is not an easy task.
Features
Ability to choose the alerts only for the divergences that occur within an overbought/oversold level. Unsymmetrical divergences are discarded for better accuracy and lesser clutter. Support trading strategies for trend reve

Best indicator for MT5 providing accurate and sniper signals to enter a trade without repainting!
It can be applied to any financial assets: forex, synthetic, cryptocurrencies, metals, stocks, indices . It will provide pretty accurate trading signals and tell you when it's best to open a trade and close it. Most traders improve their trading results during the first trading week with the help of the Power Indicator Pro.
Benefits of the Power Indicator Pro
Entry signals without repaint

KT Average Daily Range(ADR) shows the upper and lower levels using the average daily range covered by the currency pair or the instrument. The average daily range is calculated using the chosen period in the input settings. ADR High: ADR upper level is found by adding the average daily range value to the current day's low.
ADR Low: ADR lower level is found by subtracting the ADR value from the current day's high.
Features
It shows the ADR levels with several other helpful information benefici

Hunt markets with Hunttern ZigZag . Easy to use with one parameter
You can use it for the following: -Classic patterns -Heads and shoulders -Harmonic patterns -Elliott Wave -Support and resistance -Supply and Demand
Single parameter: -Period (1-120)
Features: -Candle time -Single parameter -Light mode template
This is version 1 of Hunttern ZigZag. We are very happy to receive feedback from you.
FREE

主要城市的时间。北京时间、东京时间、悉尼时间、惠灵顿时间、纽约时间、法兰克福时间、伦敦时间、迪拜时间。 城市时间可选择开启或者关闭。 点差变色提醒。设置点差提醒点数,例如,设置100点,点差大于100点,文字会变红色。 Time in major cities. Beijing time, Tokyo time, Sydney time, Wellington time, New York time, Frankfurt time, London time, Dubai time. City time can be turned on or off. Dot difference color change reminder. Set the point difference reminder points. For example, set 100 points. If the point difference is greater than 100 points, the text will turn red.
FREE

LT Easy Trend - 九合一多指标共振趋势指标 您是否曾因为一个指标发出买入信号,而另一个指标却显示卖出而感到困惑? LT Easy Trend 的诞生就是为了消除这种犹豫。它基于 全球最受推崇的 9 个技术指标 的数学共振,为您提供高概率的交易信号。 Easy Trend 无需让您的图表堆满窗口,而是实时处理所有数据,只有当所有过滤器同时确认趋势时,才会显示清晰的视觉信号。 9 大趋势过滤器的力量: 只有当以下指标达成完全一致时,才会生成入场信号: 移动平均线 (MA): 价格方向过滤器。 相对强弱指数 (RSI): 识别力度和动能。 顺势指标 (CCI): 检测新的趋势周期。 抛物线指标 (Parabolic SAR): 动态趋势追踪与反转识别。 威廉指标 (WPR): 读取超买和超卖水平。 随机指标 (Stochastic): 验证动能交叉。 MACD: 确认趋势的收敛与背离。 ADX (平均趋向指标): 衡量当前趋势的实际强度。 平均 K 线 (Heiken Ashi): 平滑价格噪声,获得清晰的趋势读数。 核心优势: 信号不重
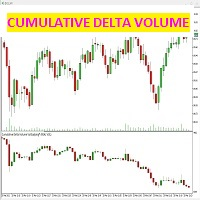
該指標檢測每根蠟燭的買價和賣價(侵略)合同之間的差異。
該指標在價格圖表下方的專用窗口中顯示蠟燭圖,蠟燭圖由買賣合約之間的差額精確給出,從而產生市場的成交量強度。
可以(從屏幕截圖中查看)如何僅選擇累積燭台 delta 圖表,甚至使用蠟燭本身的趨勢線:通過選擇第二個框 u “NONE”,不會繪製趨勢線,而通過選擇顏色,體積蠟燭的趨勢線將與它們一起出現在圖表上。
這個指標有什麼用?將價格圖表與體積delta圖表進行比較,您可以看到市場的真實實力,兩個圖表的收斂將確定價格的正確上漲/下跌,而價格與體積delta之間的背離必須是信號警報對於交易者來說,因為價格應該反轉。該指標必須與交易策略一起使用,以過濾虛假信號,消除出現在價格和數量之間背離階段的信號。
注意:該指標僅適用於提供真實市場數據流並劃分賣出/買入合約 (BID / ASK) 的經紀商。 CFD、FOREX 和 CRYPTOCURRENCIES 屬於合成市場,它們沒有真實的數據流,因此該指標不適用於這些工具- AMP FUTURE 是一家提供無存款且具有真實數據流的免費模擬賬戶的經紀商,該指標可在該賬戶上運行。

直接在图表上读取趋势方向 KT Trend Magic 将动量与波动率结合为一条跟随价格的彩色趋势线。趋势线持续显示当前趋势状态,并在计算方向发生变化时切换颜色。 绿色趋势线: 表示看涨趋势状态。 红色趋势线: 表示看跌趋势状态。 颜色变化: 标记图表上新的方向转换。 在持续走势中,趋势线也可作为观察回调和延续的动态图表参考。可将每次方向转换与当前价格走势及您自己的入场规则进行比较。 比较九个时间周期的信号 多时间周期扫描器显示 M1、M5、M15、M30、H1、H4、D1、W1 和 MN1 的看涨或看跌 Trend Magic 读数。无需为每个周期分别打开图表,即可比较当前图表与更短及更长时间周期的方向。 利用扫描器可以查看多个时间周期是否指向同一方向,或者当前图表是否正在逆着更广泛的趋势背景运行。图表趋势线提供详细的局部视图,扫描器则提供更广泛的方向比较。 调整趋势响应 Trend Period 控制用于评估方向和动量的计算窗口。Smoothing Coefficient 控制趋势线过滤短期噪声的程度。将两项设置结合调整,可选择适合交易品种、时间周期和图表风格的响应速度。 Hist
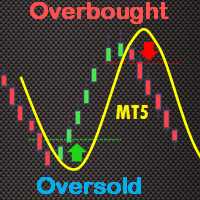
The True Oversold Overbought indicator provides you with ability to swiftly check whether the asset is oversold or overbought. Other than complementing your trading with True Oversold Overbought, you can use the indicator as your only trading system. It works with all forex instruments and will save you the headache of estimating when the market is due for a reversal or retracement. When the "Super Charge" feature is enabled, the areas where the price is in oversold/overbought status are ampli
Smart Moving Averages Indicator Smart Moving Averages is an exclusive indicator for Metatrader platform.
Instead of calculating moving averages for the selected chart time frame, the Smart Moving Averages indicator gives you the opportunity to calculate moving averages independently from the chart time frame.
For instance you can display a 200 days moving average in a H1 chart.
Inputs of the indicator are:
Timeframe : timeframe to be used for the calculation of the moving average Period : m

Bar Strength Divergence Indicator BarStrength Indicator is an exclusive indicator to trade Forex, Stocks, Indices, Futures, Commodities and Cryptos.
BarStrength Indicator shows the strength of each candle.
The indicator shows in a separate windows candles relatively to 2 price levels representing resistance and support in the market.
Once candle is near resistance it is highly probable that price movement will change direction and will go down in the next candles.
Once candle is near support

HighLow Arrow Indicator HighLow Arrow is a simple indicator to be used to signal major lows and major highs in your chart.
This indicator is not intended to be used to trade alone but more as an alert that a turning point might be forming.
In this case the HighLow Arrow indicator signals that a new high or a new low is forming and that traders can prepare for seeking new signals.
The formation of the High or the Low is confirmed after 2 bars have been closed. In the meantime, the alert can b
Daily Pivots Multi Indicator Daily Pivots Multi is an exclusive indicator to draw your pivots levels and much more.
Most indicators draw daily pivots for the day. Daily Pivots Multi is able to draw levels for different days.
The indicator can do the calculation for unlimited number of days backward. It means that you can draw the levels for today but also for the past days.
This is very useful if you want to study a strategy with Pivots levels over a period of time.
Another problem is that e
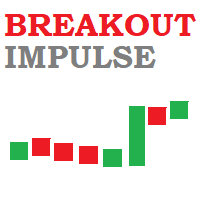
Breakout Impulse Indicator Breakout Impulse Indicator is a pattern recognition indicator for Forex, Stocks, Indices, Futures, Commodities and Cryptos.
The Breakout Impulse is a multi-bar pattern.
The purpose of the pattern is to identify a fast change in momentum.
This type of change can announce the start of a big directional move.
Inputs of the indicator are:
Distance : distance in pixel relative to top or bottom of candle to display the arrow symbol MaxBars : number of bars back used to
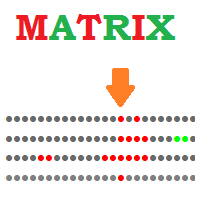
Matrix Indicator Matrix Indicator is a simple but effective indicator.
Matrix indicator displays usual oscillators indicators in a user friendly color coded indicator.
This makes it easy to identify when all indicators are aligned and spot high probability entries.
Inputs of indicator are:
Indicator: RSI, Stochastic, CCI, Bollinger Bands Param1/Param2/Param3: usual settings for the indicator ValueMin: Oversold level for oscillator ValueMax: Overbought level for oscillator The indicator can
Buy Sell Signal Low TF gives buy/sell signals and alerts with up and down arrow at potential reversal of a pullback or a trend continuation pattern in low timeframe. This is an indicator which gives signals based on trend => It works best in trend market with the principle is to ride on the trend not trade against the trend.
The components of Buy Sell Signal Low TF: - The trend is determined by SMMA 13 , SMMA 21 and SMMA 35 ( can be changed manually to suit your preference). - The signal is b
FREE

[ MT4 Version ] [ EA ] Advanced Bollinger Bands RSI MT5 Advanced Bollinger Bands RSI is an Indicator based on the functionalities of the Advanced Bollinger Bands RSI EA . The scope of this indicator is to provide a more affordable solution for users interested in the alerts coming out of the strategy but not in Autotrading. This strategy uses the Bollinger Bands indicator in combination with the RSI, the signal triggers only when both the BB and the RSI indicate at the same time overbought or ov

This is a usefull utility for monitoring spread and also for recording informations to a file. (Files will be placed into "Common\Files\Spread Monitor"). There is the possibility to let the indicator calculate high/low into the past thanks to downloading ticks. (It's a slow and approsimate thing! The best way to use it is to attach to a chart and let it recording spread in real time). There is also a buffer with the average of spread in latest X periods.
Easy and effective.
FREE

If you want to find good trading opportunities, then you must trade near the Trend Line. This allows you to have a tighter stop loss on your trades — which improves your risk to reward . But that’s not all… Because if you combine Trend Line with Support and Resistance, that’s where you find the best trading opportunities. Now you might wonder: “So when do I enter a trade?” Well, you can use reversal candlestick patterns (like the Hammer, Bullish Engulfing, etc.) as your e

FX STEWARDS Trading Signals Alert (v5.00) – The Ultimate Hybrid Signal System (Heritage Edition) Built for traders. Engineered for precision. Designed to dominate. Harness the power of cutting-edge quantitative research with FX STEWARDS Trading Signals Alert, a professional-grade hybrid indicator that fuses a 73-feature neural network, a 30+ pattern candlestick engine, an institutional-style probability model, and full auto-timeframe intelligence into tiered BUY/SELL trade alerts — filtere
Automatic trend lines. Type 1. With two extremums. 1) From the current bar "go" to the left and look for the first (right) extremum point with the InpRightExmSide bars on both sides. 2) From the first point again "go" to the left and look for the second (left) extremum point with the InpLeftExmSide bars on both sides.

Naked Forex Big Shadow Indicator Big Shadow Indicator is a pattern recognition indicator for Forex, Stocks, Indices, Futures, Commodities and Cryptos.
When you have a Big Shadow on your chart then this is a strong signal meaning that you might be ahead of a reversal. You can take other elements (momentum, trend, volatility, price action, fundamentals) to build a complete strategy and confirm your entries. Beware that you might not make money just following the arrows generated by the pattern re
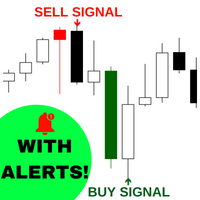
该系统擅长识别市场的短期逆转。 它基于对市场结构的机器学习研究,可以成为扫描市场或直接交易的绝佳工具。 一切都没有100%的胜率,但这个指标有时总是准确的。
当它认为反转会发生时,它会给蜡烛涂上特定的颜色,画一个箭头,然后提醒你是否购买或出售即将到来的蜡烛。
1. 简单的设置 A.在任何时间段拖放到任何图表上。 B.启用警报(可选) c.你就完了! 2. 视觉和音频警报 A.警报直接发送到您的手机 b.弹出发送到您的终端的警报 3. 多用途 A.股票、外汇、期权、期货 4. 灵活 A.适用于任何时间范围
重要提示:指标会在超过50%确定会发生某些事情时绘制箭头,但只有当它已经确定时,它才会通过改变蜡烛颜色,绘制箭头并提醒您来向您发出信号。 只有在这三件事都发生的时候才会发出信号。
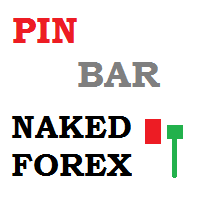
Pin Bar Indicator
The Pin Bar indicator is a pattern recognition indicator for Forex, Stocks, Indices, Futures, Commodities and Cryptos.
The strategy that comes with the Pin Bar pattern is based on price action.
Inputs of the indicator are:
Distance : distance in pixels relative to top or bottom of candle to display the arrow symbol UseAlerts (true/false): enable alerts PopAlerts (true/false): enable alerts in the popup window EmailAlerts (true/false): enable email alerts PushAlerts
Sqn Max Indicator Sqn Max is an exclusive indicator to trade the market with high effectiveness.
The indicator is based on price action, volatility and trend.
This indicator is as simple as possible but not too simple.
The indicator can generate alerts to ease the trading process. You don't have to stay all day in front of your screen.
The indicator can be used with any class of assets and with any time frame.
It is possible to achieve better results trading our list of selected assets.
We achi

Fx Levels Premium Indicator Support and Resistance are important concepts in trading. Fx Levels Premium was created to easily draw important levels of support and resistance for the active trader.
The indicator will give you all important levels (support/resistance) to watch for a wide range of assets.
Trading without these levels on your chart is like driving a car for a long journey without a roadmap. You would be confused and blind.
Support and resistance levels should be used as guideline

Moving VWAP Indicator Moving VWAP is an important indicator drawing the Volume-Weighted Average Price (VWAP).
The VWAP is a reference used by institutional traders and acts as a level of support / resistance.
If price is above VWAP then means market is bullish.
If price is below VWAP then means market is bearish.
It can be used to enter in the market with low risk (near VWAP) and also identify the correct direction of the market.
The Moving VWAP is as simple as a Simple Moving Average. The m

Inside Bar IndicatorInside Bar is a very popular candlestick pattern.
Inside Bar indicator can be used to trade Forex, Stocks, Indices, Futures, Commodities and Cryptos.
The Inside Bar indicator will search for inside bar candles pattern in the chart and will generate display them.
The indicator is also able to generate alerts in your screen or sent to your phone.
Inputs of the indicator are:
Symbol: type of char symbol to be displayed in the chart to show Inside Bar patterns CustomCode: char c
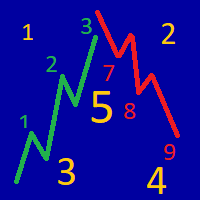
The indicator determines the strength of the trend and its possible reversal points, based on the author's arithmetic approach .
Each new peak or trough is a trend development. Such peaks and troughs are numbered so that the strength of the trend development can be seen. Attempts to change the trend are also numbered. This gives an understanding of a possible change in the direction of the trend. Indicator signals are generated when trying to change the trend .
In the settings, it is p
TTM Squeeze Indicator TTM Squeeze is an indicator to time entries based on volatility.
TMM Squeeze might well be one of the best and most overlooked indicator. It was created by famous trader John Carter and is also used by many traders like Nathan Bear.
Why is the TTM Squeeze indicator important? Because in trading correct timing entries might be more important than picking the right direction. This is a concept that is not very well understood in the trading community. Most trader think th

Naked Forex Kangaroo Tail Pro Indicator Kangaroo Tail Pro Indicator is a pattern recognition indicator for Forex, Stocks, Indices, Futures, Commodities and Cryptos.
The Kangaroo Tail is a multi-bar pattern.
The Kangaroo Tail pattern is very effective and is very simple to trade.
The strategy that comes with the Kangaroo Tail is based on price action.
The indicator does what it was designed for: displaying Kangaroo Tail patterns. Don't expect to follow the up and down arrows and make mone

Fisher Kuskus Indicator Fisher Kuskus is an indicator used by scalpers on low time frames like M1.
The Fisher Kuskus is now available for Metatrader platform.
Inputs of the indicator are:
Period : period to be used for calculation of the indicator PriceSmoothing : value of 0.0 to 0.99 IndexSmoothing : value of 0.0 to 0.99 The indicator can be used with any time frame.
It can be used with any class of assets: Forex, Stocks, Indices, Futures, Commodities and Cryptos. Other indicators for MT4:
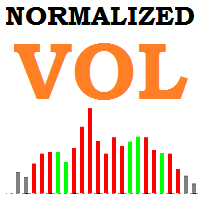
Normalized Volume99% of indicators are based on price analysis.
This indicator is based on volume. Volume is overlooked piece of information in most trading systems.
And this is a big mistake since volume gives important information about market participants.
Normalized Volume is an indicator that can be used to confirm reversal points.
The indicator code volume with colors indicating high, normal and low volume.
You could enhance dramatically your trading system using volume analysis.
Inputs

FX Sniper Yellow Indicator FX Sniper Yellow is an exclusive leading indicator to trade Forex with your Metatrader trading platform.
FX Sniper Yellow is able to analyze market participants behavior and to predict changes in the price direction even before movement starts.
Most indicators are lagging indicators and are useless. FX Sniper Yellow is a unique leading indicator .
The indicator displays arrows in your chart (please see screenshot attached) showing the probable direction of pri

FX Sniper Magenta Indicator FX Sniper Magenta is an exclusive and leading indicator to trade Forex with your Metatrader trading platform.
FX Sniper Magenta is able to analyze market participants behavior and to predict changes in the price direction even before movement starts.
Most indicators are lagging indicators and are useless. FX Sniper Magenta is a unique leading indicator .
The indicator displays arrows in your chart (please see screenshot attached) showing the probable directio

FX Sniper Orange Indicator FX Sniper Orange is an exclusive indicator to spot situations where market has gone too far and market could reverse soon after.
The indicator displays arrows in your chart indicating probable future price action (see screenshot attached).
FX Sniper Orange never repaints. Once candle is closed signal is confirmed and arrow will never disappear.
Users of the indicator can setup alerts when new arrows are displayed in the chart.
Inputs of the indicator are:
Distanc
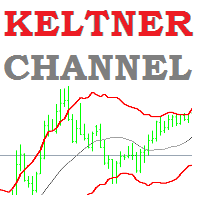
Keltner Channel Indicator Keltner Channel is an oscillator like Bollinger Bands.
Keltner Channel is a very good tool to time entries for your strategy.
Keltner Channel displays a channel where price is supposed to stay unless we are in overbought or oversold situations.
Various strategies use Keltner Channel indicator successfully to spot overbought / oversold situations and look for reversals.
Keltner Channel indicator uses ATR to determine overbought and oversold situations. Inputs of the indi

Engulfing Bar IndicatorEngulfing Bar indicator is a pattern recognition indicator for Forex, Stocks, Indices, Futures, Commodities and Cryptos.
The Engulfing Bar indicator is an enhanced pattern of the popular Engulfing Bar to keep only the best patterns produced in the market.
The strategy that comes with the Engulfing Bar is based on price action.
Inputs of the indicator are:
Distance: distance in pixels relative to top or bottom of candle to display the arrow symbol UseAlerts (true/false

Mean Volume Most indicators are based on price analysis.
This indicator is based on volume. Volume is overlooked piece of information in most trading systems.
And this is a big mistake since volume gives important information about market participants.
Mean Volume is an indicator that can be used to spot when volume is above average.
It usually means that institutional traders are active.
Peak in volume can be used to confirm an entry since increased volume can sustain the move in one or anot

Naked Forex Tweezer Pro Indicator Tweezer Pro Indicator is a pattern recognition indicator for Forex, Stocks, Indices, Futures, Commodities and Cryptos.
The standard Tweezer is a two bar pattern. Our enhanced version is a multi-bar pattern. We filter the patterns for you so that you only get the best and most effective patterns and ignore the noise.
The Tweezer pattern is a simple and effective pattern to trade.
The strategy that comes with the Tweezer is based on price action.
The Twe

This indicator calculates fibonacci levels via moving averages trend and draw these lines. You can change fast and slow Moving Averages settings for customization. Inputs:
Fast MA Time Period : 64 Fast MA Shift: 0 Fast MA Method: Smoothed Fast MA Apply To: Median Price Slow MA Time Period: 32 Slow MA Shift: 0 Slow MA Method: Smoothed Slow MA Apply To: Median Price ZigZag: False ZigZag Color: Red ZigZag Type: DashDot ZigZag Width: VeryThin Fibo Settings TrendFibonacci: True FiboTrendColor: Black
FREE

This indicator shows your daily profit for each chart. Please let me know in the comment section or via the MQL5 chat if you want find any problem, or if you want any specific features for this indicator. How to use:
Attach the indicator to the chart you want to see your profit. You can change the color of the indicators. (Currently positive figures are green, and negative are red) You can display the profit for pair it is attached, or for the whole account (all the pairs)

This indicator helps keep track of the number of trades taken in the day. It shows losses and potential profit then the total profits which is, profits - losses. Then total profit for the week and month. Soon the indicator will be sharing some trading tips based on your trading. It really does put necessary pressure and helps you to set a goal for yourself for the day. Familiarise yourself to draw your analysis on the same chart with the indicator because it will have to alert you if price brok
FREE
该指标最多绘制 6 个级别,可以根据交易者的要求启用/禁用以使图表更清晰
这 6 个级别分为 2 组:高和低
对于每组,可以选择不同的时间范围
它基于先前高低反转的策略,因为它认为当价格达到每日、每周或每月高低时,价格通常会在更小的时间范围内(如 5 分钟)显示拒绝
特征 :
- 在单个图表中跟踪多达 6 个时间帧高低点
- 在这些级别设置警报,邮件、推送或终端警报,当价格触及这些级别时,您将立即收到警报
- 自定义关卡样式,包括线条样式、宽度、颜色等
- 班次:想要跟踪或研究第 2 天或第 3 天的高低?您可以将 shift 设置为 2 用于 2nd Bar 的 High Low 或 3 设置为 3rd Bar 的 High Low 等等。
该指标最多绘制 6 个级别,可以根据交易者的要求启用/禁用以使图表更清晰
这 6 个级别分为 2 组:高和低
对于每组,可以选择不同的时间范围
它基于先前高低反转的策略,因为它认为当价格达到每日、每周或每月高低时,价格通常会在更小的时间范围内(如 5 分钟)显示拒绝
特征 :
- 在单个图表中跟踪多达 6 个时间帧高

这是我们的指标 ACB Breakout Arrows 的多品种、多时间周期扫描器。默认情况下,它可同时在 28 个货币对和 9 个时间周期 上扫描买入/卖出信号,为交易者节省大量查图时间,提高操作效率。
功能特点
可在一个图表中扫描多达 252* 个品种与时间周期的组合,极大地提升监控能力。 点击任一信号即可打开相应图表,并自动加载预设模板,便于快速跟进。 面板可自由拖动并放置于图表上的任意位置。 支持实时提醒功能,包括弹窗提示、声音报警、推送通知和电子邮件提醒,确保不错过任何重要信号。
输入参数 为 ACB Breakout Arrows 设置信号灵敏度,可根据策略需求微调。 Symbols:填写你希望系统扫描的货币对或交易品种。 刷新历史:如发现图表数据缺失或异常,可通过此选项自动下载并更新历史数据。 选择所需扫描的时间周期,可单选或多选。 提醒设置:自定义提醒类型与条件,提升响应效率。
面板颜色与字体大小均可自由调整,支持个性化视觉体验。

The indicator "JAC Trend Color Candle" for Meta Trader 5, was created to visually facilitate the trend for the trader. It is based on three parameters, which identifies the uptrend, downtrend and non-trending market. The colors are trader-configurable, and the average trader-configurable as well. trend parameters cannot be configured as they are the indicator's differential.
The indicator, Support and Resistance Detect Signal automatically detects support and resistance levels and trend lines, emitting a signal whenever the condition is met, as configured.
It reads support and resistance drawn manually or automatically built into the chart by other external indicators.
Note: Support and Resistance Detect Signal is compatible with almost all external indicators that draw on the chart, support and resistance levels, in addition to trend lines.
Discover our Elite v
The indicator, Support and Resistance Detect Signal automatically detects support and resistance levels and trend lines, emitting a signal whenever the condition is met, as configured.
It reads support and resistance drawn manually or automatically built into the chart by other external indicators.
Note: Support and Resistance Detect Signal is compatible with almost all external indicators that draw on the chart, support and resistance levels, in addition to trend lines.
Discover our

Arrow technical indicator without redrawing Vendetta in the Forex market is able to give tips with the least errors. The indicator does not redraw its signals when the price changes. It combines several filters, displaying market entry arrows on the chart.
Every rise and fall is reflected in your emotional state: hope is replaced by fear, and when it passes, hope appears again. The market uses your fear to prevent you from taking advantage of a strong position. At such moments you are most vul
您知道为什么MetaTrader市场是出售交易策略和技术指标的最佳场所吗?不需要广告或软件保护,没有支付的麻烦。一切都在MetaTrader市场提供。
