 MetaTrader 5
 专家
专家
 指标
指标
 程序库
程序库
 实用工具
实用工具
 窗口小部件
窗口小部件
 规则
规则
适用于MetaTrader 5的新技术指标 - 193
 技术指标的信号外汇和股票市场的开仓交易和平仓交易起着至关重要的作用。指标的本质就是一种交易品种的数学转换,旨在预测未来的价格变化。
测试技术指标可以更有利于预测市场行为并从中获利。
技术指标的信号外汇和股票市场的开仓交易和平仓交易起着至关重要的作用。指标的本质就是一种交易品种的数学转换,旨在预测未来的价格变化。
测试技术指标可以更有利于预测市场行为并从中获利。 
Candle de Volume Coiote O Candle de Volume Coiote é um indicador que mede a variação do volume no tempo, seu corpo é pela variação do volume anterior pelo volume atual, sua direção pelo fechamento do preço.
1. identificado um topo no indicador Candle de Volume Coiote (marcado o fechamento do preço).
2. identificado um fundo no indicador Candle de Volume Coiote (marcado o fechamento do preço).
3. fundo 3 igual fundo 2 no indicador Candle de Volume Coiote, preço no 3 é diferente de fundo 2.
P
FREE

Candle com coloração de Volume Price Analysis (VPA) segundo as definições da Anna Coulling, é possível configurar períodos de climax e rising, fator de extreme e fator de rising.
Pode-se usar volume real ou volume de ticks. O VPA considera a variação de preço por volume do período, indicando se um movimento está recebendo ignição, está em seu climax ou se já não existe mais interesse.
FREE
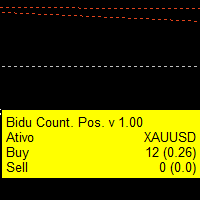
Indicador que cria um painel para acompanhamento to total de posições abertas no ativo do gráfivo.
São apresentados os dados: Ativo do gráfico Total de posições de venda em aberto Quantidade do volume de posições de venda em aberto Total de posições de compra em aberto Quantidade do volume de posições de compra em aberto.
Painel simples mas eficiente para o equilíbrio das ordens
FREE
New Test https://backoffice.aurum.foundation/u/DHXP1U
该指标是基于指标内置的标准指标,该指标考虑到当前指标30个指标 并给出买入或卖出的信号,其他指标的所有趋势的总趋势。 在输入参数中,您可以为每个指标配置特殊参数。 该指标以振荡器的形式执行,并显示所有指标在一个或另一个方向的总趋势和优势。
该指标是基于指标内置的标准指标,该指标考虑到当前指标30个指标 并给出买入或卖出的信号,其他指标的所有趋势的总趋势。 在输入参数中,您可以为每个指标配置特殊参数。 该指标以振荡器的形式执行,并显示所有指标在一个或另一个方向的总趋势和优势。 并显示所有指标在一个或另一个方向的总趋势和优势 。 并显示所有指标在一个或另一个方向的总趋势和优势 。 并显示所有指标在一个或另一个方向的总趋势和优势 。 。 https://youtu.be/UG2ZZEH9B_U
FREE
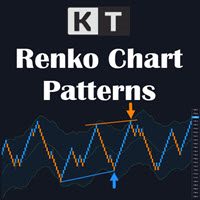
KT Renko Patterns 可在已经运行的实时 Renko 图表上识别八类形态,并直接在图表中绘制形态结构、止损参考位和斐波那契目标位。 请先准备好 Renko 图表。 MetaTrader 默认不会生成 Renko 图表。请先使用您选择的生成器打开实时 Renko 图表,然后再把本指标加载到该图表。指标只分析 Renko 砖块,不会生成砖块,也不会自动下单。 随着新砖块出现,指标会查找 W-M、Power Pennant、AB=CD、Triple Top 和 Triple Bottom、Double Top 和 Double Bottom、Two Back Strike、ZigZag Bricks 以及 Swing Breakout 形态。每个识别出的形态都会在图表上标注名称并绘出结构,无需逐块手动检查。已经识别的形态会保留在图表上,不会重新绘制。 图表上会显示什么 形态结构: 彩色线条和标签显示形态轮廓及方向。 交易参考: 止损参考位和最多三个斐波那契目标位提供一致的评估位置。 砖块反转: 标记会突出反转砖块,并可在新反转出现时发出提醒。 历史表现: 面板根据已加载的 Re

速度略有变化。 测试人员需要一个新的顾问,谁有兴趣,写信给我通过电子邮件777basil@mail.ru https://backoffice.aurum.foundation/u/DHXP1U
该指标基于历史价格变化计算,并以数学方式计算,每次再次接收数据时重新计算。 它可以在不同的时间框架上使用。 从70%的指标边界来看,价格运动或整合方向发生变化。 通过这种方式,您可以在趋势和通道中间从其边界进行交易。 最好在趋势交易中使用它来确定阻力位/支撑位。 在视频中,您可以看到指标是如何工作的: https://youtu.be/UG2ZZEH9B_U 通讯联系人 777basil@mail.ru 我们将为您的任务准备一个专家,一个指标。
该指标基于历史价格变化计算,并以数学方式计算,每次再次接收数据时重新计算。 它可以在不同的时间框架上使用。 从70%的指标边界来看,价格运动或整合方向发生变化。 通过这种方式,您可以在趋势和通道中间从其边界进行交易。 最好在趋势交易中使用它来确定阻力位/支撑位。 在视频中,您可以看到指标是如何工作的: https://youtu.be/0
FREE
MT4: https://www.mql5.com/en/market/product/52715
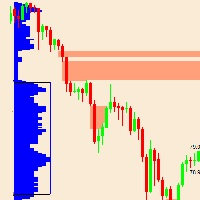
该指标基于市场概况理论。 单打区到底是什么? 理论:市场概况单打: 轮廓的单张或单张打印或间隙放置在轮廓结构的内部,而不是上边缘或下边缘。 它们以在市场资料上打印的单个TPO表示。 单身人士将我们的注意力吸引到价格快速波动(冲动)的地方。它们使低交易量的节点留有流动性缺口,从而导致市场失衡,并向我们展示了失衡的区域。通常,当市场对意外消息做出反应时,会创建单个。这些报告能够引起极端的失衡,并为买方和卖方的极端情绪反应做好准备。 市场将希望重新访问该区域,并检查这些价格水平是否不是对以这些价格进行交易感兴趣的交易者。这些商人为什么要在那里?因为市场从字面上飞过该地区,只有少数交易者有机会在该地区进行交易。为此,将来可能会填补这些领域。 这些低效的举动往往会被填补,一旦它们被填补,我们就可以寻找交易机会,或者我们也可以在它们被填补之前进入,并使用这些单张图作为目标。 用作支撑/阻力区域,但并非总是要小心。通常,它在趋势日表现良好。请参阅市场概况日:趋势日(策略1-买入-第三张图)和具有双

FREE
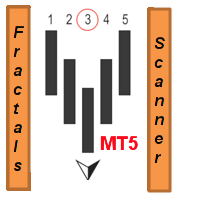
这个多时间框架和多品种指标识别分形模式。作为奖励,它还可以扫描抛物线 SAR (pSAR) 趋势变化。结合您自己的规则和技术,该指标将允许您创建(或增强)您自己的强大系统。 特征
可以同时监控您的市场报价窗口中可见的所有交易品种。将该指标仅应用于一张图表,并立即监控整个市场。 可以监控从 M1 到 MN 的每个时间范围,并在识别出模式或趋势变化时向您发送实时警报。支持所有 Metatrader 原生警报类型。
可以使用 RSI 和/或移动平均线作为趋势过滤器来正确识别潜在的逆转。 该指示器包括一个交互式面板。当单击一个项目时,将打开一个带有相关代码和时间范围的新图表。 该指标可以将信号写入文本文件,EA 交易程序 (EA) 可以使用该文件进行自动交易。比如 这个产品 。 您可以在博客中 找到有关文本文件的内容和位置的更多信息。
输入参数
输入参数的描述和解释可以在 这里 找到。 重要的
请注意,由于具有多功能性,既不会在安装指标的图表上绘制买卖建议,也不会绘制线条和箭头。图表上将绘制显示形态的箭头,点击面板中的信号即可打开图表。我建议您将指标放在干净(空)图表上,上面没有任何其他指

FXC iRSI-DivergencE MT5 指示符
這是一個高級RSI指標,可找到當前交易品種上的趨勢轉折差異。 該指標將RSI和價格走勢之間的背離檢測為強烈的趨勢轉變模式。
主要特點: 高級發散設置
價格基於收盤價,開盤價或最高價/最低價 發出買/賣開放信號
推送通知
郵件發送
彈出警報
可定制的信息面板
輸入參數: RSI Period: RSI指標的周期大小。
RSI Applied Price: RSI指標的適用價格。 可以是:關閉,打開,高,低,中位,典型,加權。
Symbol Applied Price: 當前符號的適用價格。 可以是:關閉,打開,低(B)/高(S)。
Minimum A-B Price Movements (pip): 確定差異的A點和B點之間的最小價格變動。
Minimum A-B RSI Movements (point): 確定散度的A點和B點之間的最小RSI值移動。
Minimum Bars Between A' and B' (bars): A點和B點之間允許的最小條形數量。
Maximum Bars Between A' and B'
Moving average indicator to work with the F12 Replay simulation and replay tool.
In this way, the F12 Replay tool now supports the moving average indicator.
F12 Replay: https://www.mql5.com/pt/market/product/38313
This is a product developed by Renato Fiche Junior and available to all MetaTrader 5 users!
Partners: "Águia Traders" team ( Eagle Traders ) by Larissa Sihle #aguiatraders #larissasihle
Input Parameters
Period Shift Method
FREE
ToolBot Advisor Indicator (RSI, ATR, ADX, OBV) FREE An effective indicator for your negotiations
The toolbot indicator and advisor brings leading (OBV) and lagging (RSI, ATR, ADX) indicators so that you have more security in your negotiations. In addition, it informs you of possible up and down trends as well as providing you with incredible advisors who will give you information about trading opportunities.
With this indicator you will have more security and speed in your decision making of
FREE

Description
Range Detector is an indicator that identifies ranges in the market and displays their presence on the price chart.
Recommendations
You can use this indicator to determine the flet and, accordingly, to determine the direction of opening a position or closing an opposite position.
Parameters
Maximum History Bars - maximum number of history bars for calculating the indicator. Average True Range Period - ATR indicator period (used to calculate the difference between moving a
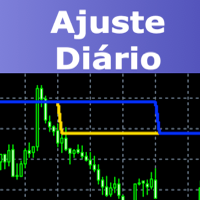
This indicator will draw two lines to represent the adjustment value, which can be used in both the Dollar and the Index.
The main advantage of this indicator is that it has two lines, one representing the adjustment calculated from the previous day and the other representing the adjustment calculated on the current day. The calculation of the adjustment on the current day is a great differential, since it will be possible to make operations in order to sleep bought or sold according to the ad
FREE
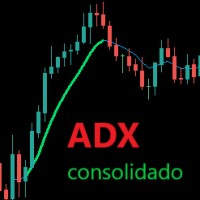
Mostra a média móvel quando ADX > 20 e pinta de verde ou vermelho quando os valores de ADX estão subindo indicando tendência. Quando o ADX é menor que 20 indica movimento lateral consolidado. O indicador não define pontos de entrada, somente mostra a média colorida quando a tendência está se fortalecendo. Faz parte do grupo de indicadores do Indicador Tavim.
FREE

Description : Rainbow MT5 is a technical indicator based on Moving Average with period 34 and very easy to use. When price crosses above MA and MA changes color to green, then this is a signal to buy. When price crosses below MA and MA changes color to red, then this is a signal to sell. The Expert advisor ( Rainbow EA MT5 ) based on Rainbow MT5 indicator is now available here .
MT4 version is available here .
FREE
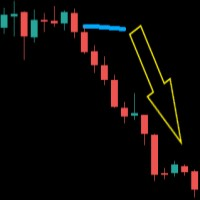
O indicador imprime a linha da média longa quando as médias media e curta estão confinadas dentro dos limites de 1 ATR (average tru range) da média longa. Após períodos de congestão os preços se movimentam fortemente em uma direção. Este indicador não fornece pontos de entrada, apenas mostra que as médias estão bastante próximas. Parâmetros: Periodmalongo: Período da média longa. Periodmamedio: Período da segunda média. Periodmamedio2:Período da terceira média. Periodmacurto: Período da média cu
FREE

It is very easy to use the Fibrillar indicator, since the simplest is to look at the chart and act according to the indications of the colored arrows. The algorithm takes into account the measurement of prices, and this method also focuses on measuring each of the price drops (H / C, H / O, LC, LO) - which gives more detailed information, but also more averaged.
When calculating this indicator, logarithmic gains are first calculated at the closing price, which allows you to filter out the tren

FXC iCorrelatioN MT5 Indicator ( 專為 DAX - DowJones) 該指標顯示兩種資產之間的相關係數。 相關性很有用,因為它們可以指示可以在實踐中利用的預測關係。 相關係數表示兩個符號之間的關係。 當相關性接近1.0時,符號沿相同方向運動。 當相關性接近-1.0時,符號沿相反方向移動。
主要特點 :
多幣種
為DAX開發-DowJones對
根據開盤價或收盤價
基於M1數據的時間同步
買/賣開放信號
推送通知
郵件發送
彈出警報
可定制的信息面板
使用提示:
最適合通常一起朝同一方向移動的資產。 (該指標專門針對DAX-DowJones對。)
建議的時間範圍不超過H4。
始終使用時間同步以獲得正確的結果。
使用時間同步時,保持打開的輔助交易品種M1圖表。 或在“ Bars Synchronization”(Bar同步)中在當前時間段保持打開的輔助符號圖。
在信號上,將位置打開到主要符號上指示的方向。 並在輔助符號上打開反向位置。
輸入參數:
Secondary Symbol: 指定輔助符號。 Correlation

The fundamental technical indicator Ripple, allows you to assess the current market situation in order to enter the market of the selected currency pair in the trend and with minimal risk. It uses in its basis the process of identifying the rate of change in price growth and allows you to find points of entry and exit from the market.
This indicator was created on the basis of the original indicators of the search for extremes, the indicator is well suited for detecting a reversal or a large s

Description: Never guess again which currency pairs are trending and which ones are not! This indicator shows exactly which currencies are gaining strength and which currencies are losing strength. The indicator can be used to very quickly determine which currency pairs are trending and which currency pairs are in a sideways motion. When one currency is gaining strength and another is losing strength, the corresponding currency pair is trending. Its as easy as that! For instance, if EUR is showi

这个多时间框架和多品种指标扫描 pin bar。结合您自己的规则和技术,该指标将允许您创建(或增强)您自己的强大系统。 特征 可以同时监控您的市场报价窗口中可见的所有交易品种。将该指标仅应用于一张图表,并立即监控整个市场。 可以监控从 M1 到 MN 的每个时间范围,并在识别出 pin bar 时向您发送实时警报。支持所有 Metatrader 原生警报类型。 可以使用 RSI 或布林带作为趋势过滤器,以便正确识别潜在的逆转。 该指示器包括一个交互式面板。请参阅单独的屏幕截图。 可以配置为显示买入/卖出线和 TP/SL 线(基于 ATR 乘数)。这些线将显示在您通过单击面板中的信号打开的图表上。请看下面的截图
该指标可以将信号写入一个文件,EA 可以使用该文件进行自动交易。
输入参数
输入参数的描述和解释可以在 这里 找到。 重要的
请注意,由于具有多功能性,既不会在安装指标的图表上绘制买入/卖出建议,也不会绘制线条和箭头。它们将绘制在图表上,该图表将在单击面板中的信号时打开。强烈建议将指标放在干净(空)图表上,不要在其上放置任何其他可能干扰扫描仪的指标或智能交易系统。

Buy and sell signals based on the Continuous Point Setup for trend continuation, popularized in Brazil by Stormer and Palex.
How does it work? The indicator activates the buy signal when we have prices above the ascending 21-period Simple Moving Average (SMA21) followed by a pullback and a touch on it.
For a sell signal we need the prices below the descending SMA21 followed by a pullback and a touch on it.
How to use it? One way of using it, as suggested by Stormer, is to enter the trade

This indicator serves as an alert for climax regions.
How does it work? When the 20-period arithmetic moving average meets the 200-period arithmetic moving average, a conflict region forms with two major opposing forces fighting. This causes the price to show random peaks until a winner side is defined, which can be dangerous. Therefore, the indicator paints the region between the moving averages to alert you.
How to use it? It can be used for specific volatility or support and resistance str
FREE

Buy and sell signals based on Larry Williams's exponential moving average strategies 9.1, 9.2, 9.3 and 9.4 for trend reversals and continuations.
To understand the logic and how to trade the signals, please check: Setup 9.1: https://www.mql5.com/pt/market/product/50986 Setup 9.2: https://www.mql5.com/pt/market/product/52268 Setup 9.3: https://www.mql5.com/pt/market/product/52269 Setup 9.4: https://www.mql5.com/pt/market/product/52273
Notices: - This indicator displays a lot of signals. B

Limitless MT5 is a universal indicator suitable for every beginner and experienced trader.
works on all currency pairs, cryptocurrencies, raw stocks
Limitless MT5 - already configured and does not require additional configuration
And now the main thing
Why Limitless MT5?
1 complete lack of redrawing
2 two years of testing by the best specialists in trading
3 the accuracy of correct signals exceeds 80%
4 performed well in trading during news releases
Trading rules
1 buy signal - the ap

Buy and sell signals based on Joe DiNapoli's shifted 3 period exponential moving average strategy for trend reversals.
Who is he? Joe DiNapoli is a professional trader and author that has been involved in the markets for more than 38 years. He is also a registered Commodity Trading Advisor (C.T.A.) for over 15 years and has taught his techniques in the major financial capitals of Europe, Asia, South Africa, the Middle East, Russia and in the United States.
How does the indicator work? The ind
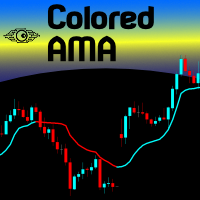
If you like to use traditional Moving Averages (like SMAs and EMAs) to provide your trades for dynamic levels of Support and Resistance, you will love the Adaptive Moving Average (AMA). Created in 1995 by Perry Kaufman and presented to the world in his book " Smarter Trading : Improving Performance in Changing Markets ", the Adaptive Moving Average (also known as KAMA - Kaufman Adaptive Moving Average) has the goal to be the perfect companion for following a trend without noise, but s
FREE

Indicator with 3 features
- Clock : Clock independent of the chart, counting continues even when the market is closed.
- Template : After setting up a configuration in any graphic, be it color patterns, indicators, zoom ... The configuration will be copied to all active graphics.
- TimeFrame : Set the TimeFrame on a chart, and with just one click all the active charts will be changed to the same TimeFrame.
O Indicador valida a força da tendência utilizando o volume negociado. Os candles são mostrados na cor verde indicando força compradora e cor vermelha na força vendedora. O movimento é encerrado pelo SAR parabólico. Vantagens: Filtra distorções de preço sem volume financeiro; Filtra consolidações e movimentos laterais; Filtra divergências de volume pelo indicador Money Flow. Desvantagens: Não filtra todos os falsos rompimentos, visto que rompimentos importantes geram altos volumes financeiros; N
FREE

This indicator is an utility for have always under control, how much time is left at the end of the bar setted.
The utility show on the lower right of the chart, the countdown to the end.
When the remaining seconds is = to the seconds set in the input, the color of remaining seconds on chart, change color and play a warning sound to warn you that the bar is about the end. When the remaining seconds is < to the seconds set in the input, the utility play a beep to warn you that the bar is in co
FREE

Utility for show on charts the visual informations about:
- a vertical line at start of each bar of selected timeframe
- a vertical line at start of each day
- a vertical line at start of each week
- vertical lines at start / end of trading sessions selected
- bid / ask prices, spread, money value for each point (of 1 standard lot) and last tick time recived"
You can enable / disable each information and set the color for each line
FREE
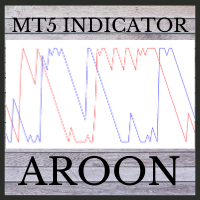
This indicator is powerful for detecting the trend.
The crossing between to line is the entry signal. Buffer 0 is UP line. Buffer 1 is DOWN line. Note: 1. Aroon is great tool for trending detecting. Please try to select the best period for each instrument.
Input AroonPeriod =14- Aroon period
MailAlert =false- Send email when entry signals appeared.
SoundAlert =false- Notify on MT5 platform.

Renko是一个永恒的图表,也就是说,它不考虑时间段,而是考虑价格变化,这使得图表上的价格变化更加清晰。
Hyper Renko是提供此功能的指标。
要进行配置,您只有一个参数,即您要使用的对号*中蜡烛的大小。
*勾号:是资产的最小可能变化。
感谢您选择超级交易者指标。
维基百科: 连环图表示变量值(例如金融资产的价格)随时间变化的最小变化。仅当所考虑的值(例如价格)变化了某个最小数量时,图形才会随着时间前进。例如,在考虑资产价格R $ 1变动的Renko图表上,仅当变动发生时(向上或向下)才绘制新的“砖”-不管变动发生了多长时间以及交易量。因此,如果在水平轴上绘制时间,在垂直轴上绘制价格变化,则所有“砖”的高度都相同(价格变化相同),尽管它们在视觉上相同,但它们之间的间距却代表不同的时间量。
FREE

Hyper Force指标最初由David Weis于1984年创建,以波形形式显示符号趋势的强度。
波浪越大,趋势越强。
小浪意味着弱势的趋势或没有趋势的市场。
在波浪中,一个柱线和另一个柱线之间的差异越大,趋势越强。
当一个条形图和另一个条形图之间的距离开始减小时,这意味着该波已经开始失去其趋势。
因此,以强大的力量抓住浪潮并在浪潮减弱时走出去是理想的。
其他指标,例如移动平均线,MACD可以帮助您有力地确认这一趋势。
当一个条形图和另一个条形图之间的距离开始减小时,这意味着该波已经开始失去其趋势。
因此,以强大的力量抓住浪潮并在浪潮减弱时走出去是理想的。
其他指标,例如移动平均线,MACD可以帮助您有力地确认这一趋势。
FREE

线性回归的截距值和相对于截距值对称的平均绝对偏差的表示。
参数
•Periods:计算线性回归的周期数
•Amplitude:定义频段的绝对平均偏差的倍数
•Displacement:水平轴上的位移
•AppliedPrice:进行计算的价格
•MainPlot:显示主图
•UpperPlot:显示上限
•LowerPlot:显示较低频段
请注意,当价格处于范围内时,移动平均线只是线性回归。在这里,我们看到了线性回归相对于最常用的指标之一的优势,那就是它在价格趋势变化时以相同的方式进行调整,但在移动平均线方面没有变化。
使用建议
•与移动平均线相比超级快,因此MainPlot更好地代表了价格
•波段可以更准确地定义价格通道,不仅在范围上,而且在趋势上,这都是波动交易的理想选择
•它可以用于肉眼可视化趋势,也可以用于价格的持续加速和减速。每当价格高于MainPlot时,价格就会加速,而当价格低于MainPlot时,价格也会相反。
记得!!!…
•指标只是工具,没有魔力,不要盲目相信警报。
线性回归的斜率值表示。它具有一个参考图,可以直观地确定斜率值的变化(价格的加/减)。
参数
•Periods:计算线性回归的周期数
•PeriodsReference:根据主图的值计算移动平均线的周期数
•Displacement:水平轴上的位移
•AppliedPrice:进行计算的价格
•MainPlot:显示主图
•ReferencePlot:显示参考图
使用建议
•使您可以轻松查看当前价格趋势。如果MainPlot大于零,则趋势为正,如果小于零则趋势为负。
•它可以轻松直观地看到斜率的变化(价格的加/减)。如果MainPlot高于ReferencePlot,则价格正在加速,如果低于,则价格正在减速。
•非常适合于摆动交易或高速交易。
•确定交易主要方向(买/卖)的理想选择。
•它不提供有关价值区域(支撑,阻力)的直接信息,因此最好将其与价格指标(例如移动平均线或线性回归带)配对。
•当MainPlot穿越零时,提供有关市场反应区域(支撑,阻力)的间接信息(必须将穿越期与价格区
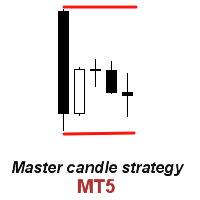
该指标识别一种特殊类型的内线形态,由一根大主蜡烛和 4 根较小蜡烛形成(请参阅下面的策略说明)。 特征 在图表上绘制买入/卖出止损线以及止盈和止损水平。 TP/SL 水平基于平均真实范围 (ATR) 指标。 对象颜色是可变的。 当确定主蜡烛形成时向您发送实时警报 - 声音/弹出窗口/电子邮件/推送通知。 提出建议后,您可以通过自己的图表分析进行确认。通常,最好的交易设置是围绕重要支撑/阻力、整数、供需区域等发生的设置。 如果您想在多个图表上使用该指标,您可以考虑利用我的三角旗和三角形扫描仪中的内柱扫描,您可以找到 在这里 。 输入参数
内部蜡烛的数量 :为了获得最佳信号质量,建议将其设置为 4。请参阅下面的策略说明。 最大蜡烛线信号适用于 :此设置控制建议的入场线将扩展多长时间。 买入/卖出止损点的距离 :入场线的偏移量/缓冲区。建议主蜡烛高/低至少 5 个点。 以点为单位的最小主蜡烛尺寸 :请参阅下面的策略说明。 以点为单位的最大主蜡烛尺寸 :请参阅下面的策略说明。 等待蜡烛关闭 :真/假。默认值为真。如果设置为 False 那么警报将在 4 日 蜡烛打开。 忽
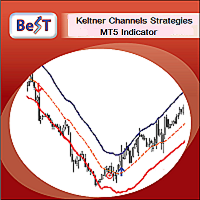
BeST_Keltner Channels Strategies MT5 is an MT5 Indicator based on the original Keltner Channels Indicator and it can display in the Chart all the known Variations of Keltner Channels and also the corresponding 10 totally Strategies. Every such generally consists of a Central Moving Average Line and two Boundary Bands at a distance above and below it and can be traded mainly in a Trending Mode but also in a Ranging ReEntry Mode.
BeST_Keltner Channels Strategies Indicator Draws definite Buy
Introduction to Fibonacci Volatility Indicator Volatility indicator can help you to detect any statistical advantage for your trading. Especially, if you are trading with Price Action and Price Patterns, then we recommend to use the Volatility indicator together with your strategy. Especically, Fibonacci Volatility indicator combines the market volatiltiy with Fibonacci Analysis to provide you more advanced volatiltiy indicator. Main Features Fibonacci Volatility in Z score Configuration Mode Fi

The Metatrader 5 has a hidden jewel called Chart Object, mostly unknown to the common users and hidden in a sub-menu within the platform. Called Mini Chart, this object is a miniature instance of a big/normal chart that could be added/attached to any normal chart, this way the Mini Chart will be bound to the main Chart in a very minimalist way saving a precious amount of real state on your screen. If you don't know the Mini Chart, give it a try - see the video and screenshots below. This is a gr
As a tribute to all the "quants" and "quantums" in this market who promise to make you rich quickly and easily, my ADR Dashboard is now just $39 — until summer is over, or perhaps a little longer. It won't make you rich quick, but it gives you a perfect view of the potential trading ranges of an asset. The intention of the dashboard is to provide a quick overview of the daily, weekly and monthly range of configured assets. In "single asset mode" the dashboard shows you possible reversal points

Thread indicator is calculating possible values for the upcoming periods. It is built by author’s system, with ability to learn. Input data ( recommended interval ): Sensitivity to oscillatory motion (integer value, 0 - 8) increase of value shifts priority of calculation towards high-frequency vibrations (increase loads the system) Shift of diagram (integer value, 0 - 8) shifts output of indicator to the right Diagram forecast (integer value, maximum 10) defies the number of periods calculated
FREE

Join Deriv link on profile>>>
The best time to trade Using this Indicator is when the time reach exactly hour,half,45 minutes,15 minutes and sometimes 5 minutes..
This indicators is helpful to those who trade boom and crash indecies.How to read this indicator first you'll see Blue allow and Red allow all these allows used to indicate or to detect the spike which will happen so the allow happens soon before the spike happen.This indicator works properly only in boom and crash trading thing wh

The Mercadulls Indicator gives to you many signals types, detecting supports, resistances and accumulation/distribution zones. The indicator constantly checks the graph for direct analysis and the appearance of long trends. Main characteristics No repaint! Stop loss and take profit levels are provided by the indicator. Suitable for Day Traders, Swing Traders, and Scalpers. Optimized algorithm to increase the accuracy of signals. Technical analysis indicator for all assets available in the m

Qstick is a way to objectively quantify candlestick analysis and improve the interpretation of candlestick patterns. Qstick was developed by Tushar Chande and published in his book " The New Technical Trader - Boost Your Profit by Plugging Into the Latest Indicators (1994) ". Qstick is built based on a moving average of the difference between the Open and Close prices. The basis of the idea is that the Opening and Closing prices are the heart of candlestick analysis. We strongly recommend the re
FREE
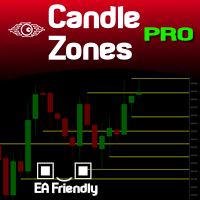
You probably heard about Candlesticks behaviors, which in most of the times could denote and trace Volume behaviors even if you are not watching Volume itself... Well, this indicator will do this. Naked traders love to rely solely on candlesticks patterns and with Candle Zones you can trap special patterns and DRAW THEM on your chart. As simple as that. There are several filters you can tweak in order to achieve the analysis you want. Just give it a try. After several months of testing, we think

AKT for MT5 (Traders Club)
機能: MAゴールデンクロスで買いサイン、デットクロスで売りサインを表示します。 MAの期間は短期足と長期足を入力できます。 MAの種類を選択できます。(SMA、EMA、SMMA、LWMA) 適用する価格を選べます。(CLOSE,OPEN,LOW,HIGH,MEDIAN,TYPICAL,WEIGHTED) サインをアラートで通知します。 サイン発生をE-mailやSNSで通知します。 表示するサインを変更することが出来ます。
サインの色を変更することが出来ます。
サインの表示された時間と価格が表示されます。
※価格は終値になります。
Indicator Noを変えることによるこのインジケータを複数適用することができます。
これにより違う MAの期間による ゴールデンクロスと デットクロスのサインを
表示できます。

Индикатор построен на основе индикаторов VIX и RSI. Комбинация двух указанных индикаторов позволяет обнаруживать зоны крайней перепроданности, где цена с большой долей вероятности изменит направление. Наиболее сильные сигналы дает в периоды слабого тренда. Сигналом индикатора является изменение направления гистограммы (с роста на снижение) выше заданного (сигнального) уровня.
В индикаторе задан широкий спектр параметров, который позволяет оптимизировать индикатор для торговли любыми активами: П

Currency Strength Meter is the easiest way to identify strong and weak currencies. The indicator shows the relative strength of 8 major currencies: AUD, CAD, CHF, EUR, GBP, JPY, NZD, USD.
By default the strength value is normalised to the range from 0 to 100 for RSI algorithm: The value above 60 means strong currency; The value below 40 means weak currency;
The indicator is created and optimized for using it externally at an Expert Advisors or as a Custom Indicator inside your programs. Fo

具有高级过滤系统的趋势振荡器。它决定了趋势,它的减弱和增强。有一个内置的多时间框架面板。 AW 趋势振荡器适用于任何时间框架和任何符号(货币、指数、石油、金属、股票)。 MT4 版本 -> 这里 / 问题解决 -> 这里 特点和优点:
高级趋势过滤 一键更改指标的灵敏度 易于设置 多时间框架面板 能够移动和最小化面板 适用于任何符号和任何时间范围。 各种通知 输入设置: . 指标周期 - 指标周期,数值越大,指标信号的敏感度越低,
. 发送推送通知 - 使用移动版交易者终端的新信号通知,
. 发送弹出警报 - 在警报时使用声音通知,
. 发送电子邮件 - 使用向交易者的电子邮件发送有关信号外观的电子邮件,
. 显示多时间帧面板 - 启用面板显示,
. 多时间框架仪表板 - 面板视图,最小化或完整,
. 面板中的字体大小 - 指示器面板上的文本大小,
. Up color main - 上涨趋势加强时的颜色,
. Up color second - 上升趋势减速时的颜色,
. Down color main - 下跌趋势加强时的颜色,
. Down color second
此多品种指标旨在自动识别价格何时达到主要心理水平。也称为整数、整数或关键级别。作为奖励,它还可以在一个选定的时间范围内扫描枢轴点水平。结合您自己的规则和技术,该指标将允许您创建(或增强)您自己的强大系统。 特征 可以将信号写入文件,智能交易系统可以使用该文件进行自动交易。 可以同时监控您的市场报价窗口中可见的所有交易品种。将该指标仅应用于一张图表,并立即监控整个市场。 当价格达到整数水平时向您发送实时警报。支持所有 Metatrader 原生警报类型。 该指标包括一个用于存储信号的图表面板。 输入参数
请在此处 找到输入参数的说明和解释。 重要的
强烈建议将指标放在干净的图表上,不要在其上放置任何其他可能干扰扫描仪的指标或智能交易系统。请注意,由于具有多功能性,既不会在安装指标的图表上绘制买入/卖出建议,也不会绘制线条和箭头。圆形水平线将绘制在图表上,点击面板中的信号时将打开该水平线。
SETI is a Break indicator multipair searching SETI is a powerful indicator of for any par and any timeframe. It doesn't requires any additional indicators for the trading setup.The indicator gives clear signals about opening and closing trades. This Indicator is a unique, high quality and affordable trading tool. Can be used in combination with other indicators Perfect For New Traders And Expert Traders Low risk entries. Never repaints signal. Never backpaints signal. Never recalculates

Buy and sell signals based on Larry Williams's exponential moving average strategy 9.4 for failed reversals and trend continuation.
How does it work?
For an uptrend, we need a candle turning the 9 period EMA down and closing below it, followed by a candle turning the 9 period EMA up and closing above it, with a low higher than the previous candle's low. For a downtrend, we need a candle turning the 9 period EMA up and closing above it, followed by a candle turning the 9 period EMA down and cl

Buy and sell signals based on Larry Williams's exponential moving average strategy Setup 9.2 for trend continuation.
How does it work? The indicator activates the buy signal when a candle closes below the previous low while maintaining the 9 period EMA's upwards. For a sell signal, we need a candle closing above the previous high while maintaining the 9 period EMA's downwards.
How to use it? One way of using it, proposed by Larry Williams, is to enter a trade with a buy stop order one tick

Buy and sell signals based on Larry Williams's exponential moving average strategy 9.3 for trend continuation.
Who is he? Larry Williams is an American stock and commodity trader, author of 11 books and creator of indicators such as the "Williams%R" and the "Ultimate Oscillator", with over 60 years of trading experience. Won the 1987 World Cup Championship of Futures Trading, turning $10,000 to over $1,100,000 in 12 months with real money. Ten years later, his daughter Michelle Williams won th

Tops & Bottoms Indicator FREE Tops abd Bottoms: An effective indicator for your trades
The tops and bottoms indicator helps you to find ascending and descending channel formations with indications of ascending and/or descending tops and bottoms. In addition, it show possibles opportunities with a small yellow circle when the indicator encounters an impulse formation.
This indicator provide to you more security and speed in making entry decisions. Also test our FREE advisor indicator:
FREE
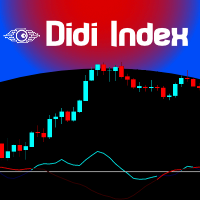
The famous brazilian trader and analyst Didi Aguiar created years ago a study with the crossing of 3 Simple Moving Averages called "Agulhada do Didi", then later was also named Didi Index, as a separate indicator. The period of those SMAs are 3, 8 and 20. As simple as that, this approach and vision bring an easy analysis of market momentum and trend reversal to those traders looking for objective (and visual) information on their charts. Of course, as always, no indicator alone could be used wit
FREE
Dragon SuperTrend OB indicator
he Dragon was an indicator developed to capture a new beginning of the trend, it is excellent in Binary Options and Forex and even B3 in the Mini Index and Mini Dolar. It has 4 trend levels in 4 different Times Frames, so you can be sure that you are on the right side of the trend! It is very simple and easy to use, in the end I explain how we will operate with the indicator!
Confirmation modes First Line Trend Confirmations: Green Square Upward Trend. Red Squar
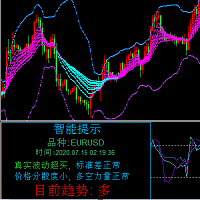
这是一个组合指标分析趋势、支撑阻力、买卖点。运用了均线MA、布林带、KDJ、CCI、RSI。
主图上下线是布林带上下线,采用的是20周期和2.3标准差可以用来支撑阻力。 中间的是分析趋势的均线,趋势分析是用均线多周期: 为涨趋势,反之为下跌趋势。在同一种颜色,基本说明趋势没有发生变化。 子图是由 KDJ、CCI、RSI三个指标组成,大于70超买,小于30超卖, 智能提示是运用了算法,主要计算布林带, KDJ、CCI、RSI指标
有三个或四个指标超出市场常态就会发出提示行情可能反转。 子图指标运用了很多数据,刚刚开始加载会有点慢,耐心等待就可以 这个指标是子图指标,还要再下我发布的MMB分析,这样就刚刚好组成一套分析
电脑分辨率的文本大小请设置100%,不然字体会不一样
FREE
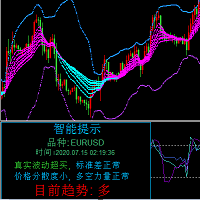
这是一个组合指标分析趋势、支撑阻力、买卖点。运用了均线MA、布林带、KDJ、CCI、RSI。 主图上下线是布林带上下线,采用的是20周期和2.3标准差可以用来支撑阻力。 中间的是分析趋势的均线,趋势分析是用均线多周期: 为涨趋势,反之为下跌趋势。在同一种颜色,基本说明趋势没有发生变化。 子图是由 KDJ、CCI、RSI三个指标组成,大于70超买,小于30超卖, 智能提示是运用了算法,主要计算布林带, KDJ、CCI、RSI指标
有三个或四个指标超出市场常态就会发出提示行情可能反转。 子图指标运用了很多数据,刚刚开始加载会有点慢,耐心等待就可以 这个指标是主图指标,还要再下我发布的RCD分析,这样就刚刚好组成一套分析 电脑分辨率的文本大小请设置100%,不然字体会不一样
FREE

For those traders and students who follow the famous brazilian trader Igor Rodrigues (Mago Trader) here it is another tool he uses: a 2-line MACD specially set with Phi ratios. This MACD is packed with a twist: a Filling Area , to easily and visually spot the corresponding trend on the chart. Obviously, you can turn On and Off this filling feature. If you don't know Igor Rodrigues and you are a brazilian trader and student, just google for him... Very simple and useful indicator.
If you are loo
FREE
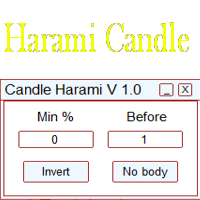
Это простой индикатор, показывающий формирование свечей харами. Входные параметры:
Min % - минимальный процент харами Before - количество свечей до сигнала Invert - инвертировать сигналы No Body - свечи без тела Length - настройка для отображения сигналов В индикаторе есть встроенный фильтр по количеству свечей до сигнала и минимальному проценту харами. Более подробно о настройках индикатора можно прочитать на моем сайте.
MTF-MA2 for MT5 特徴: MTF Moving Averageを8本一気に表示してくれるインジケータになります。 8本も必要ない場合にももちろん非表示にできます。
パフォーマンスを考慮しているのでチャートが重くなるようなことは 無いはずになります。どの通貨でも使用可能になります。 それぞれのMTF Moving Averageの色や太さを変更できます。
各パラメータの説明: Method:MAの種類設定をします。 Applied price:MAで使用する価格を設定をします。 TimeFrame M5:使用するMAの時間足を設定します。 Period M5:使用するMAの期間を設定します。 ※ラベルに関係なく8本のMTF MAはどの時間足でも期間設定可能になります。
Limited bar?:表示に使用するバーを制限するかどうかを設定します。 ※ここをFalseにするとすべてのバーを読み込むことになるのでチャートが重く なるかもしれません。ご注意ください。 Max bars:使用するバーの本数を設定します。過去検証をする場合にはここの値を増やしてくだ

MTF-Candlestick (Traders Club)
特徴: このインジケータは上位足のローソク足を表示します。 この上位足のローソク足を表示のインジケータは特に1分足や 5分足トレーダ用に開発されたものになります。
現在のローソク足で上位足のローソク足を作成する部分 と過去の上位足のローソク足を作成する部分を 分けています。また、更新はティックごとではなく 指定した時間ごとになるので急な価格変動があった場合でも チャートがフリーズした状態には非常になりにくいということになります。
陽線や陰線の色を変更出来たり髭の太さを変更できるので非常に 見やすと思います。
各パラメータの説明: Indicator No:インジケータNoを設定します。もし同じチャートに複数適用したい場合には個々の数字を変更してください。 TimeFrame:表示する時間足を設定します。 Bullish candlestick color:陽線のローソク足の色の指定します。 Bearish candlestick color:陰線のローソク足の色の指定します。 Doji candles
Fast trend - профессиональная версия индикатора определения направления тренда и точек входа. Индикатор с высокой вероятностью определяет направление тренда на любых валютных парах, акциях, криптовалюте без перерисовки результата. Для определения тренда использует Price action и авторский уникальный алгоритм фильтрации. Подходит для всех видов торговли, как для скальпинга так и для долгосрочной торговли. Данная версия индикатора это другая ветка эволюции алгоритма индикатора Simple Trend

An algorithm to detect a spike instantly with zero lag.. Use default settings for "Crash And Boom" This smart algorithm detects a spike, which can be use to filter out market spikes, give entry signals with exit. Trading:- Booming for Boom and Crashing for Crash
Spike Signal:- The less you decrease the more signals
Multiplier:- This multiplies the Signal
Time Ratio:- For adjusting the Signal
AlertProperties = "====== Alert Properties ======";
SendAlertViaAlertWindow:- if set to true it will mak
Zhǐbiāo jīyú měi gè túbiǎo shíjiān de 6 gè xìnhào, gēnzōng tóngyī zīchǎn de 5 gè bùtóng túbiǎo shíjiān de qūshì. Gāi zhǐbiāo dì zhǔyào mùdì shì xiàng wǒmen zhǎnshì fàngzhì gāi jīnróng zīchǎn de duōshù qūshì. Xìtǒng zài shù gè túxíng shíjiān zhōng chuánshū qūshì xìnxī, zhèyàng yònghù kěyǐ guǎngfàn chákàn zīchǎn de yídòng, zhè zhǒng gōngjù tōngguò bāngzhù cāozuò yuán zhíxíng dìngdān shǐ yònghù jùyǒu jiào gāo de mìngzhòng lǜ zhīchí qūshì.

该指标旨在衡量给定移动平均线与价格的距离。
该指标除显示间距值外,还有间距本身的平均值,以辅助和确认分析。平均值的类型和计算间距值的平均值以及间距平均值都是可以参数化的。
啟用選項“設置自動水平和顯示信號”後,指標將在圖表上顯示買入和賣出信號。當價格與平均值的偏差大於指標中確定的水平時,出現買入和賣出信號。 注意:該級別是動態插入到指標中的,也就是說,如果發生新的偏差而修改了資產的特徵,則會對其進行修改。圖表上僅顯示在指標水平上一次更改之後發生的買入和賣出信號。
设置。
主要移动平均线周期 (用于计算距离) 移动媒体类型(简单、指数) 距离移动平均周期
注:为了更好地显示高距离电平,建议在指示灯中插入电平。
........................................................................................................................................................
The Market Time indicator shows in a simple and objective way the opening hours of the main exchanges in the world. Define the number of days to be displayed and choose the options available for the appearance of each vertical line of each market in the indicator. With this Market Hour indicator you will be able to see the opening hours of the main markets in the world more easily and quickly. Note that the opening time of each market to be inserted in the indicator is the time of your broker's
MetaTrader市场是一个简单方便的网站,在这里开发者可以出售自己的交易应用程序。
我们将帮助您发布您的产品,并向您解释如何为市场准备您的产品描述。市场上所有的应用程序都是加密保护并且只能在买家的电脑上运行。非法拷贝是不可能的。
