 MetaTrader 5
 专家
专家 指标
指标 程序库
程序库 实用工具
实用工具 窗口小部件
窗口小部件 规则
规则适用于MetaTrader 5的新技术指标 - 190
 技术指标的信号外汇和股票市场的开仓交易和平仓交易起着至关重要的作用。指标的本质就是一种交易品种的数学转换,旨在预测未来的价格变化。
测试技术指标可以更有利于预测市场行为并从中获利。
技术指标的信号外汇和股票市场的开仓交易和平仓交易起着至关重要的作用。指标的本质就是一种交易品种的数学转换,旨在预测未来的价格变化。
测试技术指标可以更有利于预测市场行为并从中获利。 
BlueDigitsFx 官方生态系统入口 获取基础设施更新、交易资源、产品发布信息以及 BlueDigitsFx 官方生态系统访问权限。 Telegram 生态系统
官方网站
MT4 版本
BlueDigitsFx OBV Divergence MT5 —— 用于识别市场反转的成交量背离指标 BlueDigitsFx OBV Divergence 是一款 MT5 指标,用于识别价格走势与 On-Balance Volume(OBV)指标之间的看涨和看跌背离。 通过比较价格走势与成交量行为,该指标能够帮助交易者识别潜在的趋势衰竭、市场反转以及动量变化等情况。 指标会直接在图表上标示背离形态,帮助交易者结合成交量确认,更深入地分析市场结构。
主要功能 自动背离检测 —— 自动识别图表中的 OBV 看涨和看跌背离。 成交量与价格对比 —— 比较价格走势与 On-Balance Volume 指标行为。 多时间框架兼容 —— 支持 MT5 所有时间周期。 可自定义提醒 —— 支持弹窗、电子邮件和推送通知提醒。 清晰的可视化信号 —— 背离区域直接显示在图表上,便于分析。 轻量级 M
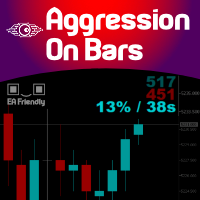
Imagine a Buy and Sell Pressure monitor on your chart that shows in REAL-TIME this data, bar by bar? Well, imagine no more. We present you an exclusive creation of Minions Labs : Aggression On Bars indicator. On every new bar on you chart this indicator will start counting in real-time the BUY/SELL pressure and present this data statistics directly inside your chart. As soon as a new bar is created in your chart, the counter restarts. Simple and effective. Just watch the video to see it running

Spread Indicator MT5 - NS Finanças. (http://www.nsfinancas.com.br) Auxiliary tool to give Spread visibility to all types of currency pairs and timeframes. The labels are well positioned in the upper right corner of the chart so as not to disturb the visualization during the trade, however it is also possible to drag the indicator to the best place on your screen. In addition to the current spread, this indicator also monitors the minimum, maximum and average spread of the selected currency pair
FREE

Price activity indicator showing the trend zone - flat, not redrawing previous values. The indicator is very sensitive to current price activity and displays signals quite well. The state of the market, the phase of its movement largely determines the success of the trader and his chosen strategy. The color version of the indicator signals a trend change. The indicator allows you to see a rising or falling trend. In addition to the trend direction, the indicator shows a change in the angle of in

Despite the apparent simplicity of the indicator, inside it has complex analytical algorithms with which the system determines the moments of inputs. The indicator gives accurate and timely signals to enter and exit the transaction that appear on the current candle.
The main purpose of this indicator is to determine the moments of entry and exit from transactions, therefore, the Trend Revers indicator will display only the trend line and entry points, that is, displays the entry points to the
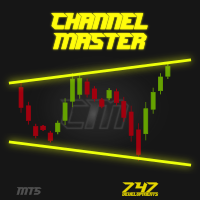
Channel Master is unique indicator for automatic channel finding. This indicator is fully adjustable by user. User can also put more instances of Channel Master to one chart with different channel size for better trend filtering. To find more information visit the 747Developments website. Features
Easy to use (just drag & drop to the chart) Fully adjustable Accessible via iCustom function Possible to use with any trading instrument Possible to use on any time-frame
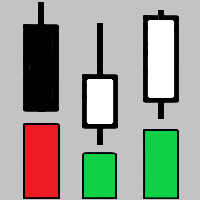
The indicator shows key volumes confirmed by the price movement.
The indicator allows you to analyze volumes in the direction, frequency of occurrence, and their value.
There are 2 modes of operation: taking into account the trend and not taking into account the trend (if the parameter Period_Trend = 0, then the trend is not taken into account; if the parameter Period_Trend is greater than zero, then the trend is taken into account in volumes).
The indicator does not redraw .
Settings History_S
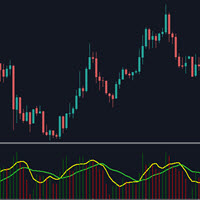
This indicator will show the the change of volumes via 2 lines of SMA: . Fast line (default is 5 candles) . Slow line (default is 13 candles) We can use the crossing point of fast line and slow line to know investors are interesting in current price or not. Pay attention: The crossing point is not signal for entry. Absolutely that we must use in combination with other indicators for sure. Parameters: . Fast line periods: the periods (candles) to calculate SMA of fast line . Slow line periods: th
FREE
Media Móvel Grátis para uso em conjunto ao Diamond Indicator Atenção. Essa é a mm para conjugar ao indicador. Esse não é o indicador. Comprem o indicador que está tendo ótimos resultados. A seguir informações sobre o indicador: Indicador Para Opções Binarias. Usa dois gales. Instalar em mt5 Esse indicador é para ser usado no tempo de vela de 5 minutos e em M5. Este também funciona em M1, porém é mais eficiente em M5. Só descompactar e copiar os arquivos na pasta de dados do seu MT5. Arquivos
FREE

The FREE version works on Demo account and only CADCHF and NZDCHF pairs.
The indicator predict the future candles direction, by scanning past candle movement. Based on the principal: “ The history repeat itself”. Programmed according to Kendall Correlation. In the settings menu, different scanning options are available. When the indicator find a match, start painting future candles from the current candle to the right, also from the current candle to the left as well, showing you the candle pa
FREE

Только что открыли позицию, а цена резко пошла в другую сторону..Что делать? Просто потерпеть, усредниться или отстопиться (закрыться) и снова войти в сделку, но уже в противоположную сторону? Как поступить...а может просто снимать сливки и торговать по разворотным импульсам ….в этом Вам поможет и подскажет Индикатор тенденций и разворотов на базе коллекции паттернов советника ReversMartinTral https://www.mql5.com/ru/market/product/28761
который кроме рекомендаций и сигналов реверса включа

Indicador Para Opções Binarias. Indicator for Binary Options Usa dois gales. Instalar em mt5 Esse indicador é para ser usado no tempo de vela de 5 minutos e em M5. Este também funciona em M1, porém é mais eficiente em M5. Só descompactar e copiar os arquivos na pasta de dados do seu MT5. Arquivos indicator na pasta MQL5 - Indicator. Baixe também a Media Movel totalmente gratis:
https://www.mql5.com/pt/market/product/50400
Esse Indicador é para a próxima vela. Apareceu a seta, só aguardar a próx
The Raschke Oscillator (LBR-RSI) indicator is the famous oscillator described in the book " Street Smarts: High Probability Short-term Trading Strategies " This indicator is perfect for a variety of researchs and it can be suitable to be used in combination with your own strategy just for trend trading or range-bound trading. The personal preference is to use it when the trend is not too strong, for example you can combine it with ADX to measure the strength of the trend and use it when ADX is b

The indicator predict the future candles direction, by scanning past candle movement. Based on the principal: “ The history repeat itself”. Programmed according to Kendall Correlation. In the settings menu, different scanning options are available. When the indicator find a match, start painting future candles from the current candle to the right, also from the current candle to the left as well, showing you the candle pattern what the actual signal is based on. The left side candle are optiona

Indicador Para Opções Binarias. Indicator for Binary Options Usa dois gales. Instalar em mt5 Esse indicador é para ser usado no tempo de vela de 5 minutos e em M5. Este também funciona em M1, porém é mais eficiente em M5. Só descompactar e copiar os arquivos na pasta de dados do seu MT5. Arquivos indicator na pasta MQL5 - Indicator. Baixe também a Media Movel totalmente gratis:
https://www.mql5.com/pt/market/product/50400
Esse Indicador é para a próxima vela. Apareceu a seta, só aguardar a próx
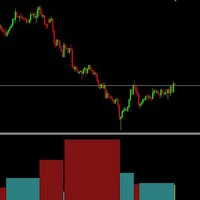
The result as the name explain, displays the result of a swing. Sometimes weis waves show a big effort, but a little result... The weis waves result is a better revelation about the volume, if united with weis waves. it is a volume indicator, but it is different from a conventional volume indicator, this indicator came from the wyckoff method, if you use the result you will have a different view of the market, regardless of which asset is operating.
***Please Give Some Feedback and Reviews*** This is an indicator which shows the direction and the strength of the selected Symbol based on the two outputs, Signal and Value. The Signal indicates the directions as Buy equals 2(Blue) and Sell equals 1(Red). The Value output indicates the strength of the signal between -100 to 100. This indicator is both trend and fast preliminary indicator by choosing appropriate parameters. Indicator uses the Normalized ADX value as the hitting catalyst, which

BlueDigitsFx 官方生态系统入口 获取基础设施更新、交易资源、产品发布信息以及 BlueDigitsFx 官方生态系统访问权限。 Telegram 生态系统
官方网站
MT4 版本 BlueDigitsFx Easy 123 System MT5 —— 强大的 MT5 反转与突破识别系统 一体化无重绘交易系统,专为识别市场反转与突破而设计 —— 适合重视市场结构、清晰信号以及确认型交易流程的交易者。 BlueDigitsFx Easy 123 System 是一款可视化 MT5 指标,并带有提醒功能,可帮助交易者轻松识别市场结构变化、突破以及趋势反转。 该指标遵循结构化的“123”交易模型: 步骤 1 :通过大箭头识别潜在衰竭区域中的新高或新低。 步骤 2 :发出市场结构突破信号,确认潜在趋势反转。 步骤 3 :通过小箭头和支撑/阻力点提供入场确认。 注意 :大箭头在K线收盘前可能会重绘,因为它会根据实时市场结构变化进行调整。
小箭头一旦出现后则为 100% 无重绘信号。 功能特点 大箭头:识别强烈的市场结构变化及潜在反转机会。 小箭头:100% 无重绘趋势信号。 支撑

BlueDigitsFx 官方生态系统入口 获取基础设施更新、交易资源、产品发布信息以及 BlueDigitsFx 官方生态系统访问权限。 Telegram 生态系统
官方网站
MT4 版本
BlueDigitsFx Spike And Strike Reversal MT5 —— 用于市场反转与动量分析的复合振荡指标 BlueDigitsFx Spike And Strike Reversal 是一款复合振荡指标,通过结合多个技术指标信号,帮助交易者识别潜在市场反转、动量变化以及趋势衰竭条件。 该指标整合了多种分析组件,包括基于振荡器的确认机制,并直接在图表上显示可视化信号,以支持结构化的市场反转分析。 Spike And Strike 专为希望在市场反转、回调和动量转换过程中获得额外确认的交易者而设计,适用于各种市场环境。
主要特点 基于振荡器的可视化反转分析 信号仅在K线收盘后确认,提高稳定性 适用于所有交易品种和时间周期 常用于 H1 及更高时间框架 内置提醒功能:弹窗、电子邮件、推送通知和声音提醒 可作为趋势和市场结构分析之外的额外确认层
如何使用 BlueDig

MT5 的 ALPHA TRADER 指 标是一种利用平均方向运动指数和 ATR 指 标的有效性的指标,该指标能够深入了解市场趋势以及使反转信号具有生命力的各个超卖和超买区域,因此,它是一种非常可靠的资源,可用于制定能够直观地向投资者提供反转信号的指标 - 因 为最终,该指标的作用是它通过使用彩色箭头准确地发出输入信号在交易图表上。 向下的 红色箭头指示卖出信号,而向上的蓝色箭头指示买入信号,但是,交易者必须确保不要盲目地使用该指标,因为他们不应丢弃常规例程从技术分析和看跌趋势来看,交易者只能决定对卖出信号进行优先排序,而在看涨趋势中,交易者可以决定仅对购买信号进行优先排序,尽管如此,交易者仍可以大幅度降低风险,尽管有时指标和交易者是错误的,但是,只要坚持严格的资金管理系统,交易者仍然会在大部分时间获利。 对于交易者而言,将指标与交易量指标一起使用非常重要,因为在某些移动中,它们可能是由于新闻或重大交易引起的,并且不表示趋势变化。 我 们建议在较短时期内进行操作时,应将其与更长时期一起进行分析,并遵循由 ALPHA TRADER 指示器的箭 头指示的最长时期的趋势。 推荐期
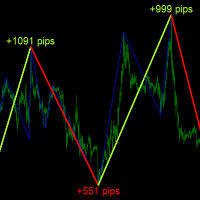
Description
ABC Trend Detector is an indicator that identifies impulses and trends in the market and displays their presence on the price chart. Found patterns are drawn as colored connecting lines between their highs and lows. Above / below each extreme, the value of the range (the number of pips) of the trend is displayed.
Recommendations
You can use this indicator to determine the trend and, accordingly, to determine the direction of opening a position or closing an opposite position.
P
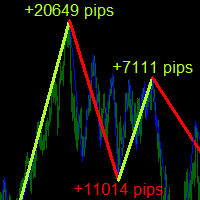
Description
ABC Trend Detector Pro is an indicator that identifies impulses and trends in the market and displays their presence on the price chart. Found patterns are drawn as colored connecting lines between their highs and lows. Above / below each extreme, the value of the range (the number of pips) of the trend is displayed.
Recommendations
You can use this indicator to determine the trend and, accordingly, to determine the direction of opening a position or closing an opposite position
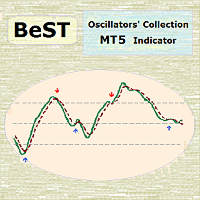
BeST_Oscillators Collection is a Composite MT5 Indicato r including the Chaikin , Chande and TRIX Oscillators from which by default Chaikin and TRIX Oscillators but not Chande Momentum Oscillator are contained in MT5 platform. It also provides for each Oscillator the option of displaying or not a Mov. Average as a Signal Line and the resulting Signals as Arrows in a Normal (all arrows) or in a Reverse Mode (without showing up any resulting successive and of same type arrows).
Analytically fo
FREE

Display the date, time and price according to the movement of the mouse cursor on the chart This is useful for discretionary trading.
It is an indispensable tool for verifying and studying past market prices and trades. Characteristic Date,Time and Price are displayed.
The value follows the movement of the mouse.
You can change the color of the text. Please refer to the video on youtube. For MT5 only.
FREE
At its most basic, the "Average Directional Movement Index Wilder" (ADXW) can be used to determine if a security/index/currencie is trending or not. This determination helps traders choose between a trend-following system or a non-trend-following system. Wilder suggests that a strong trend is present when ADXW is above 25 and no trend is present when ADXW is below 20. There appears to be a gray zone between 20 and 25. ADXW also has a fair amount of lag because of all the smoothing techniques. Ma
Бинарный индикатор находит свечной паттерн "Поглощение" и рисует соответствующий сигнал для входа рынок. Имеет встроенные фильтры и панель для просчета количества успешных сделок. Демо версия является ознакомительной, в ней нет возможности изменять параметры. Полная версия . Особенности Работает для всех валютных пар и любых таймфреймов. Индикатор рассматривает комбинацию из 2-х или 3-х свечей в зависимости от настроек. Имеется возможность фильтровать сигналы путем настройки количества свече
FREE
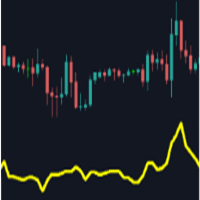
Main purpose: This indicator calculates the average of previous candles (a half of candle points). This value represent the strength of market (buy/sell) in each candle.
Parameters: . Period: indicating previous candles to calculate average . Shift: draw line at a shift on chart.
Tip: We can use this value to consider TP and SL of a position before opening.
FREE

Hurst Fractal Index Фрактальный Индекс Херста - показатель персистентности временного ряда При значении индикатора >0.5 временной ряд считается персистентным (тенденция сохраняется) При значениях индикатора явно < 0.5 временной ряд считается антиперсистентным (возможна смена направления движения) Для наглядности значения индекса усредняются периодом 2-3. Настройки индикатора: Max Bars - глубина истории расчета (кол-во баров на графике для которых произведён расчет) Data from Timeframe - исполь

******** 5 INDICATORS IN 1 *********** In statistics, the Zscore tells us the number of standard deviations by which the value of a raw score is above or below the mean value of what is being observed or measured. In trading the Zscore tells us the number of standard deviations by which the value of price is above or below a moving average of choice. For example a Zscore of 1.5 in a period of 20 tells us the closing price is currently 1.5 x standard deviations above the 20 period Moving Average

FibTracer is an interactive Fibonacci tool that is aim to improve and facilitate your Fibonacci trading style. This Indicator can generate Fibonacci Retracement levels in two different ways. You can select whether to draw Fibonacci Retracement levels based on you favourite ZigZag settings or you can let the indicator to draw Fibonacci Retracement level based on given number of periods. You can also set Mobile and Email notification for your favourite Retracement levels individually. With this i

This Indicator draws Fibonacci Extension levels in two different ways. You can select whether to draw Fibonacci Extension levels based on your favourite ZigZag settings or you can let the indicator to draw Fibonacci Extension level based on given number of Bars or Candles. You can also set Mobile and Email notification for your favourite Extension levels individually. With this indicator you will not have to feel lonely as the it can generate Voice alerts, which will keep you focused on your
BW Dance - Bill Williams Trading Chaos Signal MTF Indicator for MetaTrader 5
!!! This indicator is not a trading system !!!
This is only a convenient tool for receiving signals of the Bill Williams trading system in visual and sound mode - Signals are not redrawn/ not repainting
The main idea of the indicator:
display current signals of the BW system on the right edge of the chart, according to the principle HERE and NOW output signals in three ways:
next to the price scale under / abo

I present to you an indicator for manual trading on DeMark's trend lines. All significant levels, as well as the indicator signals are stored in the buffers of the indicator, which opens the possibility for full automation of the system. Bars for calculate (0 = unlimited) - Number of bars to search for points DeMark range (bars) - Shoulder size to determine point

Super Zone For several years of observing the principles of the market, Super Zone worked, both then and now, because the indicator allows you to see the trading range of the week and even the month that major market participants use. It’s very easy to use, we work on H4 in the weekly range ( in the tester it doesn’t work in the demo mode ) - we sell from the upper zones, we buy from the lower ones. It marks the zones from the beginning of the week (month) that are not redrawn , works on
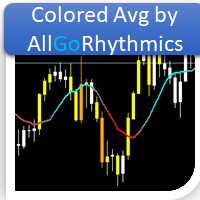
Média Móvel que possui todos tipos de Cálculo comum: Simples Exponencial Suavizada Ponderada Conta com suporte para aplicação sob outros indicadores!
Seu principal diferencial é o esquema de cores em GRADIENTE que, de acordo com a mudança no ângulo da média, altera suas cores conforme demonstrado nas imagens abaixo. Com isso, espera-se que o usuário tenha uma percepção mais suavizada das pequenas alterações.
Bons trades!!
FREE
Это специальная утилита, для подключения внешнего индикатора к торговой панели . Она позволяет получать данные из буфера индикатора и рисует стрелочные объекты для передачи их в торговую панель. Входные параметры
Number of call buffer - номер индикатора для покупки Number of sell buffer -номер индикатора для продажи Indicator window - окно индикатора Indicator position in list - позиция индикатора в списке Default value of indicator - значения по умолчанию для индикатора Show information - показ
FREE

Stochastic Reversal allows you to recognize reversals professionally. Stochastic Indicator: This technical indicator was developed by George Lane more than 50 years ago. The reason why this indicator survived for so many years is because it continues to show consistent signals even in these current times. The Stochastic indicator is a momentum indicator that shows you how strong or weak the current trend is. It helps you identify overbought and oversold market conditions within a trend. Rules

关于 Yasha Firooz
Yasha 于 2012 年在一家财富管理公司担任员工。
他被委派负责各种办公室和技术工作,并能够将财富管理团队的一些成员与创始人的需求联系起来。这家财富管理公司在交易行业投入了大量资金。
关于 FX Fishing MT4(Meta Trader 4 指标)
Yasha 被市场波动所困扰,并一直在思考是否有可能感受到牛市和熊市之间的市场波动。因此,制定了一个可以做到这一点的指标。每个上涨点都计算在内,每个下跌点也计算在内。这两个刻度显示如下方显示的指标图像中:
- 绿色数字(上涨刻度/点)
- 橙色数字(下跌刻度/点)
中间下方显示的数字是上涨和下跌波动之间的差异。 表示牛市或熊市交易量强劲。
钓鱼指标以 1:2 的比例工作,右侧的彩色圆点上显示该比例。 绿色 = 牛市 红色 = 熊市 橙色 = 横向
比例显示在右侧,即显示的彩色圆点。
该指标可以通过几种方式协助您的交易。 您可以试用演示版并找到最适合您风格的指标。 *请注意:这是一个非常直观的指标。 我已将价格从 45 美元降至 30 美元
我如何使用 FX Fishing M

**Resistances and Support — 带强度评级与提醒的支撑阻力区**
支撑与阻力是入场时最重要的因素之一。本指标会自动为你找到它们,并显示每个区的强度。
它不画简单的线,而是把支撑与阻力画成「区域」,因为价格对区域而非精确价位作出反应。每个区域按价格尊重它的次数评级——区域越强,画得越醒目。你能立刻看出哪些位置最重要。
**如何使用:** - 在支撑区与阻力区之间交易 - 把止损放在区域之外(卖出放上方,买入放下方) - 把止盈设在下一个区域 - 当多个区域挤在一起、几乎没有间隔时,最好等待——该区域过于拥挤
**功能:** - 根据近期价格摆动自动检测多个支撑与阻力区 - 按强度(触及次数)为每个区评级——越强越醒目 - 阻力区画在价格上方、支撑区在下方,各有颜色 - 每个区上有小标签显示类型与强度(例如 R x4、S x5) - 当价格触及或突破某个区域时提醒你(弹窗及可选手机推送)
**输入参数:** - 回溯K线数、枢轴强度、区域宽度(ATR)、最大区域数、最少触及次数 - 阻力/支撑颜色、标签开关、标签字号、向右延伸 - 触及提醒、突破提醒、弹
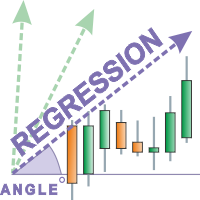
The Regression indicator shows the direction of the trend. The graph shows up to 3 regression lines with different time periods. The straight line is built as the average inside the wave channel of the price movement (shown on one ScreenShot).
In this case, you can disable any of the lines. Also, the indicator allows you to change the color for each line. It is interesting to calculate the relative angle in degrees. The angle display can also be turned off.
Thanks to this indicator, you can s

The indicator draws support and resistance lines on an important part of the chart for making decisions. After the trend line appears, you can trade for a breakout or rebound from it, as well as place orders near it. Outdated trend lines are deleted automatically. Thus, we always deal with the most up-to-date lines. The indicator is not redrawn .
Settings:
Size_History - the size of the calculated history. Num_Candles_extremum - the number of candles on each side of the extremum. Type_Arrow

The WT Vwap Bands indicator is an indicator that combines price and volume, helping to show whether the price is within the "fair price", overbought or oversold.
The indicator code was designed for performance and has already been tested in a real trading account.
In addition to the visual inputs (color, thickness and line style), the user can define a% value that depends on the price.
The default values work with the most distant band at 1% of the price and then dividing this distance in
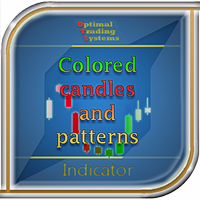
Some candles have a strong tendency to continue the movement, or its turn. Using the Colored candles and patterns indicator, such candles are clearly visible. This indicator calculates the parameters of each candle, as well as its volume, and after that it colors the candles depending on its strength and direction. Bullish candles turn green and bearish candles turn red. The greater the strength of the bulls or bears, the brighter the color. If desired, the colors can be changed. In addition, t

趨勢指示器,在圖表上繪製2條不同顏色的條。一個車道換到另一個車道意味著市場在相反的方向反轉。指標還在圖表上放置了3條平行的虛線高,中,低線,分別顯示了成形反轉的頂部,中間,底部。
參量 深度 - 指標計算的深度,參數越高,信號越長 ; 偏差 - 繪圖期間指標的偏差 ; 後退步 - 轉向顯示的強度越小,強度越大 .
___________________________________________________________________________________________________________________________
* 交易策略 . - 繪製上升線時,這是一個買入信號 ; - 繪製下降趨勢時,這是賣出信號 .
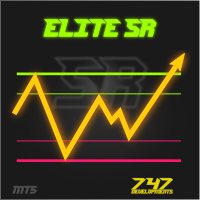
Elite SR - Advanced Level Indicator for automatic detection of support and resistance levels with different degree of credibility should become a part of your trading arsenal. This indicator is accessible via iCustom function and provides level values as well as their degree of credibility. Elite SR is fully adjustable and can work on any time-frame with any trading instrument!
Important information For all detailed information about this indicator you can visit 747Developments website.
Featur

VolumeFlow is a Volume Accumulation / Distribution tracking indicator. It works in a similar way to OBV, but it is much more refined and includes the options to use: Classical Approach = OBV; Useful Volume Approach; Gail Mercer's approach; Input Parameters: Input Parameters: Approach Type: Explained above; Volume Type: Real or Ticks; Recommendations: Remember: The TOPs or BOTTONS left by the indicator are good Trade Location points. This is because the players who were "stuck" in these regions w
FREE
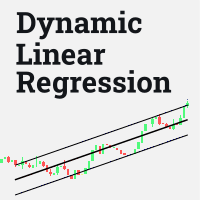
Este indicador traça uma reta baseada em regressão linear, esta reta é dinâmica e é atualizada a cada tick. O cálculo de regressão linear é feito considerando o número de candles definido pelo tamanho da janela fornecida pelo usuário. São traçadas duas linhas, uma superior e uma inferior, para guiar a estratégia do usuário, a distância dessas linhas para a linha central deve ser configurada. É possível definir os estilos, cores e espessuras de cada uma das linhas.
Esse indicador foi inicialmen
FREE

Trend Factor is an indicator based on the calculation of price values to answer questions about what direction the trend is acting on the market at the moment and when this trend will end.
By launching the Trend Factor indicator, the user will see two lines and bars of different colors, which can change color to green during an uptrend, to red during a downtrend or to be yellow during an uncertainty.
The trader uses the Trend Factor indicator to determine the market situation. This is a tre

Classic RSL This is the classic indicator "Relative Strength Levy" (RSL), according to Dr. Robert Levy's study, called "The Relative Strength Concept of Common Stock Pricing", which was released as a hardcover book in late 60's of the last century.
Key concept Use this indicator on various instruments to compare their relative strength: The resulting analysis values will fluctuate around 1 The strongest instruments will have the highest RSL values (above 1) and the weakest instruments wi
XP Moving Average MT5 – Your All-in-One Trading Powerhouse Master the markets with XP Moving Average MT5 , the ultimate moving average indicator for MetaTrader 5. Whether you’re scalping , swing trading , or investing long-term , this versatile tool combines 9 advanced moving averages in one—enhanced with a modern graphical dashboard and real-time alerts . With AI-powered insights coming soon , XP Moving Average is your key to smarter, more profitable trades . Why Choose XP Moving Average?

Simple Calendar Events is an indicator that will mark important Important Economy Events on your chart. For example, if you are trading something that is USD based, you would like to know when some important events are coming, you can expect some volatility or some different Price action, so you can base your strategy on it. If you trade something that is country based you can also choose that, and it will show you when the event is, so you can be prepared for it. When you hover with the mouse
FREE

The Stepper indicator generates Signals in strong Trend zones. Even when the Trend is set, we must filter when to ENTER or HOLD the trigger. The Trend is represented by two lines: Trend UP and Trend DOWN. W e are in a Bullish trend when the Trend UP (Green line) is above. And in a Bearish trend when the Trend DOWN (Pink line) is above.
When the momentum is aligned with the Trend , this indicator generates: BUY signals (LIME line) SELL signals (RED line) The user is alerted of the scenario, at
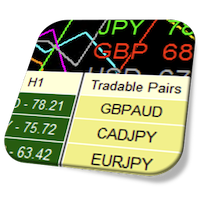
Currency Strength Meter is the easiest way to identify strong and weak currencies. This indicator shows the relative strength of 8 major currencies + Gold: AUD, CAD, CHF, EUR, GBP, JPY, NZD, USD, XAU. Gold symbol can be changed to other symbols like XAG, XAU etc. By default the strength value is normalised to the range from 0 to 100 for RSI algorithm: The value above 60 means strong currency; The value below 40 means weak currency;
This indicator needs the history data of all 28 major currency
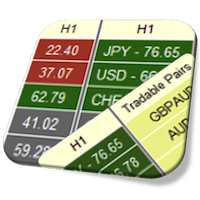
Currency Strength Meter is the easiest way to identify strong and weak currencies. This indicator shows the relative strength of 8 major currencies + Gold: AUD, CAD, CHF, EUR, GBP, JPY, NZD, USD, XAU. Gold symbol can be changed to other symbols like XAG, XAU etc.
By default the strength value is normalised to the range from 0 to 100 for RSI algorithm: The value above 60 means strong currency; The value below 40 means weak currency;
This indicator needs the history data of all 28 major currency
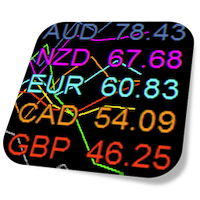
Currency Strength Meter is the easiest way to identify strong and weak currencies. This indicator shows the relative strength of 8 major currencies + Gold: AUD, CAD, CHF, EUR, GBP, JPY, NZD, USD, XAU. Gold symbol can be changed to other symbols like XAG, XAU etc.
By default the strength value is normalised to the range from 0 to 100 for RSI algorithm: The value above 60 means strong currency; The value below 40 means weak currency;
This indicator needs the history data of all 28 major currency
该多时间框架和多交易品种指标可识别随机指标信号线何时穿过随机指标主线。作为替代方案,它还可以在随机指标离开(没有信号线穿过主线)超买/超卖区域时发出警报。作为奖励,它还可以扫描布林带和 RSI 超买/超卖交叉。结合您自己的规则和技术,该指标将允许您创建(或增强)您自己的强大系统。 特征 可以同时监控市场报价窗口中可见的所有交易品种。仅将指标应用于一张图表即可立即监控整个市场。 可以监控从 M1 到 MN 的每个时间范围,并在识别出交叉时向您发送实时警报。支持所有 Metatrader 本机警报类型。 该指示器包括一个交互式面板。请参阅单独的屏幕截图以获取解释。 指标可以将信号写入文本文件 或全局变量 专家顾问 (EA) 可以使用它 进行自动交易。比如 这个产品 。 输入参数
输入参数的描述和解释可以 在这里 找到 。 重要的
请注意,由于多功能性,安装指标的图表上不会绘制买入和卖出建议,也不会绘制线条和箭头。相反,这些对象将绘制在单击图表面板中的信号时打开的图表上。 强烈建议将指标放在干净(空)的图表上,上面不要有任何其他可能干扰扫描仪的指标或 EA 交易。
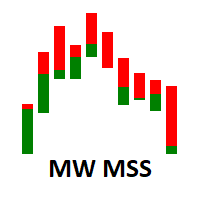
The Martinware Market Sides' Strength indicator shows the candlestick chart in a different manner allowing for a clearer view of which side, bullish or bearish is dominating the asset in the current period. As a bonus, it can also show an internal area that can be used to visualize two levels of Fibonacci retracements inside the bars.
The default configuration shows the MSS bars with 4 main colors, two representing the bullish force, and two representing the bearish one. The primary colors ar
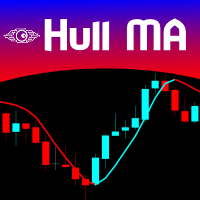
The Hull Moving Average is not very well know in novice and maybe in intermediate trading circles, but it is a very nice solution created by the trader Alan Hull - please visit www.AlanHull.com for full details of his creation. The purpose of this moving average is to solve both problems that all famouse and common moving averages have: Lag and Choppiness . The implementation we did has, apart of the Period configuration and Price type to use in the calculations, a "velocity" factor, which could
FREE
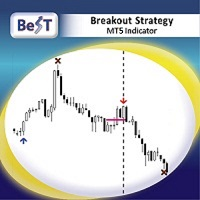
BeST_Breakout Strategy MT5 is an Metatrader Indicator based on a proprietary algorithm implementing a very powerful tool that can exploit every breakout leading to huge market movements.It timely locates the most likely points for Entering the Market as well as the most suitable Exit points and can be used successfully as a standalone Trading System which performance is often accompanied by very impressive statistics of % Success Ratio and Profit Factor . The BeST_Breakout Strategy is a non-rep
Chart Slice is a very convenient multi-timeframe indicator, with which you can see market information at once on several time slices. This will allow the trader to learn quickly and most importantly understand the vibrant market . The author himself went this way and this indicator helped incredibly. You probably have often wanted to see in detail why at a given point in time the price was rapidly moving away from a certain level or, on the contrary, stopping there. And for this you had to chan
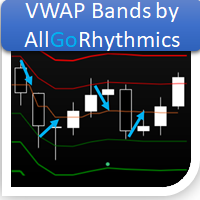
This indicator calculates the Daily VWAP and projects its Bands in 3 upper levels and 3 lower levels (Supports and Resistances), offset by the Standard Deviation selected by the user.
How to configure: Choose the symbol and the desired graphic time; Choose the type of price that is most suitable to calculate the Desired VWAP; Choose whether or not you want the Bands to be plotted; Choose the type of Volume you want to use (Ticks or Real); Choose the type of Calculation of the Bands (Deviation

This indicator allows you to monitor and correlate several assets simultaneously. Using an operational reading technique applied in Multimarkets, the user is able to observe the behavior of other assets visible to the current asset that is operating. With this, the user's ability to make decisions becomes more robust and grounded.
The indicator has the capacity to list up to 4 assets, with the possibility, also, to change the type of quote and be used both for the current price and the past pr
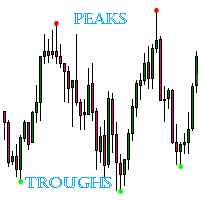
The indicator detects important peaks and troughs (extremes) on the chart. These points can be used to plot support/resistance levels and trend lines, as well as any other graphical analysis. These points can serve as reference points for setting trading orders. The indicator does not redraw .
Settings:
Size_History - the size of the calculated history. Num_Candles_Right - number of candles to the right of the peak or trough.
Num_Candles_Left - number of candles to the left of the peak or

Do you use volume in your reading of the market?
Certainly many traders use it, and do not imagine operating without it.
The Color Histogram Volume Set indicator allows the user to choose the value that he considers interesting to monitor.
When you pass this you will have visual confirmation and if you want you will also have the audible alert that is given by the indicator.
Of course, there are other ways to try to find a high volume, such as assessing whether the volume is above av

Do you use volume in your reading of the market?
Certainly many traders use it, and do not imagine operating without it.
The Color Candle Volume Set indicator allows the user to choose the value that he considers interesting to monitor.
When you pass this you will have visual confirmation on the price chart and if you want you will also have the audible alert that is given by the indicator.
Of course, there are other ways to try to find a high volume, such as assessing whether the vol

PROMOTIONAL PERIOD - ONLY 2 COPIES LEFT OF FIRST 10 BUYERS AT PRICE 300,00$!!!
CHECK SCREENSHOTS AND COMMENTS FOR OUR STRATEGY RULES AND LIVE TRADES SIGNALS PULL IT BACK is a revolutionary trading system and a complete strategy with advanced algorithm developed to detect the trend direction after a PULLBACK , a RETREACEMENT or a KEY LEVEL BOUNCE . The goal of this indicator is to get as many pips as possible from market trend. Following strictly the rules of the strategy, you can become a
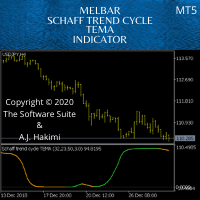
Schaff Trend: A Faster And More Accurate Indicator In Combination With The TEMA MACD - Scalping Systems Advantage
The Schaff Trend Cycle (STC) is a charting indicator that is commonly used to identify market trends and provide buy and sell signals to traders. Developed in 1999 by noted currency trader Doug Schaff, STC is a type of oscillator and is based on the assumption that, regardless of time frame, currency trends accelerate and decelerate in cyclical patterns. https://www.investopedia.c

Introduction to Fractal Pattern Scanner Fractal Indicator refers to the technical indicator that makes use of the fractal geometry found in the financial market. Fractal Pattern Scanner is the advanced Fractal Indicator that brings the latest trading technology after the extensive research and development work in the fractal geometry in the financial market. The most important feature in Fractal Pattern Scanner is the ability to measure the turning point probability as well as the trend probabil
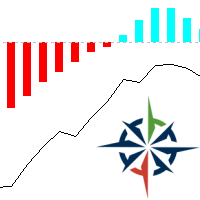
Designed by Fábio Trevisan, VolumeCapacitor is an indicator that, in addition to showing the volume quantity, shows its direction, having as main characteristic, the possible price tops and bottoms, or pullback areas. With its simple but not simplistic calculation method, it is able to determine areas where the defense of long and short positions can be assessed with a simple observation. VolumeCapacitor uses in its unique formula the OBV (Balance of Volume, or On-Balance Volume) idealized by J

The Larry Wiliams' indicator named WillSpread considers the influence of the secondary Asset (Symbol) on the current Asset (trading). Indicator essence is to transform the correlation between assets in accumulated history data, providing an opportunity to detect various peculiarities and patterns in price dynamics which are invisible to the naked eye. Based on this information, traders can assume further price movement and adjust their strategy accordingly. As exposed on his Book, Larry says: "a
MetaTrader市场是独有的自动交易和技术指标商店。
阅读MQL5.community用户备忘更多地了解我们提供给交易者的独特的服务:复制交易信号,自由职业者开发的自定义应用程序,通过支付系统完成的自动付款和MQL5云网络。
