 MetaTrader 5
 专家
 指标
 程序库
 实用工具
 窗口小部件
 规则
适用于MetaTrader 5的新技术指标 - 210
 技术指标的信号外汇和股票市场的开仓交易和平仓交易起着至关重要的作用。指标的本质就是一种交易品种的数学转换,旨在预测未来的价格变化。
测试技术指标可以更有利于预测市场行为并从中获利。

Tillson's T3 moving average was introduced to the world of technical analysis in the article ''A Better Moving Average'', published in the American magazine Technical Analysis of Stock Commodities. Developed by Tim Tillson, analysts and traders of futures markets soon became fascinated with this technique that smoothes the price series while decreasing the lag (lag) typical of trend-following systems.
FREE

Description This is an indicator for MT5 which has enhanced the "Fractals" indicator. "Fractals" indicator is included in MT5 by default but the draw line period is fixed at "5" and it cannot be modified. Thus I have reinvented the Fractals indicator with some useful function added. This tool will be useful especially for those who are learning how to draw good horizontal lines and wants to get some reference. Of course, those who are considering Fractals as an important horizontal line wil
FREE

A very simple indicator, but one that cannot be missed when carrying out your operations.
Fast and accurate Spreed information before entering a trade as well as the time to start another candlestick.
Spread refers to the difference between the buy (purchase) and sell (offer) price of a stock, bond or currency transaction.
Come and see our mql5 signals too. https://www.mql5.com/pt/signals/899841?source=Site +Signals+From+Author
FREE
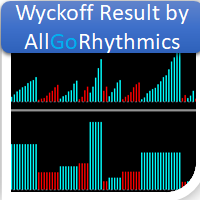
One of the best tools for analyzing volume, Weis Wave was devised by David Weis to facilitate reading the directional flow.
For the disciples of the Wyckoff method, this means an evolution, facilitating a predictive reading of the market, always looking for Accumulation and Distribution zones for traded assets.
For better understanding, in this indicator we try to cover every reading of EFFORT (traded volume) versus RESULT (price change). Thus, you can apply the indicator on the chart twice to
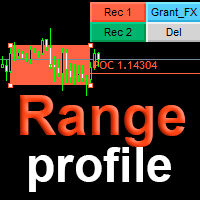
The indicator automatically calculates the level and real volume Point of control, and also displays the market profile for an array of candles, within the boundaries of a rectangle. If your strategy is based on taking profit on a rebound from price accumulations, the Range profile indicator will become the main tool in scalping trading. Point of control is calculated based on the total volume for each tick or minute candles, depending on the settings and trading timeframe. In the abse
The SSD With Histogram is a custom forex indicator for Metatrader 5 that shows a slow stochastic line, a signal line, and a histogram that reflects the difference between the slow line and the signal line. The indicator and its elements are displayed in a separate window just below your main trading chart.
parameters: k period; 5 D period; 3 time frame: m1 m5 m15 m30 h1 d1
FREE
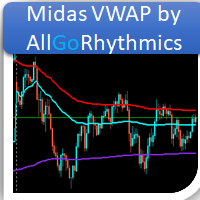
Volume Weighted Average Price (VWAP) is a trading benchmark commonly used by Big Players that gives the average price a Symbol has traded throughout the day. It is based on both Volume and price. This indicator contains Daily VWAP and MIDAS' VWAP, which means you are able to anchor the beggining of MIDAS' calculations and, therefore you will be able to use this methodology to study price versus volume moves after anchor point. You will be able to anchor up to 3 HIGH MIDAS VWAP's and 3 LOW.
Wish
FREE

A lot of professional traders use high quality divergence signals as a part of their strategy to enter a position. Spotting correct divergences quickly can often be hard, especially if your eye isn’t trained for it yet. For this reason we’ve created a series of easy to use professional oscillator divergence indicators that are very customisable so you get only the signals you want to trade. We have this divergence indicator for RSI, MACD, Stochastics, CCI and OBV. RSI: https://www.mql5.com/en/
A lot of professional traders use high quality divergence signals as a part of their strategy to enter a position. Spotting correct divergences quickly can often be hard, especially if your eye isn’t trained for it yet. For this reason we’ve created a series of easy to use professional oscillator divergence indicators that are very customisable so you get only the signals you want to trade. We have this divergence indicator for RSI, MACD, Stochastics, CCI and OBV. RSI: https://www.mql5.com/en/ma

A lot of professional traders use high quality divergence signals as a part of their strategy to enter a position. Spotting correct divergences quickly can often be hard, especially if your eye isn’t trained for it yet. For this reason we’ve created a series of easy to use professional oscillator divergence indicators that are very customisable so you get only the signals you want to trade. We have this divergence indicator for RSI, MACD, Stochastics, CCI and OBV. RSI: https://www.mql5.com/en/

A lot of professional traders use high quality divergence signals as a part of their strategy to enter a position. Spotting correct divergences quickly can often be hard, especially if your eye isn’t trained for it yet. For this reason we’ve created a series of easy to use professional oscillator divergence indicators that are very customisable so you get only the signals you want to trade. We have this divergence indicator for RSI, MACD, Stochastics, CCI and OBV. RSI: https://www.mql5.com/en/

A lot of professional traders use high quality divergence signals as a part of their strategy to enter a position. Spotting correct divergences quickly can often be hard, especially if your eye isn’t trained for it yet. For this reason we’ve created a series of easy to use professional oscillator divergence indicators that are very customisable so you get only the signals you want to trade. We have this divergence indicator for RSI, MACD, Stochastics, CCI and OBV. RSI: https://www.mql5.com/en/
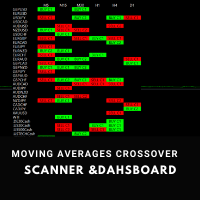
Moving Average Crossover Scanner and Dashboard For MT5 Advanced Moving Average Scanner Moving Averages Crossover Dashboard MT4 Version of the product can be downloaded: https://www.mql5.com/en/market/product/69260 The indicator scans the market and sends signals and alerts for Moving Average crossovers, death cross and golden cross.
Crossovers are one of the main moving average ( MA ) strategies.
MA Crossover ( cut ) strategy is to apply two moving averages to a chart: one longer and one sho

Madx Cobra Madx Cobra Indicator. Create to traders both experienced and inexperienced to use it because it is a basic indicator
How to use : Setting Indicator 1. MA Fast : Moving Average fast (10) 2. MA Slow : Moving Average Slow control trend markets.(200) 3. ADX : Control trend(5) 4. For alert you can set to alert Next bar or instant bars.
When arrow sky blue show or arrow up, you can entry order "Buy" or "Long" and arrow red show or arrow down, you can entry order "Sell" or "Short"
S
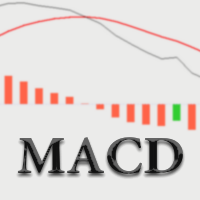
Simple and fast MACD oscillator with MACD and signal lines and two-color histogram.
I wasn't happy with the Meta Trader MACD oscillator as it's not immediate to read and the other ones I tried felt a bit laggy or added unneeded features on top, so I decide to make one that feels familiar to me. I hope you will find it useful!
Contact me for any issues or bugs and I will try to help the best I can.
這是第二種格式的分時圖。 有對 OpenCL 的支持。 設置非常簡單 - 您可以選擇一周中的哪幾天計算指標: 例如,對於此類金融工具,其報價在周末不更新,您必須在第 6 天和第 7 天選擇一周中的任何其他日子,但是,例如,對於比特幣,如果經紀人更新報價,您可以 指定第 6 天 - 星期六,第 7 天 - 星期日。 如果您願意,您還可以自定義顏色。 這是一條自適應且平滑的顏色線。 該指標在策略測試器中不起作用 - 購買前請觀看視頻。 /////////////////////////////////////////// 我希望這個指標對您成功交易非常有用。 /////////////////////////////////////////// 祝你好運。

FREE

算术平均值或中位数可用于确定时间序列的中心趋势的度量。这两种方法都有一些缺点。算术平均值由简单移动平均线指标计算。它对排放和噪音很敏感。中位数表现更稳定,但在区间边界处会丢失信息。 为了减少这些缺点,可以使用伪中值信号滤波。为此,取一个小长度的中位数,并将其递归地应用于所研究的金融时间序列周期的所有值。由于这种方法,该指标使您能够更准确地识别周期性和趋势性价格变动。 指标的外部参数: 启动指标时,在“参数”选项卡中,选择将用于计算的价格常数(默认为关闭); iPeriod - 指标周期。此参数的值越高,指标对最新价格变化的敏感性就越低。此参数的最小值为 3; MaxBars - 限制计算的历史深度。如果指标需要很长时间才能启动,这会很有用。如果 MaxBars = 0,则没有限制,指标将应用于整个图表。

///////////////////////////////////////////////// /////////////////////////////////
标准平均真实范围指标的改进版本。
这现在是精度和彩色平均线的两倍。
设置非常简单 - 您需要指定主周期和平均周期。
该指标的读数很容易理解,其含义与标准平均真实范围的含义相同。
///////////////////////////////////////////////// ///////////////////////////////////
我希望该指标对您成功交易非常有用。
祝你好运。 ///////////////////////////////////////////////// /////////////////////////////////

///////////////////////////////////////////////// /////////////////////////////////
该指标显示 1 分钟内价格变化的范围。 非常适合风险管理。 这是刻度图的标准平均真实范围指标的改进版本。
这现在是精度和彩色平均线的两倍。
设置非常简单 - 您只需要在必要时更改颜色。
该指标的读数很容易理解,其含义与标准平均真实范围的含义相同。 如果您在策略测试器中没有看到指标读数,请尝试快进,然后, 当读数出现时,在图形窗口中减慢速度。 由于策略测试器的特殊性,数据并不总是在那里正确显示。 在真实数据的终端中一切正常。
///////////////////////////////////////////////// ///////////////////////////////////
我希望该指标对您成功交易非常有用。
祝你好运。 ///////////////////////////////////////////////// //////////////////////////////////
Description
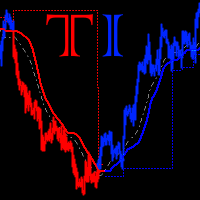
Trend Influencer is an indicator that determines the potential dynamics of the influence of trend wave movements on the market. The indicator is based on the value of moving averages corrected by the standard deviation. The indicator is displayed as a main dash-dotted moving average and a signal solid moving average. The signal moving average is colored blue or red depending on what type of trend is currently observed in the market. The indicator also draws inhibition levels - blue a
J.M.T.I
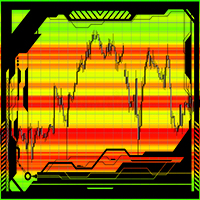
This indicator automatically shows a level or support and resistance in the currant market. Can be used on any time frame Can be used on any currency pair Works on the active bars in the window To add more bars one can simply zoom out. Red zones can be strong liquidity pools. Green zones usually is where an possible break out might occur. The higher the contrast of the colors the stronger the support or resistance levels will be. The indicator has an option to refresh on each tick (

Dark Sprint is an Indicator for intraday trading. This Indicator is based on Trend Following strategy, also adopting the use of the atr to determine the right volatility. We can enter in good price with this Indicator, in order to follow the strong impulse on the current instrument.
Key benefits
Easily visible sprint lines Intuitive directional arrows Automated adjustment for each timeframe and instrument Easy to use even for beginners Never repaints, never backpaints, Not Lag 100% compatibl

Binary MA Cross MA Cross indicator by 4Umbella
Create for traders both experienced and inexperienced to use it because it is a basic indicator
How to use : 1. MA Fast : Moving Average fast (Period 4 upto 50) 2. MA Middle : Moving Average Middle (Period 10 upto 100) 3. MA Slow : Moving Average Slow (Period 50 upto 200) to control trend markets.
and trader can be set for Apply to price (Close, Open,Low,High,Median,Typical,weightd)
For alert you can set to alert Next bar or instant bars.
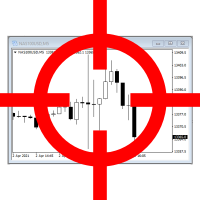
该指标旨在使对不同时间尺度上的许多图表的审查更快、更容易。 跨多个图表跟踪时间和价格 在一个图表上更改代码,同一代码的所有其他图表也将更改。 易于使用,快速掌握 该指标允许您识别鼠标指针在当前图表上的价格和时间,以及在同一交易品种上打开的所有其他图表。这使您可以快速查看多个图表上的信息,而通常您必须花一些时间来识别同一位置。 您还可以选择在所有打开的图表中只跟踪时间。这使您可以在寻找分歧时轻松导航。 如果您更改一个图表中的符号,则同一符号的所有其他图表将切换到新符号,并保持其时间范围设置。 如何使用
在查看图表时,我喜欢查看多个时间范围以确定趋势和交易水平。我创建了这个工具来帮助解决这个问题,也用于视觉回溯测试,我在其中查看了很长一段时间内的多个图表。 该工具会在屏幕上添加一个跟随鼠标指针的十字准线。当按下 CTRL 或 SHIFT 键时,它会被激活,因此它并不总是存在,而是在您需要时存在。 激活后,您可以在任何图表上指向您要跟踪的位置,在具有相同符号的任何其他图表上,十字准线也会在该图表上显示相同的时间和价格。其他窗口中的图表将自动滚动显示,以便时间/价格组合成为显示的中心。 您可以

趋势使您可以预测价格变动并确定交易结束的主要方向。可以使用适合交易者交易风格的各种方法来构建趋势线。 该指标根据 von Mises 分布计算趋势运动的参数。使用这种分布可以得到趋势方程的稳定值。除了计算趋势之外,还会计算可能的上下偏差水平。 该指标根据当前价格值更新其值。他的行为显示在视频中:
指标参数: iPeriod - 用于计算趋势和水平的柱数 Shift - 继续线向前的柱数 WidthTrend - 趋势线的宽度 WidthLvl1 和 WidthLvl2 - 水平线的宽度 StyleTrend - 趋势线样式 StyleLvl1 和 StyleLvl2 - 水平线样式 ClrTrend - 趋势线颜色 ClrUp - 水平线的颜色 ClrDown - 水平线的颜色

BEHOLD!!!
One of the best Breakout Indicator of all time is here. Multi Breakout Pattern looks at the preceding candles and timeframes to help you recognize the breakouts in real time.
The In-built function of supply and demand can help you evaluate your take profits and Stop losses
SEE THE SCREENSHOTS TO WITNESS SOME OF THE BEST BREAKOUTS
INPUTS
MaxBarsback: The max bars to look back
Slow length 1: Period lookback
Slow length 2: Period lookback
Slow length 3: Period lookback
Slow leng
FREE
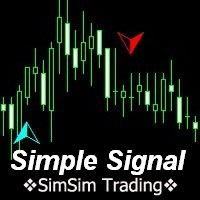
MT5 trend indicator works without redrawing. Provides signals for entering trades, works on charts of any instrument. Трендовый индикатор МТ5, работает без перерисовки. Выдает сигналы для входа в сделки, работает на графиках любого инструмента. Input parameters are for styling and messages only. / Входные параметры только для оформления и сообщений. All original signal calculations do not need additional parameters. / Все оригинальные расчеты сигнала, не нуждаются в дополнительных параметрах.
In order to detect "Big activity", new elements of the VWAP standard indicator were incorporated into this project.
In short, the plotted lines represent the moving average with EMA[VWAP]=VWAP[EMA].
Averages of the prices have been combined with volumetric weights and exponential decay.
Also, it was included the same weights to compute the standard deviation.
The parameter called as "strain" is a linear constant shifting the result (strain)xSD(VWAP).
So, a any set of bands can be plotted.
Also,
An indicator of patterns #47 and #48 ("Triangle, ascending" and "Triangle, descending") from Encyclopedia of Chart Patterns by Thomas N. Bulkowski.
Parameters: Alerts - show alert when an arrow appears Push - send a push notification when an arrow appears (requires configuration in the terminal) PeriodBars - indicator period K1 - an additional parameter that influences the accuracy of pattern shape recognition K2 - an additional parameter that influences the accuracy of pattern shape recognit
An indicator of pattern #49 ("Triangle, symmetrical") from Encyclopedia of Chart Patterns by Thomas N. Bulkowski. Parameters: Alerts - show alert when an arrow appears Push - send a push notification when an arrow appears (requires configuration in the terminal) PeriodBars - indicator period K - an additional parameter that influences the accuracy of pattern shape recognition ArrowType - a symbol from 1 to 17
ArrowVShift - vertical shift of arrows in pixels ShowLevels - show lines ColUp - co

An indicator of patterns #39 and #40 ("Rounding Tops" and "Rounding Bottoms") from Encyclopedia of Chart Patterns by Thomas N. Bulkowski. Parameters: Alerts - show alert when an arrow appears Push - send a push notification when an arrow appears (requires configuration in the terminal) PeriodBars - indicator period K - an additional parameter that influences the accuracy of pattern shape recognition. Changes from 0 to 1 ArrowType - a symbol from 1 to 17 ArrowVShift - vertical shift of arrows

An indicator of patterns #11 and #12 ("Diamond Tops" and "Diamond Bottoms") from Encyclopedia of Chart Patterns by Thomas N. Bulkowski. Parameters: Alerts - show alert when an arrow appears Push - send a push notification when an arrow appears (requires configuration in the terminal) PeriodBars - indicator period K - an additional parameter that influences the accuracy of pattern shape recognition ArrowType - a symbol from 1 to 17 ArrowVShift - vertical shift of arrows in pixels ShowLevels - s
An indicator of patterns #37 and #38 ("Rectangle Tops" and "Rectangle Bottoms") from Encyclopedia of Chart Patterns by Thomas N. Bulkowski. Parameters: Alerts - show alert when an arrow appears Push - send a push notification when an arrow appears (requires configuration in the terminal) PeriodBars - indicator period VertexCount - the number of tops and bottoms: 2, 3, 4. ArrowType - a symbol from 1 to 17 ArrowVShift - vertical shift of arrows in piхels ShowLevels - show levels ColUp - colo
An indicator of patterns #7 and #8 ("Bump-and-Run" and "Bump-and-Run Reversal") from Encyclopedia of Chart Patterns by Thomas N. Bulkowski. Parameters: Alerts - show alert when an arrow appears Push - send a push notification when an arrow appears (requires configuration in the terminal) PeriodBars - indicator period K - an additional parameter that influences the accuracy of pattern shape recognition ArrowType - Character: from 1 to 17 ArrowVShift - vertical shift of arrows in pixels ShowL
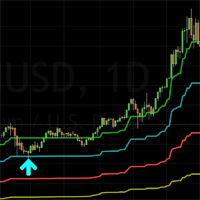
You can think of these indicators as moving pivot points. MasterChartsTrading Price Action Indicators show good price levels to enter or exit a trade. The Blue indicator line serves as a Bullish Trend setter. If your instrument closes above the Blue line, we think about going Long (buying). When your trading instrument closes below the Red line, we think about Shorting (selling). It is very easy to read price action if you have a reference point. These support/resistance lines are there to help
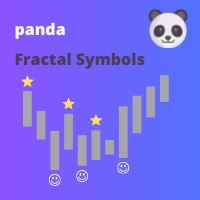
This indicator displays fractal symbols and bars Use this indicator to show different symbols for bearish and bullish fractals: Choose from 144 symbols (refer to table below) Colors, size and offset of fractals can be modified Fractal price bar or candle color can be changed Hide fractals and show fractal price bar only Frequency in fractal calculation can be changed
How to use 1. Select which symbols to use for bearish and bullish fractals; 2. Select which colors to use for bearish and bullis
FREE

DYJ Tradays Economic Calendar is calendar Indicators of macroeconomic events for fundamental market analysis. Therein you will find financial news and indicators for the largest global economies – from the US and the EU to Australia and Japan, a total of 23 economies, involving more than 60 currency pairs. More than 800 macroeconomic indicators and events are collected from public sources in real time. Historical, current and forecast values, as well as importance characteristics are available
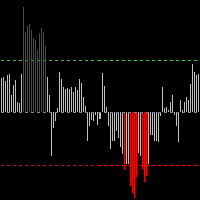
O Indicador BOPCoiote é uma releitura do indicador Balance of Power proposto por Igor Livshin em Agosto de 2001, publicado na Stocks and Commodities Magazine. Uma média móvel de 14 períodos é recomendada para gráficos diários. Embora o número de períodos possa variar dependendo da natureza do mercado e dos prazos.
O nível em que ele agrupa seus fundos e topos é considerado uma das propriedades mais importantes do indicador BOP.
Durante as tendências de alta, suas máximas frequentemente tocam os
Supply Demand RSJ PRO 自动绘制供需区域,为每个区域评级(Weak、Strong、Verified、Proven),并统计价格回测该区域的次数。适用于任何品种、任何周期。 功能 供给区:卖盘压过买盘、推动价格下跌的区域 需求区:买盘压过卖盘、推动价格上涨的区域 4 级区域评级:Weak、Strong、Verified、Proven 显示区域类型和回测次数的标签,看清市场持续尊重的价位 区域过滤(隐藏弱、未测试或已突破的区域)、区域合并与延伸 警报:弹窗、声音或手机推送 区域评级 弱 (Weak): 若被回测,很可能被突破。 强 (Strong): 曾改变趋势方向,短期内不太可能被回测。 已验证 (Verified): 经受住 1 至 3 次回测的强区域。 已证实 (Proven): 经受住 3 次或以上回测的强区域。 已突破 (Broken/turncoat): 被突破的区域角色互换:支撑变阻力,阻力变支撑。 使用方法 优先使用 Verified 和 Proven 区域;弱区域仅作参考。 在您的入场周期上,于区域内寻找确认信号。 回测次数越少,区域通常越“新鲜”。请
AW Super Trend - 这是最流行的经典趋势指标之一。它有一个简单的设置,让您不仅可以处理趋势,还可以显示由该指标计算的止损水平。 好处:
仪器: 货币对 、股票、商品、指数、加密货币。 时限:М15 及更高。 交易时间:全天候。 显示当前趋势的方向。 计算止损。 它可以在交易时使用。 三种类型的通知:推送、电子邮件、警报。 MT4 版本 -> 这里 / 新闻 - 这里 能力:
该指标以相应的颜色显示当前趋势方向。
- 蓝色表示当前时间范围内使用的交易品种的上升趋势。
- 该线的红色表示所选交易品种所用时间范围的下降趋势。
该指标可用于设置止损。
指标线不显示在条柱上方,而是相对于条柱有一些偏移。这个显示趋势线的地方可以被交易者用来设置止损。 当趋势发生变化时,指标线会在趋势变化的时刻重新绘制并显示为垂直线。该显示是由于该指标可用于标记止损。 可能会在较小的时间范围内过滤信号,并在较高的时间范围内显示方向。 怎么运行的:
1. 也就是说,如果您在 M15 或 M30 时间范围内工作
2. 在更高的时间框架上运行指标。 H4 或 D1。
3. 在 D1
FREE

///////////////////////////////////////////////// ///////////////////////////////// 该指标使用多项式回归来相应地绘制三个通道和六条线。 第一个通道及其边界具有大周期,第二个具有平均值,第三个具有小周期。 设置很简单 - 您只需要指定颜色并启用/禁用价格标签的显示。 该指标的读数也很容易理解。 通道线用于设置止损和获利水平。 如果您在策略测试器中没有看到指标读数,请尝试缩小图表窗口。 ////////////////////////////////////////////////// /////////////////////////////////// 我希望该指标对您成功交易非常有用。 祝你好运。
////////////////////////////////////////////////////////////////////////////////////////////////// 这很简单 - 没有设置。 只需要指定箭头的颜色和大小。 该指标的读数也很容易理解。 向上箭头是买入信号,向下箭头是卖出信号。 尝试在策略测试器中对其进行测试 - 你会喜欢的!!! ///////////////////////////////////////////////// /////////////////////////////////////////////////// 我希望该指标对您成功交易非常有用。 祝你好运。

Volume is a widely used indicator in technical analysis, however there is a variation that is even more useful than Volume alone: the Moving Average of Volume.
It is nothing more than a moving average applied to the popular Volume indicator.
As the name says, Volume + MA serves to display the transacted volume (purchases and sales executed) of a certain financial asset at a given point of time together with the moving average of that same volume over time.
What is it for? With the Volume + M
FREE
An indicator for receiving a lot of signals Can be used in all time frames and all markets Trade professionally using professional indicators yourself . Using this indicator, you will have a signal at any time. Do not miss any market movement. Get the signal very simply and clearly.
----------------------------------------------------------------------------------------------------------------------------------------------------------------------------------------------------
How it work:
Thi
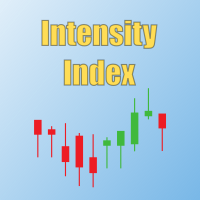
This new indicator allows you to know the intensity of the movements of a certain period. It is a powerful indicator with which it is easy to identify trend changes. It should be noted that this indicator is new and it is likely that nothing similar exists, it is also only available in MT. A high intensity indicates that during the established period the movement of the price in each bar has been of great amplitude, that is to say, that there is a great difference between the opening and closing

This indicator displays the spread with extra options Simple and easy to use and fully customisable: View as Pips or Pipettes Chart symbol can be hidden Text display can be changed Change colour and text styles Add or hide a decimal point Spacing options between inputs Default screen positions Screen position inputs
Pro version includes: Drag and drop box on the screen Add an alert when the spread is too high Alert colours for text and text box changeable
How to use 1. Simply use the default
FREE
目前全额购买折扣中
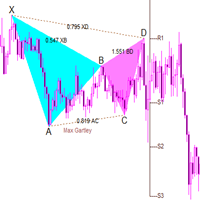
任何交易者的最佳伙伴! 该指标为经典的蝴蝶指标(谐波交易) ,默认可以识别20种形态并进行提示,也可以加入自定义形态的参数进行自定义提示, ,提示合适的止损和获利水平。 该指标内置的算法独一无二,为独门的波段算法 . 指标特性 Gartley形态又称Gartley“222”, 最初由美国形态技术分析的先驱H.M.Gartley在1935年提出的, 它发现了4个单独价格段之间的黄金分割关系,目的是指导大家怎样在无序的区间市场里交易。 目前在其基础中发展出非常多的形态, 本指标将其归类并且融合对波段的算法. 基本内容 包含20种价格形态 历史与当前的形态判断 止损和获利水平 电子邮件/声音/警报 基本设置 设置计算的周期。
设置指标波段算法1.灵敏 2.稳定 设置谐波指标计算模式选择 1.默认算法 2.自定义算法 3.两个算法都需要 自定义形态名称,以及XA-B MIN XA-B MAX AB-C MIN AB-C MAX BC-D MIN BC-D MAX XA-D MIN XA-D MAX共8个参数,加上形态名字共计

Indicator works with two moving average, when this moving averages cross, then change of colors. You can change the color both moving average and chage all setup if you want, like a native moving average . If you want to put this indicator, all buffers are disponible and their are work fine. In case of doubt or any question don't exitate to write me, I'll read and aswer all the question.

Sends price alerts conveniently to your Android/IOS device. Make sure push notifications are enabled in Metatrader settings and the PC/VPS is online 24/7. Price levels are updated automatically, but you can modify them in global variables, if needed. Suitable for any market instrument, but if notifications are too frequent, increase point value of the indicator parameter.
FREE
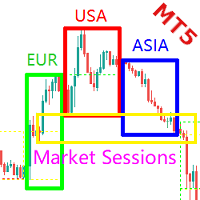
简介 本产品是迈达量化全系列产品中的一款显示交易时段及财经日历的系统,它是一款完美的工具,可将您的图表屏幕划分为3个主要市场时段。 借助 Market Sessions ,您可以看到确切时间发生了什么事件,及对应的K线波动幅度,不再盲目地分析图表,并为自己制定更有利的交易策略。 它将市场分成亚洲、欧洲、美洲等,通过 Market Sessions ,您可以立即了解自己所处的时间范围以及整个市场情况。它将对您的分析和交易产生积极影响。 设计原理 亚洲,欧洲,美洲分布地球的三个不同板块,由于地理位置的差异,生活习惯及投资思维都不同,所以如此划分。 市场交易的主要交易都是集中再每个时段开盘时间之后的一段时间,或者是重要财经日历发布的时间。 每天都是这三个时段的自己相互的博弈,对于研究以博弈为交易理念的投资者有参考价值。 Market Sessions的优点 不用翻看财经日历,节省分析时间 财经日历直接标注再图表上,直观显示财经日历对图表的影响 辅助学习博弈的交易策略 三个时段辅助寻找市场的拐点,寻找市场基本面波动的范围 如何设置 Show Continent Sessions - 显示洲交易
Any MA
Any Moving Average draws a moving average of * any indicator in a sub-window. Many Indicators included with MT5 are supported by default. You can add custom indicators as well. Settings Name Description Timeframe Select timeframe for calculation Source Indicator Select Indicator Custom Indicator Name Enter Custom Indicator Name ( when Source Indicator is set to Custom) Indicator Settings Source Indicator parameters ( separated by comma ) Moving Average Settings Moving Average para

With my custom built formula, you can visualize the market similar to displaying a heat map; with color showing at a glance the strength of the current trend, and the bar length showing the intensity of current movement. In more detail: Length of the histogram bar shows the average bar size of the last period, and color (from red to blue) shows the strength of upward or downward movement. Purple zones can indicate a change into a new trend. Bar period is adjustable so as to measure larger or sm
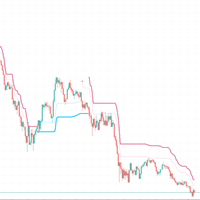
Using ATR to judge the trend, the dotted line is a short-term trend, and the solid line is a stable trend
Set different parameters according to different products. In most cases, please use the default parameters
Time cycle 5 minutes 15 minutes 1 hour
This indicator performs well in monetary products and gold
Index without future function
The entity part of the K line exceeds the entity trend part, which represents the trend conversion. Please wait for the K line to finish
B3 与 CME 期货(WIN、WDO、B3 股票、ES、NQ、CL、GC) Aggression Wave PRO 从当天开盘起逐根K线累计主动买入与主动卖出之间的差值,并以波浪形式绘制,让您看清整个交易时段内是哪一方在主导订单流。 需要经纪商提供该品种带主动方(买或卖)的真实成交数据。外汇、CFD 和大多数加密货币的数据没有成交记录,因此在这些品种的实时图表上窗口为空。 免费的 Aggression Wave RSJ 可查看当天的波浪。PRO 增加每根K线的主动买入、主动卖出和差值(8 种显示模式)、可配置的信号线、7 个提醒以及 30 个供 EA 调用的缓冲区。 可与 Delta Aggression Volume PRO 搭配使用:这里看当天累计的主动成交,那里看带反转柱和区间通道的每根K线差值。 功能 波浪:自当天开始买方更主动时在零轴上方显示为绿色,卖方更主动时在零轴下方显示为红色。每天(按服务器时间)从零重新开始。 波浪上的信号线按方向着色:上升、下降或不变。它在每天的第一根K线重新开始,图表上显示的之前各天也是如此。 逐K线柱:每根K线的主动买入、主动卖出和差值。 8

市场真的很喜欢整数,它们通常在下跌的市场中充当支撑,或在价格上涨时充当阻力。 该指标旨在以整数值绘制价格水平。它会自动执行此操作,但您也可以选择覆盖它并确定您希望看到的级别。 一轮水平可以像 10 步一样简单,例如 10、20、30 等,或者如果您从事外汇交易,您可能希望看到 0.1 或 0.01 的变化。 该指标绘制两类线,Major 和 Minor,每类都有不同的格式。这使您可以同时查看两个不同电平变化之间的变化。 警报
该指标包括当价格在可配置距离内时在主要、次要或两个价格水平发出警报的能力。 自动设置 默认情况下,该指标将为主要价格和次要价格确定适当的水平。它使用可配置的 DensityIndex 设置来做到这一点,该设置控制您希望随时在屏幕上看到多少行。 如果您设置自己的缩放比例,使用 MajorGap 和 MinorGap 设置,您仍然可以通过使用 ReduceAtScale 设置来获得限制在屏幕上绘制的线数的指标。 请查看屏幕截图以更清楚地了解此功能。
设置 基本配置 重大差距 当设置为 0.0 时,指标会自动计算出合适的刻度 小间隙 当设置为 0.0 时,指标会自动计
B3 与 CME 期货(WIN、WDO、B3 股票、ES、NQ、CL、GC) Delta Aggression Volume PRO 逐根K线显示主动买方与主动卖方哪一方成交更多,并标出主动成交与价格方向不一致的K线。 需要经纪商提供该品种带主动方(买或卖)的真实成交数据。外汇、CFD 和大多数加密货币的数据没有成交记录,因此在这些品种的实时图表上窗口为空。 免费的 Delta Aggression Volume 可查看基础的逐K线差值。PRO 增加反转柱、区间通道、总成交量移动平均线、6 个提醒以及 20 个供 EA 调用的缓冲区。 可与 Aggression Wave PRO 搭配使用:这里看每根K线的差值,那里看当天累计的主动成交。 功能 差值柱:主动买入较多时为绿色,主动卖出较多时为红色。 反转柱:差值为正但K线收跌时为蓝色,差值为负但K线收涨时为洋红色,显示被被动挂单吸收的主动成交。 区间通道:两条线显示每个差值相对近期K线的大小,提供两种计算模式,周期可设置。 每根K线主动成交总量的移动平均线(Information to Plot = PLOT_ALL)。 成交量类型:真

The Donchian Channel Channels are among the most popular tools of technical analysis, as they visually convey to the analyst the limits within which most price movement tends to occur. Channel users know that valuable information can be obtained at any time, whether prices are in the central region of a band or close to one of the border lines.
One of the best known techniques to explore these concepts is Bollinger Bands. However, John Bollinger was not the only one to research the application
FREE
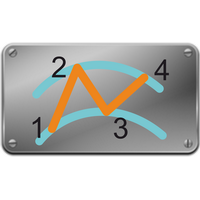
Convenient drawing of parabolic channels by four points (two lower and two upper extremums). Additional control keys: N (New) - Start drawing a new channel. C (Clear) - Deletes the current channel. By default, the current channel is the last channel. But you can click on the line of any channel to make it current. Click on the gear in the upper right corner to set some parameters for all channels or the current channel. All work is visible from the animated Gif.
Do not forget to express your w
FREE
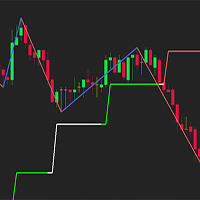
Simple indicator used in technical strategies to analyze tops, bottoms and reversal or continuation points. Developer information:
Line values and colors:
Buffer 0 : ZigZag line value;
Buffer 1 : ZigZag color value;
Buffer 2 : Median line value;
Buffer 3 : Median color value; Buffer to get the values of each top and bottom. Buffer 4 : Top value;
Buffer 5 : Bottoms value;
Buffer that returns the type of the last direction.
Buffer 9: 0 = Not updated, 1 = High, -1 = Low;
This indic
FREE

Hello!
Tired of constantly subscribing to other people's signals and earning pennies?
Want to manage your own trading?
Then you are on the right page!
It's very simple ==> buy my indicator ==> put it on the chart ==> blue arrow - buy ==> red arrow - sell. Even an infant can do it!
A handy histogram to trace the market direction.
Are you still here? Then read the parameter descriptions and take a look at the screenshots: Stoch K period - period for calculating the% K oscillator line. Stoch
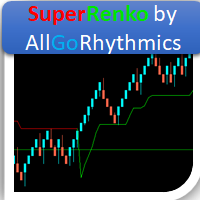
This indicator creates the perfect RENKO for you to work with timeless types of Candles! Due to RENKO characteristics of timeless, the indicator adjusts trading arrows (otherwise they would be lost) and leaves them exactly where the negotiation occurred in Renko Candles! In addition, this indicator shows exactly the division between days, in order to make it clear to user where each trading session started and ended! Furthermore, the following indicators were added, giving you bigger analysis p

The indicator draws the daily open line. Parameters
GMT shift (minutes) The time zone could be shifted. The value is given in minutes. Draw closest regular bar's open price This parameter could fine-tune the open price line when using GMT shift. Yes - Draw the open line based on the current chart period's closest regular bar No - Draw the open line based on the M1 chart's closest bar. Let's assume that your shift is 10 minutes, and you are using H1 chart and the first candle in every day is 0
FREE
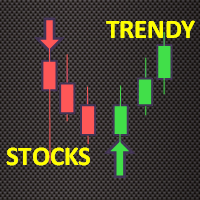
Trendy Stock is a price following indicator that uses Stochastic to show when the price is out of the oversold or overbought areas. The algorithm allows you to stay longer in a trend where the bulls or bears are in control. The indicator changes color immediately the price exits oversold/overbought state. In short, the downtrend [red] bars start to paint when the buying pressure decreases while the uptrend [green] bars form as the buy pressure kicks in. For MT4 version, follow :: https://www
FREE

Tom DeMark developed TD Sequential by hand, through a process of trial and error, in the 1970s. It never ceases to amaze me how something originally created to analyze daily price data can be applied so effectively, more than thirty years later, to any time frame—from one minute to one year—and to any market. The indicator has two components: TD Setup, which relies on momentum to define price ranges, and TD Countdown, which is trend based, and looks for low-risk opportunities to fade establishe
This indicator displays buy or sell signals according to Bill Williams' definition of the Trading Zone. [ Installation Guide | Update Guide | Troubleshooting | FAQ | All Products | Get Help ] Easy to use and understand Avoid trading flat markets Deterministic indicator with clear rules The indicator is non-repainting It implements alerts of all kinds It has straightforward trading implications. A blue arrow is a buy signal A red arrow is a sell signal According to Bill Williams trading in t
FREE
Scalp using the behavior of a short moving average, the indicator gives the slope and identifies the "hyper" moments.
Operational advice:
Use M1 chart. Period 20 : open buy after two rising lows; sell after two max downhill; avoid countertrend openings; when the line goes flat put a stop at the opening price. Avoid actions in low volatility timeslots. When the curve that draws the min / max is very flat, it is better to postpone at least 15'.
Period 50 : matches the trend, when it is at
FREE

You can easily draw horizontal ray line for the open, high, low and close price levels of any candle with this indicator. The indicators optionally shows texts above/below the ray lines, including the line price and distance from the Bid price in points. Parameters Mode Key + click - you should press o, h, l or c keys on the keyboard first, then click on any candle. Mouse hover + click - just move your mouse and point to any candle, then press o, h, l or c keys on the keyboard. Note: in both mod
MAs Crossover Dashboard Pro uses the value of Moving Average indicator. The periods of 2 MAs can be adjusted via the Edit boxes of this dashboard. The monitoring pairs will be selected by adding to the Market Watch (no need to set prefixes or suffixes) , you can monitor many pairs as you like. This dashboard will check almost popular time frame (M1,M5,M15,M30,H1,H4 and D1). The colors can be customized. The parameter of MAs can be set at the input. Crossover signal can be sent to you screen, yo
MetaTrader市场是独有的自动交易和技术指标商店。
阅读MQL5.community用户备忘更多地了解我们提供给交易者的独特的服务:复制交易信号,自由职业者开发的自定义应用程序,通过支付系统完成的自动付款和MQL5云网络。
