 MetaTrader 5
 专家
专家
 指标
指标
 程序库
程序库
 实用工具
实用工具
 窗口小部件
窗口小部件
 规则
规则
适用于MetaTrader 5的新技术指标 - 191
 技术指标的信号外汇和股票市场的开仓交易和平仓交易起着至关重要的作用。指标的本质就是一种交易品种的数学转换,旨在预测未来的价格变化。
测试技术指标可以更有利于预测市场行为并从中获利。
技术指标的信号外汇和股票市场的开仓交易和平仓交易起着至关重要的作用。指标的本质就是一种交易品种的数学转换,旨在预测未来的价格变化。
测试技术指标可以更有利于预测市场行为并从中获利。 
This indicator draws a vertical line repeatedly at the set time. The number of lines that can be set can be set arbitrarily. In addition, it is possible to set 4 types of lines. It is possible to change different times, colors, line types, etc. The time can be set to any time in minutes.
In the next version, we plan to display the high and low prices within the setting range.
FREE

This is a combination of 3 customized indicators, to make chart clean, we only showing up or down arrows. This gives good result in 1 hour and above time frames. In one hour chart, please set sl around 50 pips. Once price moves into your direction, it would be good to trail your sl by 30 to 50 pips to get more profit as this indicator kinda trend follower. In four hour chart, set ls around 100 pips. Works in all major pairs and winning ration is around 70 % based on back test.

Description
SuperCCI is an indicator based on the standard CCI indicator. It identifies and displays convergences/divergences in the market and forms the corresponding entry points. Also, using the trading channel index, it determines the direction of the trend and displays the levels of support and resistance .
Features Not repaint. Shows entry points. Shows the direction of the current trend and support/resistance levels. Has notifications. Recommendations
Use convergence/divergence to ide
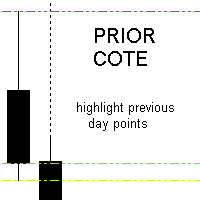
In this indicator you choice a data to be used from yesterday (high, low, open, close, etc) to automatically draw an line to be the zero. And, from that a percentage deviation ("Percentage to be used") is calculated and used to draw others line to both side until a limit be reached.
Both sides can have diferrent colours as show in screenshots. Also, more than one indicator can be used at same time.
FREE

FXC iDeM-DivergencE MT5 Indicator
This is an advanced DeMarker indicator that finds trend-turn divergences on the current symbol. The indicator detects divergence between the DeMarker and the price movements as a strong trend-turn pattern.
Main features: Advanced divergence settings
Price based on Close, Open or High/Low prices Give Buy/Sell open signals PUSH notifications
E-mail sending Pop-up alert Customizeable Information panel Input parameters: DeM Period: The Period size of the DeMarker in
"Spotting emerging trends, defining correction periods, and anticipating reversals can benefit your trading in many ways..." So be it: Higher Highs & Lower Lows indicator. This is an indicator created by Vitali Apirine and presented to the public through the article "Time To Buy. Time to Sell - It's a Stochastic, Higher Highs & Lower Lows" in the Stocks & Commodities magazine . This is a Momentum indicator that helps determine the direction of a trend. Higher Highs and Lower Lows are two indicat
FREE

A stochastic oscillator is a momentum indicator comparing a particular closing price of a security to a range of its prices over a certain period of time. The sensitivity of the oscillator to market movements is reducible by adjusting that time period or by taking a moving average of the result. It is used to generate overbought and oversold trading signals, utilizing a 0-100 bounded range of values. This indicator show 8 stochastic on one chart.
FREE

FXC iCCI-DivergencE MT5 Indicator
This is an advanced CCI indicator that finds trend-turn divergences on the current symbol. The indicator detects divergence between the CCI and the price movements as a strong trend-turn pattern.
Main features: Advanced divergence settings
Price based on Close, Open or High/Low prices Give Buy/Sell open signals PUSH notifications
E-mail sending Pop-up alert Customizeable Information panel Input parameters: CCI Period: The Period size of the CCI indicator.
CCI Ap
For those who feel that regular RSI is too fast and too noisy to be used on regular trades or in EAs and want to have an alternative to meter the Momentum of the Price, here is a solution presented on the great article of the Technical Analysis of Stocks & Commodities magazine (April, 2015), by Vitali Apirine, called: Slow Relative Strenght Index . Its reading is almost the same as the regular RSI, but its levels of Overbought and Oversold are 80 and 20 instead. SRSI is very powerful to show div
FREE

The Oscar, one of my favorite indicators. This is my enhanced Version of it with more options and better visuals. Many different averaging methods Oscar changes color on signal cross, but not too volatile (3% extra threshold) Adaptable Divisor, higher numbers lead to more signals, due to higher fluctuations. Its a fast but quite accurate trend direction indicator. Play around with the settings and make it match to your setup. GL trading Please follow me on Twitter https://twitter.com/semager and
FREE
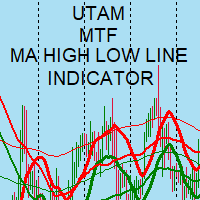
MTF Moving Average High Low line. I use it in my MT5 and MT4 robots in the round. Look at the robots and indicators I put up under my name. Good luck trading! :)
MTF Moving Average (Mozgó Átlag) High (felső) Low (alsó) line (vonala). MT5 és MT4 robotomban használom a fordulóban. Nézd meg a nevem alatt milyen robotokat és indikátort raktam fel . Sok sikert a kereskedéshez! :)
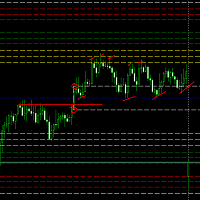
Projeção de alvos harmônicos com dois cliques, os alvos possuem melhor qualidade quando ancorados em candles climáticos, seja de ignição ou exaustão ou em pivôs de alto volume.
Funciona com qualquer ativo (volume real e volume tick), em qualquer tempo gráfico, ações, indicies, futuros, forex, criptomoedas, commodities, energia, mineiro e qualquer outro. As projeções devem respeitar os princípios de confluência e simetria, portanto não devem ser utilizados unicamente como critério de decisão, seu
RaptorT: Cumulative Volume and Cumulative Volume Delta (Buying Selling Pressure) Introduction RaptorT CV & CVD (CVD is also known as Buying/selling Pressure or Book Pressure) offers two basic and meaningful indicators for trading having volumes as main index and weigh of the market interest. It gives good insights in combination with VWAP line and its four upper and lower standard deviations, developing PVP (Peak Volume Price, the equivalent of the POC for the old Market Profile), Volume Profi
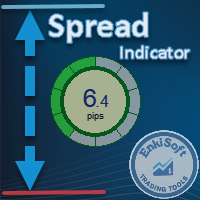
Custom Spread Indicator *Please write a review, thanks!
Also MT4 version is available
Spread Indicator show the current spread in pips with color codes. Handle 3 levels, Low, Medium, High. You can set levels and colors for each level (eg. Low: Green, Medium: Orange, High: Red), and can choose display position on the chart.
There is two spread calculation mode: -> Server spread value -> Ask - Bid value
Can set opacity, for better customization. When spread jump bigger, then display do not
FREE
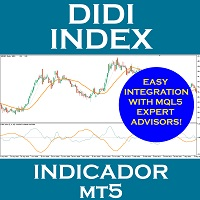
The Didi Index is an indicator that helps in the identification of the so called “Didi Needles” (Agulhada do Didi), a method created by the experienced Brazilian trader Odir Aguiar (Didi).
DIDI NEEDLES EXPLAINED
The concept of the needles is simple: 3 moving averages are added to the chart (by default 3, 8 and 20 periods, simple mode), and whenever all 3 averages pass simultaneously inside the real body of a candle, the needling occurs. It was named after the movement of passing a thread throu
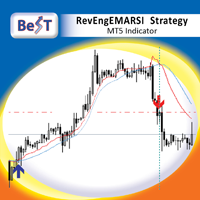
BeST_RevEngEMARSI Strategy is an MT5 Indicator that is based on the indicator RevEngEMARSI by Giorgos Siligardos that was presented in his article " Reverse Engineering RSI (II) " ( TASC_Aug 2003 ) as a new variation of his inverse-RSI indicator and which transforms the Exponential moving average of RSI into a curve in the price graph, simplifying the price projection method and improving its visual representation. BeST_RevEngEMARSI Strategy while implementing the crossings with its Moving Aver
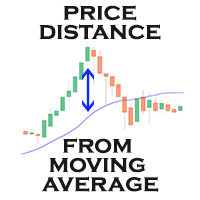
Moving Average Distance Indicator
The “Moving Average Distance Indicator” calculates the difference between the instrument's price and the moving average of your choice, showing this difference in percentage values or in price. In other words, it indicates how far the price is from the moving average.
What is it for?
The great advantage of this indicator is the ease to compare movement expansions that occurred in the past, at different price levels, as the indicator works in a levelled wa
Time your Entry and Exits with Average True Range (ATR) Trailing Stops ATR Trailing Stops are primarily used to protect capital and lock in profits on individual trades but they can also be used, in conjunction with a trend filter, to signal entries. The indicator will help make your calculation of stop loss easier as it will be visually aiding you in choosing where to put your stoploss level on the chart by calculating the current value of ATR indicator. For those who are unfamiliar with ATR, i
FREE
With the SR Dashboard, you get a powerful tool to control some of the most important information in trading. Assemble a setup according to your strategy and get informed as soon as this setup is valid. Assign scores to defined conditions and let the Dashboard find them. Choose from Trend, Average Daily Range, RSI, Moving Averages, Pivot (Daily, Weekly, Monthly), Highs and Lows, Candlestick Patterns. What can you do with this tool? Use the dashboard as a powerful tool for your discretionary trad
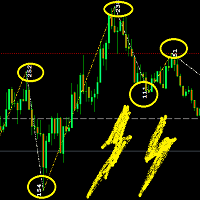
This Indicator adding power to traditional zigzag indicator. With High-Low numbers in vision it will be easier to estimate change of trend by knowing the depth of each wave. Information including points, pips, percentage%, and #bars can be displayed based on configuration. All information is real-time update. This indicator is especially useful in sideway market to buy low sell high.
We would like to introduce you to our newly developed ZScore Dashboard Indicator for the Metatrader 5 platform. It automatically calculates and updates the ZScore values of Price (Z) and Tick Volume (ZV) as it changes in the particular timeframe chart to which the indicator is applied to. The Dashboard contains 4 columns per each average. Each average has the following columns: ZScore of Price (Z), 3 period SMA of ZScore of Price (ZMA), ZScore of Tick Volume (ZV) and a 3 period SMA of ZScore of
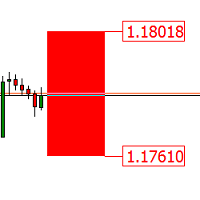
StopLevel 仪表控制 STOPLEVEL 水平。当液位发生变化时,它会发出警报信号。 STOPLEVEL - 设置止损订单的当前收盘价的最小抵消点数,或允许的最小止损/止盈点数。 STOPLEVEL 的零值意味着没有限制止损/止盈的最小距离,或者交易服务器使用外部机制进行动态水平控制,无法传输到终端。在第二种情况下,STOPLEVEL 实际上是“浮动的”。 指标设置: color_ - 级别的区域颜色 draw_bars - 用于显示级别区域的条数 width_price - 价格标签的厚度 仪表控制 STOPLEVEL 水平。当液位发生变化时,它会发出警报信号。 STOPLEVEL - 设置止损订单的当前收盘价的最小抵消点数,或允许的最小止损/止盈点数。 STOPLEVEL 的零值意味着没有限制止损/止盈的最小距离,或者交易服务器使用外部机制进行动态水平控制,无法传输到终端。在第二种情况下,STOPLEVEL 实际上是“浮动的”。 指标设置: color_ - 级别的区域颜色 draw_bars - 用于显示级别区域的条数 width_price - 价格标签的厚度
FREE
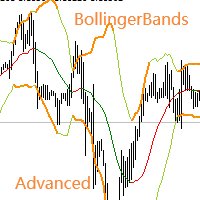
交易实用必备工具指标 波浪自动计算指标,通道趋势交易 完美的趋势-波浪自动计算通道计算 , MT4版本 完美的趋势-波浪自动计算通道计算 , MT5版本 本地跟单复制交易 Easy And Fast Copy , MT4版本 Easy And Fast Copy , MT5版本 本地跟单复制交易 模拟试用 Easy And Fast Copy , MT4 模拟账号运行 Easy And Fast Copy , MT5 模拟账号运行 高级布林带: 1.布林中轨会随着方向变色 " 2.布林外轨扩张和收缩都会在外轨进行变色标识" 3.布林中轨计算方式可以选择任意均线,例如EMA" 4.同样可以选择任意价格应用模式进行计算" 强烈推荐趋势指标 , 波浪的标准自动计算 和 波浪的标准自动计算MT5版本 "合作QQ:556024" "合作wechat:556024" "合作email:556024@qq.com"
布林线(Bollinger Band) 是根据统计学中的标准差原理设计出来的一种非常实用的技术指标。它由 三条 轨道线组成,其中上下两条线分别可以看成是
FREE
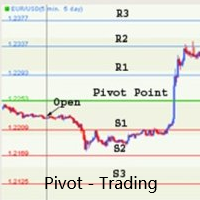
支点交易 : 1.pp 支点 2. r1 r2 r3 , s1 s2 s3 交易实用必备工具指标 波浪自动计算指标,通道趋势交易 完美的趋势-波浪自动计算通道计算 , MT4版本 完美的趋势-波浪自动计算通道计算 , MT5版本 本地跟单复制交易 Easy And Fast Copy , MT4版本 Easy And Fast Copy , MT5版本 本地跟单复制交易 模拟试用 Easy And Fast Copy , MT4 模拟账号运行 Easy And Fast Copy , MT5 模拟账号运行 合作QQ:556024" 合作wechat:556024" 合作email:556024@qq.com" 专业EA指标定制编写.
支点( pivot points) 作为一种交易策略已经很长时间了,最初是场内交易员使用这种方法。使用这种方法通过几个简单的计算就可以了解市场在一天中的去向。 支点法中的支点是一天中市场方向的转向点,通过简单地计算前日的高点、低点和收盘价,可以得到一系列点位。这些点位可能形成关键的支撑和阻力线。支点位,支撑和阻力位被统称为支点水位。 你所看到的市场每天
FREE
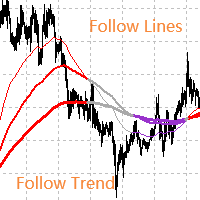
指标适用于趋势跟随者! 三条均线构建的交易系统.顺势交易,让利润奔跑 . 交易实用必备工具指标 波浪自动计算指标,通道趋势交易 完美的趋势-波浪自动计算通道计算 , MT4版本 完美的趋势-波浪自动计算通道计算 , MT5版本 本地跟单复制交易 Easy And Fast Copy , MT4版本 Easy And Fast Copy , MT5版本 本地跟单复制交易 模拟试用 Easy And Fast Copy , MT4 模拟账号运行 Easy And Fast Copy , MT5 模拟账号运行 强烈推荐趋势指标, 波浪的标准自动计算 和 波浪的标准自动计算MT5版本
合作QQ:556024" 合作wechat:556024" 合作email:556024@qq.com" 专业EA指标定制编写. 首先,我们要明白,所有的移动均线都是滞后指标,它们只能事后告诉你市场已经转向,即使它们提供了有价值的信息并且帮助你建立了头寸,不能协助在利润最大化方面发挥太多作用,所以要配合均线价值回归区域使用,价格可以根据重要支撑线的指示,不是滞后的,当市场从目前的隧道出发跟随趋势交易不断
FREE
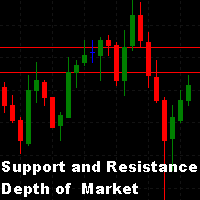
We often look for support and resistance points on the chart. One of the techniques that can be used is through the quantity of lots offered in the order book. This indicator searches for the largest lots in the order book and draws them on the graph in the form of lines, thereby obtaining where is the greatest concentration of lots offered on the centralized stock market at that time, thus configuring possible support and resistance lines.
- The number of lines to draw can be defined by the u
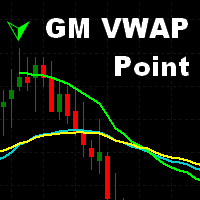
VWAP is an intraday calculation used primarily by algorithms and institutional traders to assess where a stock is trading in relation to its weighted average volume for the day. Day traders also use VWAP to assess market direction and filter out trading signals. This indicator is used to analyze and calculate the Vwap from a certain point on the graph, which is widely used to analyze the beginning of a movement of the price relationship with the volume.
- Multi Vwaps on the same chart, placed
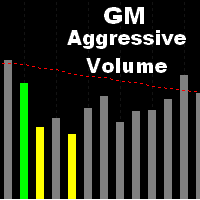
Volume is a resource used by analysts of various methodologies, precisely because it shows the confirmation of movements and the market's progress. It is an indicator that analyzes the financial quantity that was traded during a certain period.
This indicator analyzes the amount of volume for each candle, when there is an excessive increase in this, it differs from the others by a colored bar.
In addition to informing in the form of colored bars, this indicator allows you to emit an audible w
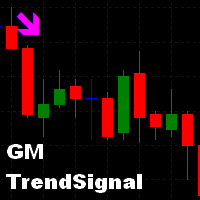
We often need to know the sudden change in trend that happens on the graph and this can be confirmed through indicators.
This indicator shows the moments of trend reversal and how in which trend the price is shifting.
Custom background, no need to configure the colors in the chart, just drag the indicator!
Indication with arrows.
- Blue arrow: Upward trend.
- Pink Arrow: Downward Trend.
NOTE: Free indicator, support may take a while to respond.
FREE
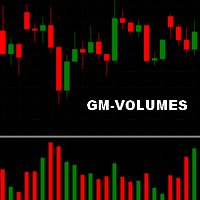
A simple volume indicator according to the color of the candle!
- Custom background!
- Supports Volume by Ticks or Real Volume.
The original Metatrader Volume indicator does not show the colors of the bar according to the color of the Candle, it only changes color when the volume of a candle is greater than the previous one, this sometimes creates confusion for beginners and does not know the real reason for the color change.
Free indicator, support may take a while to respond!
FREE

The Inno Trend indicator tracks the market trend with reasonable reliability, ignoring sharp market fluctuations and noise around the average price. The Inno Trend indicator simplifies the decision-making process by recognizing reversals using a built-in algorithm, and then confirming signals at support / resistance levels, implements a kind of technical analysis based on the idea that the market is cyclical in nature. It can be used both for pipsing on small periods and for long-term trading.
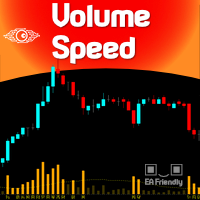
For those traders who really care about Volume as an important vector information on Price Action, here is an exclusive idea & creation from Minions Labs: Volume Speed . The Volume Speed indicator shows you visually how much time (in seconds, minutes, hours, you choose) the Volume took to reach the Average Volume of the past bars. This way you can have the exact idea of "what is happening right now with the Volume of the current bar..." and take action accordingly with your strategy, having even
Секвента Демарка (Sequential) - индикатор, демонстрирующий развитие тренда, его структуру. Довольно точно отображает начальную и конечную точки, важные точки перелома. Срабатывает по открытию свечи, поэтому перерисовок не будет никогда.
Здесь нет сложных формул, только статистика, отсчёт свечей, выбранных по определённым критериям. При этом индикатор может давать очень точные сигналы для входа, особенно при поддержке какого-нибудь индикатора уровней, например, этого . Алгоритм нахождения сигнала

Join Deriv link on profile>>>
GET THIS FULL COPY AND GET ANOTHER FREE INDICATOR ONE OF THE BEST AND USEFULL INDICATORS IN THE WORLD ..This is the one of the best usefull indicators which has chosen to be used by top traders in the world.
AUTOMATIC SUPPORT AND RESISTANCE This way of trading is also called Supply and demand, On this way of trading you can see auto colours appear where the market changes direction buying or selling Direction.
ALL KIND OF PAIRS METALS AND INDICIES ARE INCLUDED A
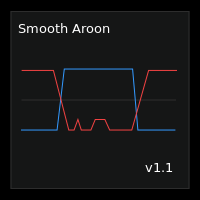
Smooth Aroon is a version of the Aroon Up and Down with smoothing and filtering.
Features :
Smoothing : You have smoothing from 0 to 99 . To smooth a signal, find the maximum value of the points in question then set the smoothing level above the maximum value. For example : If you want to smooth all signals below 30, then you should set the smoothing level above 30 This also smooths all signals above 70, since the Aroon Up and Down Oscillates between 0 and 100. Filtering : If you only w

This plots Fibonacci deviation levels above and below a moving average of the price. The expert advisor and this indicator were created in order to: Identify ideal and repeatable trade entries with high level of certainty Create a day trading strategy which doesn’t require a hard SL and TP Use alternate risk management mechanism instead Visualize and auto manage trades based on S/R

本指标是实践实战交易完善的波浪自动分析的指标 ! 案例...
注: 波浪分级用西方叫法不习惯,因受到缠论(缠中说禅)命名方式习惯的影响,我是将基础波浪命名为 笔 ,将二级波段命名为 段 ,同时具有趋势方向的段命名为 主趋段 (以后笔记中都是这种命名方式,先告知大家),但是算法上和缠论关系不大切勿混淆.反映的是本人分析盘面总结的 千变万化纷繁复杂的运行规律 .
对波段进行了标准化定义,不再是不同人不同的浪 , 对人为干扰的画法进行了排除,在严格分析进场起到了关键的作用 .
使用这个指标,等于将交易界面提升美感,抛弃最原始的K线交易带你进入新的交易层次.如果不是为了交易,在宣传上也将使客户观感提升层次. 指标内容: 1. 基础波浪 (笔) : 首先我们找出了价格波动过程中的基础波动拐点,当然他的有序性低,为下一步的计算提供基础. 2. 二级波段( 段 ) :在基础波浪的基础上,通过算法分析得到层级更明显的二级波段,二级波段为波浪提供了分析基础 3. 波浪( 浪 ): 有着更清晰的趋势,更清晰直观的方向.分析一个波浪是否延续,需要看二级波段的形态,分析二级的构成
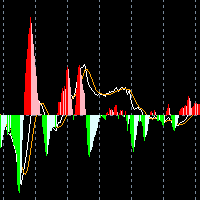
交易实用必备工具指标 波浪自动计算指标,通道趋势交易 完美的趋势-波浪自动计算通道计算 , MT4版本 完美的趋势-波浪自动计算通道计算 , MT5版本 本地跟单复制交易 Easy And Fast Copy , MT4版本 Easy And Fast Copy , MT5版本 本地跟单复制交易 模拟试用 Easy And Fast Copy , MT4 模拟账号运行 Easy And Fast Copy , MT5 模拟账号运行 MACD称为异同移动平均线,是从双指数移动平均线发展而来的 ,由快的指数移动平均线(EMA12)减去慢的指数移动平均线(EMA26)得到快线DIF,再用2×(快线DIF-DIF的9日加权移动均线DEA)得到MACD柱。MACD的意义和双移动平均线基本相同,即由快、慢均线的离散、聚合表征当前的多空状态和股价可能的发展变化趋势,但阅读起来更方便。MACD的变化代表着市场趋势的变化,不同K线级别的MACD代表当前级别周期中的 买卖趋势。
1.本指标增加MACD的双线显示, 2.并且对能量柱进行4色不同的渐变! 强烈推荐趋势指标, 波浪的标准自动计算 和
FREE
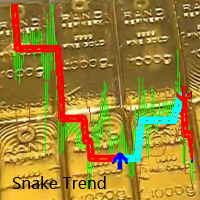
指标内容 : 1.基准价,参考基准价. 价格短期来说是不断无序波动的,短期的命运会显得不可捉摸 2.参考趋势方向 建议 : 弱化K线的短期波动,做中长期的趋势.
"Grow together!" "合作QQ:556024" "合作wechat:556024" "合作email:556024@qq.com"
"趋势正在形成或者消亡,而跟随舞动的大蛇盘旋而动,一起前进,永不放弃 "清晰可见的多空判断,去跟随它!" "扭曲的大蛇是通往趋势的阶梯,一步一个脚印,登高,速降!" "我们和趋势是好朋友,和震荡也是最佳伙伴!" "共同成长!"
注:为中国小伙伴优化的一键改变图表颜色正反功能,可以方便的适应国内行情红色为涨的普遍认知......

FIRST 10 COPIES AT 30 USD, NEXT PRICE WOULD BE 65 USD
HAWA MOMENTUM & TREND PRO (MT5) Advanced trading indicator with proper pre-defined entry and exit levels with almost 80% win rate. Its smart and advanced algorithm detects trend and trend strength using momentum for maximum profits and send signals after filtering out market noise. SETTINGS: Please make sure all inputs are NOT "false" in indicator properties otherwise it will not display identified trades. Directory Location: Download fil

This indicator is created by using an exclusive algorithm to indicate you Buy or Sell in an accurate way all the possibles reversals within a normalized trending bands. The main goal for this algorithm is to achieve fast profitable movements and aggressive retracement. Thanks to the normalized bands, using the noises of the market. We have added the "Golden Trade", we define it as the perfect order: For those orders that had the perfect entry price. They were always in profit, or the final pr
Time to Trade Trading timing indicator is based on market volatility through 2 ATR indicators to determine the timing of a transaction. The indicator determines the times when the market has strong volatility in trend. When histogram is greater than 0 (blue) is a strong market, when histogram is less than 0 (yellow) is a weak market. Should only trade within histograms greater than 0. Based on the histogram chart, the first histogram value is greater than 0 and the second histogram appears, this
FREE
This Currency Meter Calculates Strength Using a currency basket of 28 pairs? This Currency Meter uses a basket of 28 currency pair to define strength. This is very important because it gives an wholesome view of the strength of a currency by considering its reaction to all major currencies paired with it.
This Currency Meter is Multi-timeframe!!! Majority of the currency strength indicators around the market today only has a single time frame view. Even with the so called multi-timeframe versio

This is the MT5 version. Get Dual Onset MT4 here
It is an algorithm to detect trend changes early. You should try multiple values for the Multiplier parameter (1 <value <10 recommended). At first glance you can see effective entries. This is, in fact, one of the rows that Geleg Faktor initially had. But it was removed because it was no longer needed. The other rows were sufficient for G.Faktor's effectiveness, but I still wanted to share this one.
Always test before using it on your live ac
FREE

This is MT5 version Get Tunnel Warrens MT4 here
Here are several indicators that work together. It basically works with moving averages and various levels of ATR creating a dynamic channel through which the price is drained. As I always recommend, you should try it before using it in live so that you understand how it works. The market entry signal is similar to other MA indicators, but with this one you also have a graphical analysis of the moment when the trend is found and dynamic levels to
FREE

This is the MT5 version. Get Q-Math MT4 here
Check it out and if you like it just enjoy it. Try various values to find the setting that best suits your trading. Upward signal if the indicator is colored lawn green and bearish signal if the indicator is gray. You can use the line itself to trailing stop when you open orders. This is just a tool. A complement. It is not a strategy. Combine it with your own analysis Just download it and try it, it's free.
FREE

Данный индикатор предназначен для мониторинга торговой активности вашего счета. Особенно полезен будет тем, кто торгует сразу на нескольких инструментах. В одном окне индикатора собрана наиболее важная информация о счете с детализацией по инструментам и мониторингом заработка. Описание настроек: Start from date history - с какой даты индикатор будет обрабатывать торговую историю Max symbol on screen - индикатор берет данные по символам из обзора рынка. В данной настройке вы можете ограничить

Индикатор Analytic Trade - это полноценная торговая система. Он состоит из 4 частей: Первая - это стрелочки, показывающие наиболее оптимальные точки открытия и закрытия ордеров. Стрелка вверх - сигнал на покупку, вниз - на продажу. Вторая - это информационная панель в правом верхнем углу. Крупным шрифтом обозначена текущая цена, над ней показаны: максимум дня, расстояние от текущей цены до него и разность максимума и минимума (в пунктах). Под ней расположены: минимум дня, расстояние до минимума,

Description
Range Detector is an indicator that identifies impulses in the market and displays their slope angles on the chart.
Recommendations
You can use this indicator to determine a trend and, accordingly, to determine the direction of opening a position or closing an opposite position.
Parameters
===== _INDICATOR_SETTINGS_ ===== - indicator settings
Maximum History Bars - maximum number of history bars for calculating the indicator. Average True Range Period - ATR indicator period (us
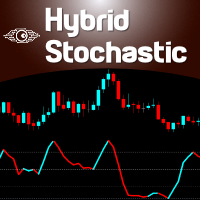
The Hybrid Stochastic indicator is a Stochastic RSI described by the famous Tushar Chande and Stanley Kroll in their book called " The New Technical Trader" . The main goal of this indicator is to generate more Overbought and Oversold signals than the traditional Relative Strength indicator (RSI). Combining these 2 indicators expands the range of the overbought and oversold territory. The idea behind it is to use the Stochastic formula over RSI values. If you want to know more about its internal
FREE

The Premier League indicator links the price in a cyclical-wave relationship. Crossing points can be used as potential market reversal points. Thus, all crossing points will be optimal points at which the movement changes taking into account the indicator period. But do not forget that the approach must be complex, the indicator signals require additional information to enter the market.
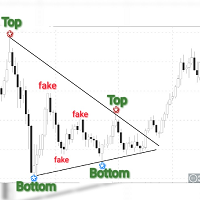
Obaforex Tops & Bottoms is a trading tool born out of a personal need to accurately filter tops and Bottoms and ensure consistency in the way tops and bottoms are picked for technical analysis. Mt4 version https://www.mql5.com/en/market/product/53637
It does not repaint (once top or bottom is printed, it don't disappear) It only prints tops and bottoms after a specified No of bars or candles to the right
This tool is expected to significantly improve the decision making of almost any form of

Based on two MA line indicators.
Looking at the histogram, if the value is greater than 0, the uptrend will increase, the bigger the value, the stronger the uptrend will be and vice versa, if the value is less than 0, the downtrend will decrease, the smaller the value, the stronger the downtrend . The necessary condition when entering a buy order is that the first histogram is greater than 0 and the current candle is closed, and enter the order when the second histogram appears. The necessary
FREE
GG Signal Scanner ATR base on ATR, MA and RSI indicators to determine trade times and entry points. The indicator scans all currency pairs in Market Watch or according to the list of currency pairs. The entry points will be listed of alerts and sent to the phone or email. Indicators are for use on one chart only and should not be used in conjunction with other indicators. Indicator should be used for M15 - H1 - H4 timeframe. In the strategy tester, the indicator only checks for 1 currency pair
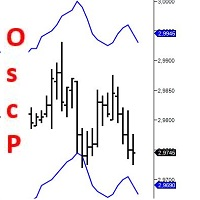
Very special indicator of Joe Dinapoli which is a derivative of a Detrended Oscillator. Through a set of parametric equations, a predicting oscillator is created that forecasts, one period ahead of time, overbought and oversold conditions. The resulting predictor values are expressed as bands on the bar chart, both above and below the market. It may be mistaken as a Bollinger Band but has no resemblance to it whatsoever. The Predictor bands may be used in a variety of ways to aid in entering an

The indicator is the advanced form of the MetaTrader 4 standard Fibonacci tool. It is unique and very reasonable for serious Fibonacci traders. Key Features Drawing of Fibonacci retracement and expansion levels in a few seconds by using hotkeys. Auto adjusting of retracement levels once the market makes new highs/lows. Ability to edit/remove any retracement & expansion levels on chart. Auto snap to exact high and low of bars while plotting on chart. Getting very clear charts even though many ret
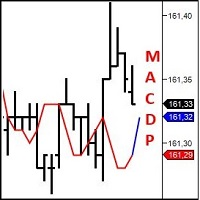
Very special indicator of Joe Dinapoli which is a derivative from traditional MACD indicator. It shows the precise price, at which MACD will show line crossing and trend shifting. Also, this level is known one period ahead of time.You can constantly reassess your current position by looking at this studying a variety of timeframes. When you are in a trade, you have a feel for how much time you have for the trade to go your way by looking at the distance between the MACD Predictor line and the l

What you can do with CandleStick CandleStick is a useful indicator for doing MTF analysis. This indicator displays the CandleStick of another time frame on the chart . By understanding the information in multiple time charts at the same time, it is easier to understand the overall market view. It is also a useful tool for validating and studying past quotes and trades. There are similar products made by others, but I designed and developed it so that it is easy for me to use.
Features of Candle

The White's Candle Color indicator (by volume) will color the candles based on the current candle's volume compared to the moving average of the volume. This will allow you to see clearly if the volume (real or tick) is within the normal range, whether it is high or low and bring very important information about the market. I hope that this indicator can help in your operational. Success and good trades!

All in One package includes the Oscillator Predictor , MACD Predictor , Thrust Scanner and Advanced Fibonacci indicators which are mandatory for applying Dinapoli trade plans.
Please visit below links for detailed explanations of indicators. Advanced Fibonacci Indicator => https://www.mql5.com/en/market/product/107933 Thrust Scanner Indicator => https://www.mql5.com/en/market/product/52829 Overbought /Oversold Predictor indicator => https://www.mql5.com/en/market/product/52628 Macd

The indicator determines a special pattern of Joe Dinapoli. It gives very high probability buy and sell signals. Indicator does not repaint. Indicator Usage Buy Signal ''B'' Entry : Market buy order at signal bar close Stop : Low of signal bar Take Profit : First swing high Sell Signal ''S'' Entry : Market sell order at signal bar close Stop : High of signal bar Take Profit : First swing low Indicator Parameters Fast EMA : External Parameter (should be kept as default) Slow EMA: External Param
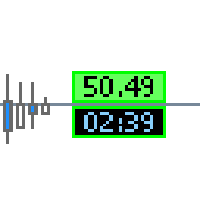
This tool gives you several informations about your broker and the current market events.
The top Infolabel shows the current spread price .
You can set whether the label should be displayed or hidden.
You can adjust price levels for automaticly change of background color.
The lower Infolabel shows the candle timer of the current time frame.
You can set whether the label should be displayed or hidden.
The bordercolor change to red if:
1. you have no connection to the tradeserver
2. you receive

The indicator scans for Dinapoli thrust pattern in multiple timeframes for a specific market. Key Features Indicator can be used for all markets It can scan for thrust pattern on W1, D1, H4, H1, M30, M15 and M5 timeframes Ability to choose number of bars required above/below displaced moving average to define thrust Able to move display label on chart by single click Parameters Minimum Bars: Least amount of bars to account for Thrust DMA Period: Moving average period DMA Shift: Number or bars re

Non-proprietary study of Joe Dinapoli used for trend analysis. The indicator gives trend signals when the fast line penetrates the slow line. These signals remain intact until another penetration occurs. The signal is confirmed at the close of the period. It is applicable for all timeframes. Inputs lnpPeriod: Period of moving average. lnpSmoothK: %K period. lnpSmoothD: %D period. ********************************************************************************
FREE

Non-proprietary study of Joe Dinapoli used for trend analysis. The indicator gives trend signals when the fast line penetrates the slow line. These signals remain intact until another penetration occurs. The signal is confirmed at the close of the period. It is applicable for all timeframes. Parameters Fast EMA: period of the fast moving average. Slow EMA: period of the slow moving average. Signal EMA: period of the signal line. ************************************
FREE

Non-proprietary study of Joe Dinapoli used for overbought/oversold evaluation. Uses of Detrended Oscillator indicator Profit taking. Filter for market entry technics. Stop placement. Part of volatility breakout pattern. Determining major trend changes. Part of Dinapoli Stretch pattern. Inputs lnpPeriod: Perid of moving average Method: Calculation method ********************************************************************************* If you want to know market Overb
FREE

The Squat is a function of the range of a given price bar and the volume, or TIC volume, that occurs while that range is being created. The basic idea is that high volume and little price movement indicate substantial support or resistance. The idea behind the approach to this indicator is to first look for likely Fibonacci support and resistance and then see if Squat manifests when that point is reached. The indicator determines one of the high probability patterns of DiNapoli. It does not re

The indicator monitors the Dinapoli MACD trend in multiple timeframes for the all markets filtered and shows the results on Dashboard.
Key Features Indicator can be used for all markets Monitors every timeframe, from 1 Min to Monthly
Parameters
UseMarketWatch: Set true to copy all symbols available in market watch MarketWatchCount : Set the number of symbols that you want to copy from the market watch list. CustomSymbols: Enter the custom symbols that you want to be available in dashboard. Ti

The indicator scans for Dinapoli thrust pattern in multiple timeframes for the all markets filtered and shows the results on Dashboard. Key Features Dashboard can be used for all markets It can scan for thrust pattern on MN1, W1, D1, H4, H1, M30, M15 ,M5, M1 timeframes Ability to choose number of bars required above/below displaced moving average to define thrust Parameters
UseMarketWatch: Set true to copy all symbols available in market watch MarketWatchCount : Set the number of symbols that
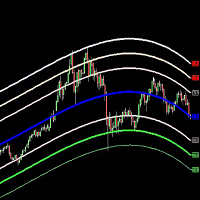
Belkhayate Gravity Center MT5 Custom
The Belkhayate center of gravity indicator is best used to confirm major turning points, and distinguish price extremes. Generally if price reaches the upper or lower levels one should expect a turn around coming soon, or at least a pull back towards the centre line if there is a strong trend. The upper and lower levels are red and green lines.
Our indicator use the same parameters as the well known trader M.Mostafa Belkhayate the inventor of the indicator
MetaTrader市场是独有的自动交易和技术指标商店。
阅读MQL5.community用户备忘更多地了解我们提供给交易者的独特的服务:复制交易信号,自由职业者开发的自定义应用程序,通过支付系统完成的自动付款和MQL5云网络。
