 MetaTrader 5
 专家
专家 指标
指标 程序库
程序库 实用工具
实用工具 窗口小部件
窗口小部件 规则
规则适用于MetaTrader 5的新技术指标 - 189
 技术指标的信号外汇和股票市场的开仓交易和平仓交易起着至关重要的作用。指标的本质就是一种交易品种的数学转换,旨在预测未来的价格变化。
测试技术指标可以更有利于预测市场行为并从中获利。
技术指标的信号外汇和股票市场的开仓交易和平仓交易起着至关重要的作用。指标的本质就是一种交易品种的数学转换,旨在预测未来的价格变化。
测试技术指标可以更有利于预测市场行为并从中获利。 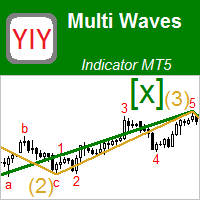
This indicator displays the wave structure of the market in the form several wave levels nested in each other. For each of these levels an automatic preliminary (draft) marking of waves in Elliott's style (123..., ABC... etc.) is created. This markup is completely automatic and absolutely univocal. The indicator is especially useful for beginner wave analysts, because among all the possible versions for wave marking, it allows you to immediately take the most adequate version as a ba

The advantage of the Price Surfing indicator is the search algorithm for the extremes of the price of the instrument. Most indicator signals are located at local maximums and minimums of the price . For the convenience of the trader, the potential profit of each signal is displayed on the chart. The indicator does not repainting, the signal appears after the bar is closed. MT4 version https://www.mql5.com/en/market/product/46054 Parameters SendAlert - enable alert of a new signal SendEMail
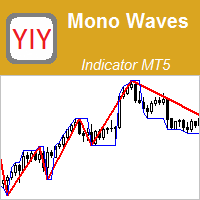
The Mono Waves indicator is designed to display the wave behavior of the market on a chart. Its appearance is presented on slide 1. This indicator uses the PPPC (Point-Percent Price Channel) indicator, which can be downloaded for free from the Market . When the market moves up, the upper border of the price channel is built on High candlestick prices (for more details, see the description of the PPPC indicator at the link given above). The higher the High prices rise
FREE
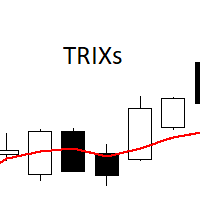
The TRIXs Indicator is the combination of the TRIX (Triple Exponential Moving Average) indicator with the addition of a SMA (Simple Moving Average) signal. It provides signs of trend continuity and the start of a new trend.
The entry and exit points of operations occur when the indicator curves cross.
It performs better when combined with other indicators.
FREE
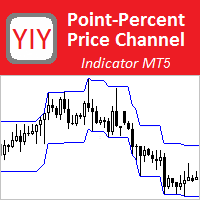
The Point-Percent Price Channel (PPPC or PP Price Channel) indicator is designed to display on the chart a channel whose width is specified both as a percentage of the current price and in points. Its appearance is presented on slide 1. When the market moves up, the upper border of the channel is built at the price of High candles. In this case, the lower boundary follows the upper one at a strictly specified distance. When the price touches the lower border of the channe
FREE
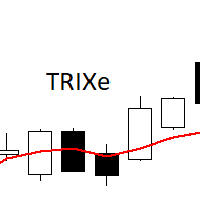
The TRIXe Indicator is the combination of the TRIX indicator (Triple Exponential Moving Average) with the addition of an EMA (Exponential Moving Average) signal. It provides signs of trend continuity and the start of a new trend.
The entry and exit points of operations occur when the indicator curves cross.
It performs better when combined with other indicators.
FREE

Squat bar.
One of the signals of the "Trade Chaos" system of Bill Williams.
It is calculated based on the difference in price changes and tick volume.
Strengthens the signal of the "Bearish/Bullish Divergent Bar (First Wiseman)" if it coincides with it or is nearby.
Tested in comparison with the original program "Investor's Dream".
For more effective development of the system, read and see the materials of Bill Williams.
In the settings you can choose the color of bar.
Learning to trade on indicators can be a tricky process. Volatility Index indicator makes it easy by reducing visible indicators and providing signal alerts Entry and Exiting the market made possible through signal change Works well with high time frame to reduce market noise simplicity in trading guarantees success and minimal losses Our system creates confidence in trading in case of any difficulties or questions please send message

FX Volume:从经纪商视角洞察真实市场情绪 简要概述
想要提升您的交易策略? FX Volume 可提供零售交易者和经纪商的持仓实时数据——远早于诸如 COT 之类的延迟报告。不论您希望获得持续稳定的收益,还是想在市场中多一分制胜的砝码, FX Volume 都能帮您识别重大失衡、确认突破以及完善风险管理。立即开启体验,让真实的成交量数据为您的交易决策带来革新!
1. 为什么 FX Volume 对交易者格外有用 极具准确度的早期预警
• 快速捕捉有多少交易者正在买入或卖出某个货币对——比大多数人提前一步。
• FX Volume 是 唯一 能够整合多家零售经纪商真实成交量数据并以简洁方式呈现的工具。 强力风险管理
• 及时识别多头或空头仓位的巨大不平衡,这往往预示着潜在的趋势反转,帮助您更自信地设置止损和目标位。
• 独家而真实的数据让每一次交易决策更具可靠性。 优化进场与出场点
• 发现“过度集中”的交易(大多数交易者都在同一方向),并通过真实成交量来确认突破。
• 避免依赖常见指标可能带来的误导信号,而是利用真实的实时成交量。 适配各种交易策略
• 将 FX
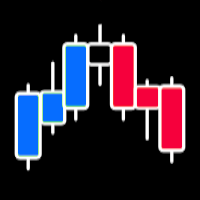
Tabajara Rules for MT5 , based on Professor André Machado’s Tabajara Setup, indicates the market direction using moving averages when there are candles aligned with the direction of the moving average.
The indicator contains the color rule applied to the candles and the moving average.
It allows changing the parameters: period and smoothing method of the moving average.
It also allows changing the colors of the candles (borders and filling) and of the moving average.
Professor André Machado’s
FREE
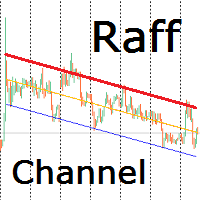
Индикатор строит канал Раффа на основе линейной регрессии. Красная линия тренда может использоваться для принятия решения о покупке или продаже внутрь канала при подходе цены к ней. Настройками можно задать ширину канала по коэффициенту отклонения от базовой линии или по максимальному и минимальному экстремуму. Так же можно включить продолжение канала вправо от текущих цен. Индикатор канала регрессии Раффа – удобный инструмент, значительно облегчающий работу современного трейдера. Он может быть

The Complete Solution for Volume Analysis in the WIN Market The #C3 - [volume] indicator was developed specifically for traders operating in the Brazilian Stock Market . If you are a trader seeking precise and effective strategies for the WIN asset, this indicator becomes an essential tool in your arsenal. By leveraging in-depth volume flow analysis , it allows you to identify reversal points or trend continuations based on significant volumes. Analyzing volume is one of the most powerful
*Non-Repainting Indicator Bruce Webb Explains How To Use Bruce's Price Predictor In Detail And Free Forex Strategy https://youtu.be/hfoB1tZZpTo Bruce's Price Predictor is an indicator that shows precise price reversals. A great arsenal to add to any chart. Bruce's Price Predictor points price reversals with high degree of accuracy and it is great for scalping on the 1min time frame, Or swing trading on the 1hr time frame. Buy and sell arrows are shown on the chart as for entry signals. They do

Bearish/Bullish divergent bar . One of the signals of the "Trade Chaos" system of Bill Williams. (First wiseman)
When bar moving away from the "Alligator" indicator and there is divergence on the Awesome Oscillator indicator, it shows a potential point of movement change.
It is based on the opening/closing of the bar, the position relative to the previous ones, the Alligator and AO.
When trading, the entrance is at the breakthrough of the bar(short trade - low of bar, long trade high of bar), a
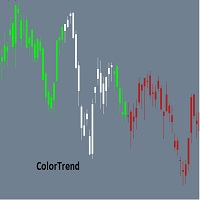
Combining the best of Price Action , Directional Movement , and Divergence / Convergence analysis, the Candle Color Trend is the easy and reliable way to identify the direction of the trend. The indicator automatically paints the candles according to the premise that the upward trend is defined by prices that form a series of ascending tops and bottoms. On the other hand, the downward trend is defined by prices that form a series of descending tops and bottoms.
Color Trend is certainly one of
FREE
Trend Reversal Indicator This indicator works effectively in the early stages of a trend, helping to identify trend reversals. Trading Recommendations: The signal is generated on the current candle. It is recommended to enter the trade on the next candle. The target profit is 20-30 pips. There are three stop-loss options: Exit the trade upon receiving an opposite signal. Place the stop-loss directly behind the signal. Set the stop-loss at the nearest high or low. It is advisable to avoid tradin
Forex Driver is a great tool for detecting peaks and valleys on a chart. This indicator uses a modified peak and trough detection algorithm. This algorithm includes the Fractals indicator and the ZigZag indicator.
This tool should be used to analyze peaks and valleys, as well as to detect patterns, or for other purposes. You can use this powerful tool for your own purposes at your own risk.
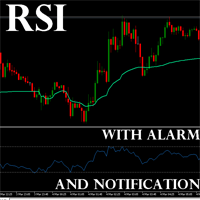
This is RSI with alarm and push notification -is a indicator based on the popular Relative Strength Index (RSI) indicator with Moving Average and you can use it in Forex, Crypto, Traditional, Indices, Commodities. You can change colors to see how it fits you. Back test it, and find what works best for you. This product is an oscillator with dynamic overbought and oversold levels, while in the standard RSI, these levels are static and do not change.
This allows RSI with alarm and push notifica
FREE
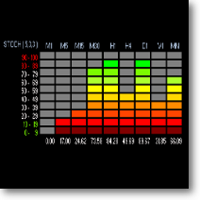
Benefits: A new and innovative way of looking across multiple timeframes and multiple indicators on any chart. Provides instant multi-timeframe analysis of any market. i.e. forex currency pairs, cryptocurrency pairs, commodities, etc. It offers precise indications across multiple timeframes of volatility as measured by RSI, ADX and STOCH within one chart. Helps you determine high probability trading setups. See example strategy in comments. Can see bullish/bearish volatility building across mult

reference:
"High Frequency Trading, A Pratical Guide to Algorithmic Strategies and Trading Systems (Aldridge, Irene)"
Characteristics The calculation of VWAP is in accordance with the literature. 4 types of VWAPs, daily, monthly, yearly, moving. Note: Daily is the most popular form, the calculation is performed from the beginning to the end of each trading session (Market benchmark). In the moving, the calculation is carried out from n periods past to the current period, as with the famous m
The HammerStar indicator is designed to search for the Hammer and Shooting Star patterns on charts of any currency pairs.
Hammer Downward trend.
The lower shadow is not less than 2 and no more than 3 times larger than the body.
There is no upper shadow, or it is very short (no more than 10% of the candlestick range).
The color of the body in the long game is not important, with the short - white hammer is much stronger than the black one.
Confirmation is suggested.
Shooting Star Uptrend.
The u
FREE
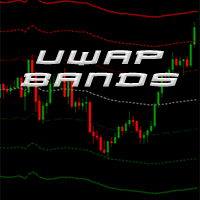
This indicator plots VWAP with 4 Standard Deviation bands. In finance, volume-weighted average price (VWAP) is the ratio of the value traded to total volume traded over a particular time horizon (usually one day). It is a measure of the average price at which a stock is traded over the trading horizon. VWAP is often used as a trading benchmark by investors who aim to be as passive as possible in their execution. Many pension funds, and some mutual funds, fall into this category. The aim of usi
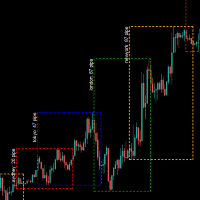
外汇市场时间指标,包含 悉尼,东京,伦敦,纽约 4个市场时间 考虑了服务器夏令时切换,以及各市场的夏令时切换 input ENUM_DST_ZONE InpServerDSTChangeRule = DST_ZONE_US; //服务器端夏令时切换规则 按照纽约还是欧洲 input int InpBackDays=100; // 最多绘制天数,出于性能考虑 input bool InpShowTextLabel=true; // 显示文本标签 哪个市场,当前波动点数 input color InpTextColor=clrWhite; // 标签文本颜色 input int InpTextFontSize=8; //标签文本字号 input bool InpFillBack=false; //方框背景色是否填充 input bool InpShowStat=false; // 显示各市场时间波动统计信息 input ENUM_LINE_STYLE InpLineStyle=STYLE_DOT; // 方框线样式
input bool InpShowWeekda
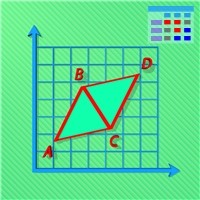
Multi-currency, multi-timeframe, harmonic pattern indicator AB = CD. Supports sending push notifications about signals to a mobile device, messages on e-mail, as well as messages using alerts on all available currency pairs and timeframes. This indicator was based on the indicator Harmonic ABCD Universal. Version for MetaTrader 5: https://www.mql5.com/en/market/product/44972 . See also: Harmonic ABCD Universal for MetaTrader 4 . Using modern software development methods has made the indicator a
This indicator improves the "DMI Trend" so that the trend signal reacts faster than before.
---The indicator allows you to simplify the interpretation of signals produced by the classical ADX indicator.
The position of the hight bars of the histogram relative to zero and the histogram coloring indicate the direction of price movement determined by the intersection of DI+ / DI-.
The position of the hight bars of the histogram relative to zero and the color indicate the strength of the price mo
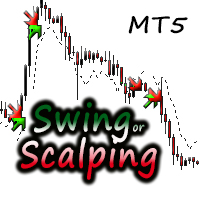
Continuous Coloured dot lines under and above price when conditions are met. Arrows Red and Green for entry Points. User can change the colours of the arrows in the colour section of the indicator. It is consider a great scalping tool on lower time-frames, while higher time frames will have fewer opportunities but trades will possibly last longer. There is an input for Alert on or off. This can be used effectively on M15/M30 Chart until up to H4 chart time. It is best if the user has some
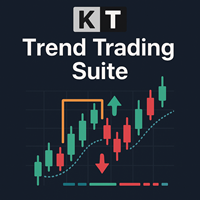
跟踪当前趋势及其回调 KT Trend Trading Suite 在价格图表上结合趋势方向、回调和突破分析。彩色趋势线显示当前方向状态,矩形信号框则标记趋势内回调之后形成的延续机会。 蓝色趋势线: 表示已经形成的上升趋势。 鲑红色趋势线: 表示已经形成的下降趋势。 信号框: 标记检测到的回调区域,新延续信号在该区域形成。 Signal Period 控制识别入场信号所用的幅度。Pullback Depth 控制接受延续形态之前所需的回撤深度。可将信号框作为结构化图表参考,并结合当前价格走势和您自己的入场规则进行判断。 比较九个时间周期的方向 多时间周期扫描器显示 M1、M5、M15、M30、H1、H4、D1、W1 和 MN1 的 Uptrend 或 Downtrend 状态。无需为每个周期分别打开图表,即可比较当前图表与更短及更长时间周期的方向。 图表趋势线提供详细的局部趋势视图,扫描器则显示该方向是否在更广泛的时间周期结构中保持一致。可根据需要的图表空间和背景显示或隐藏面板。 查看历史信号记录 绩效面板汇总当前图表历史范围内计算出的信号。它显示 Total Signals、Winn
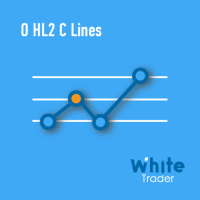
If you consider the extremes of the daily price as important points, this indicator will help in your trades.
Now, instead of manually drawing lines that mark daily highs and lows, you can use the O (HL) ² C Lines indicator.
Thus, the OHLC Lines indicator automatically plots the lines O (Open for the current day), H (High for the current day), L (Low for the current day) and C (Close for the previous day). Plot also the high and low of the previous day.
Thus, we have 4 static lines and tw

BinaWin NoTouch is an indicator that sends an alert signal when the trade is in the right position to wait for the breakdown of a side market.
It is specially designed to trade under the “No Touch” strategy of the Binary.Com platform with synthetic indexes N.10, N.25, N.50, N.75 and N.100
Similarly, trading can be done with the conventional CALL and PUT strategy of any Binary Options platform.
Requirements to use the indicator:
1. Have an account at Binary.Com
2. Configure the Binary.Com d
FREE
Se considera la secuencia de la serie Fibonacci (2,3,5,8,13) que sera multiplicado por un periodo (11 o 33 o 70 etc.), de las 5 lineas se sacara una sola que sera contendrá el máximo y mínimo de las 5, a esta linea se le aplicara un suavizador de 3....y a esta linea suavizada se le volverá a aplicar un suavizador de 3. obteniéndose 2 lineas suavizadas. A simple vista se ve las intersecciones que hacen las lineas que pueden ser usadas para comprar o vender. Cambien se puede usar con apoyo de otro

Introduction to Fractal Moving Average Fractal Moving Average indicator was designed as part of Fractal Pattern Scanner. Inside Fractal Pattern Scanner, Fractal Moving Average Indicator was implemented as multiple of chart objects. With over thousands of chart object, we find that it was not the best and efficient ways to operate the indicator. It was computationally too heavy for the indicator. Hence, we decide to implement the indicator version of Fractal Moving Average indicator to benefit ou
FREE
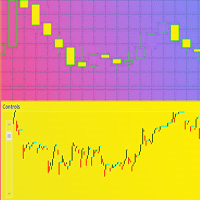
Индикатор для отображения свеч размером меньше одной минуты, вплоть до размера в одну секунду, для детализированного просмотра графика . Имеется ряд необходимых настроек для удобной визуализации. Настройка размера хранения истории ценовых данных транслируемых инструментов. Размер видимых свеч. Настройка отображения неподвижности на курсах графика. Возможность отображения на различных торговых инструментах. Удачной всем торговли.

Inspired from, Time is the most important factor in determining market movements and by studying past price records you will be able to prove to yourself history does repeat and by knowing the past you can tell the future. There is a definite relation between price and time. -William Delbert Gann Caution: It's not HolyGrail System, It's a tool to give you insight of current market structure. The decision to trade is made only with combination of economical understanding of underlying instru
DYNAMIC SR TREND CHANNEL
Dynamic SR Trend Channel is a simple indicator for trend detection as well as resistance/support levels on the current timeframe. It shows you areas where to expect possible change in trend direction and trend continuation. It works with any trading system (both price action and other trading system that use indicators) and is also very good for renko charting system as well. In an uptrend, the red line (main line) serves as the support and the blue line serves as the r
该指标显示任何时间范围内任何品种的最小化图表。显示的最大图表数为 28。图表可以位于主窗口和底部窗口中。两种显示模式:蜡烛图和条形图。显示的数据量(条形图和蜡烛图)和图表大小是可调的。 要使用迷你聊天,您必须首先将所需的指标放在常规图表上,然后将其保存为模板并通过适当的参数为迷你图表应用模板,例如,对于第一个图表,参数称为“模板名称 1”。 参数: Charts base corner - 基角 Charts subwindow number - 子窗口编号 Charts X/Y shift - 起始 X/Y 偏移 Charts width/height - 窗口宽度/高度 Space X/Y between charts - 图表之间的 X/Y 距离 Charts scale - 比例 Show date/price scale - 显示时间/价格比例 Charts in background mode - 后台模式 Columns count - 列数
FREE
Fractal Reverse MTF - Indicator for determining the fractal signal to change the direction of the trend for МetaТrader 5.
The signal is determined according to the rules described in the third book of B. Williams:
- In order to become a signal to BUY, the fractal must WORK ABOVE the red line
- In order to become a signal for SALE, the fractal must WORK BELOW the red line
- Signals are not redrawn/ not repainting The main idea of the indicator:
- Determine the change in the direction of t
The indicator shows when there are overprice and divergences on the RSI. In addition, it has configurable alerts, dynamic overprice levels and a special “RSI cleaner” function. The indicator that automatically calculates the premium rates! RSImaxmin is an indicator based on the Relative Strength Index (RSI) oscillator that effectively identifies changes in price trends as it reflects the relative strength of bullish movements compared to bearish movements. It is widely used by traders to measur
DSeize
DSeize - это индикатор для совершения покупки/продажи в MetaTrader 5. Простой и понятный индикатор, показывающий точки входа в рынок. Прекрасно подходит как для начинающих, так и для профессиональных трейдеров. Рекомендуемый таймфрейм H1. Рекомендуемые валютные пары: Мультивалютный. Работает как на 4-х, так и на 5-и значных котировках. Сигналы индикатора не перерисовываются. Особенности Вход совершается при закрытии часовой свечи и появлении индикатора.
Сигналы не перерисовываются. Сигн
The indicator allows you to simplify the interpretation of signals produced by the classical ADX indicator.
The position of the hight bars of the histogram relative to zero and the histogram coloring indicate the direction of price movement determined by the intersection of DI+ / DI-.
The position of the hight bars of the histogram relative to zero and the color indicate the strength of the price movement.
The indicator is a logical continuation of the series of indicators using this classica
FREE
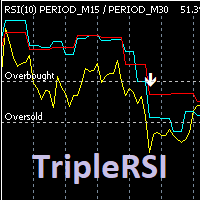
Индикатор отображает на графике данные RSI рабочего и двух старших тайм-фреймов, формирует сигналы выхода из зоны перекупленности / перепроданности кривой среднего временного периода. Опционально используется фильтр по данным старшего тайм-фрейма (расположение медленной линии выше средней для продажи и ниже средней - для покупки). Сигналы "подвального" индикатора дублируются на главном окне, отправляются сообщения во всплывающее окно, на почту и на мобильное устройство. Параметры индикатора: RSI

The indicator allows you to simplify the interpretation of signals produced by the classical MACD indicator.
It is based on the double-smoothed rate of change (ROC).
Bollinger Bands is made from EMA line.
The indicator is a logical continuation of the series of indicators using this classical and efficient technical indicator.
The strength of the trend is determined by Bands and main line.
If the bands width are smaller than the specified value, judge it as suqueeze and do not recommend tra
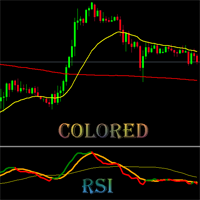
This is Colored RSI Scalper Free MT5 -is a professional indicator based on the popular Relative Strength Index (RSI) indicator with Moving Average and you can use it in Forex, Crypto, Traditional, Indices, Commodities. Colors are made to make trend, and changing trend more easily. Back test it, and find what works best for you. This product is an oscillator with dynamic overbought and oversold levels, while in the standard RSI, these levels are static and do not change.
This allows Colored RSI
Expert Market Edge is scalping, trending, reversal indicator, with alerts . You can use it all and fit with your strategy whatever it fits you. My recommendation is to combine with my Colored RSI , and when 2 signals are matched, and pointing same direction (for example buy on this indicator, and green on RSI, you can take a long position, stop loss should be last local low, if you want to be more conservative, add ATR. ) you can take position. If you using moving averages, that's even better i
Pattern Finder 2 is a MULTICURRENCY indicator that scans the entire market seeking for up to 62 candlestick patterns in 15 different pairs/currencies all in one chart. It will help you to make the right decision in the right moment. You can filter the scanning following the trend by a function based on exponential moving average. You can setup parameters by an interface that appears by clicking the arrow that appear on the upperleft part of the window after you place the indicator. Parameters ar

Probably almost every trader at least once, but dreamed about non-lagging MAs. I embodied this dream in my indicator. Using this indicator, you can predict future values. But the main application of the indicator is to generate buy and sell signals.
Determining the market trend is an important task for traders. The Trendometer indicator implements an advanced algorithm for visualizing the market trend. The main purpose of the indicator is to assess the market. The indicator is designed to iden
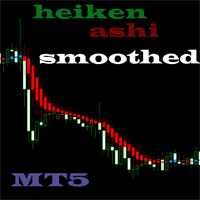
This is Heiken Ashi smoothed version, where you can choose on what type smoothness you want to make your strategy base. You can choose between EMA or MA, on the period you want. And you can choose colors.
Definition:
The Heikin-Ashi technique averages price data to create a Japanese candlestick chart that filters out market noise. Heikin-Ashi charts, developed by Munehisa Homma in the 1700s, share some characteristics with standard candlestick charts but differ based on the values used to cre
FREE
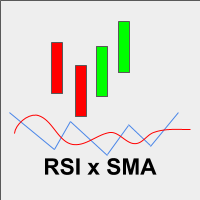
Esse indicador é a combinação do RSI (IFR) com Média Móvel Simples aplicada o RSI em um único indicador para facilitar a criação de alguma estratégia. Fiz esse indicador para que um único indicador contenha os buffer necessários para implementar alguma EA.
Descrição dos Buffers para o EA,
Buffer 0 -> Valor do RSI Buffer 1 -> Valor da média móvel aplicada ao RSI
FREE

The indicator shows: Average ATR over a selected number of periods Passed ATR for the current period (specified for calculating ATR)
Remaining ATR for the current period (specified for calculating ATR) Remaining time before closing the current candle Spread The price of one item per lot The settings indicate: Timeframe for calculating ATR (depends on your trading strategy) Number of periods for calculating ATR The angle of the chart window to display Horizontal Offset Vertical Offset Font size
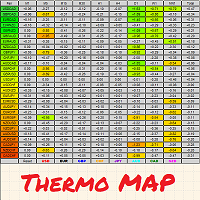
Thermo MAP is a multicurrency and multitimeframe indicator that display a smart heat map based on proprietary calculations. Watch how Forex market moved and is currently moving with a single dashboard and have a consistent and good idea of what is happening!
It can be suitable for both scalping or medium/long term, just select options that better fit your trading style Symbols list are automatically sorted based on the preferred column. There is the possibility to click on: First row, timeframe
FREE
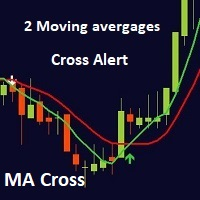
MA cross ALERT MT5 This indicator is a full 2 moving averages cross Alert ( email and push notification "mobile" ), 2 MA with full control of MA method and applied price for each moving average "slow and fast", -simple, exponential, smoothed, linear weighted. - close, open, high, low, median price, typical price, weighted price. you can modify periods as well for both MA. For any suggestions don't hesitate, thanks

THE GOAT INDICATOR ON THE MQL5 MARKET! ️ GET THIS INDICATOR AND STOP LOOKING FOR ANOTHER INDICATOR ️ ️ GET IT NOW BEFORE PRICE INCREASE! ️ SPECIAL DISCOUNT FROM 138$ -> NOW ONLY 88$!!! 2020 Breakthrough Indicator! Imagine that indicators can move the price/market! This indicator use for predict price movement! Using special algorithm for predicting the next price movement! This indicator can be used in any timeframes and any symbols! You can use it for binary option signal
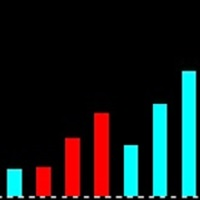
Ondas de Divergência. Antes do mercado tomar um sentido e se manter em tendencia, existem sinais que podem ser lidos, nos permitindo assim entender o "lado mas forte", e realizar trades de maior probabilidade de acerto com risco reduzido, esses movimentos são persistentes e contínuos, proporcionando excelente rentabilidade. Ondas de Divergência é um histograma que acumula a divergência de entre preço e volume a cada tick, permitindo assim encontrar pontos de absorção, áreas de acumulo e distrib
This indicator is based on the ICCI.
If a long pattern is detected, the indicator displays a buy arrow.
If a short pattern is detected, the indicator displays a sell arrow. Settings
CCI Period - default set to (14) Features
Works on all currency pairs and timeframes
Draws Arrows on chart Colors
Line Color
Line Width
Line Style
Arrow Color This tool can help you analyse the market and indicates market entry.

价格水平细分、高级统计、止盈计算和 3 种通知类型。 好处: 不要重绘你的结果 严格在蜡烛收盘时发出信号 假击穿过滤算法 它适用于任何趋势策略。 适用于所有工具和时间序列 手册和说明 -> 这里 / 问题解决 -> 这里 / MT4 版本 -> 这里 如何使用指标进行交易 只需三个简单的步骤即可使用 AW Breakout Catcher 进行交易: 第 1 步 - 开仓 收到买入信号,成功率超过 70% 第 2 步 - 确定止损 通过相反的信号选择中继线 第 3 步 - 定义止盈策略 策略一:达到 TP1 时平仓 策略 2:达到 TP1 时平仓 50%,达到 TP2 时平仓剩余 50% 策略 3:根据相反信号平仓 统计模块 为了更好地选择配对,请使用内置的统计计算。 计算交易 - 给出统计数据的信号总数 成功评级 - 达到 TP1 的信号百分比,或反转那些正获利的信号时的百分比 TakeProfit1 Hit - 达到 TP1 的信号百分比 TakeProfit2 Hit - 达到 TP2 的信号百分比 ExitProfit - 未达到 TP1 的信号百分比,但通过新信

Attention: New update - 4 major practicality improvements!
1) Alarm 2) Midas text value 3) Click panel 4) Can be connected to an EA to operate in semi-automatic mode
Attention - This indicator does not work perfectly in backtest due to MT5 peculiarities (Reading hotkeys or panel clicks) . My suggestion is that you test Automatic Vwap Midas which has automatic operation to analyze the calculation and then buy Start if you think the indicator will match your operating.
This indicator is use
Unique trend trading algorithm with advanced filtering and many features which should become a part of your trading arsenal. This indicator can give you also trading advisors (with take profit target), success rate scanner and much more.
Important information
For additional detailed information you can visit the 747Developments website.
Features Easy to use (just drag and drop to the chart) Possible to use with any trading instrument Possible to use on any time-frame Take profit advisors Succ

The Market Momentum indicator is based on the Volume Zone Oscillator (VZO), presented by Waleed Aly Khalil in the 2009 edition of the International Federation of Technical Analysts journal, and presents a fresh view of this market valuable data that is oftenly misunderstood and neglected: VOLUME. With this new approach of "seeing" Volume data, traders can infer more properly market behavior and increase their odds in a winning trade.
"The VZO is a leading volume oscillator; its basic usefulness
FREE

Dynamic Indicator --> YKL_DinDX Dynamic Indicator that creates a Band based on the distance from moving average specified by the user. The indicator considers the period entered by the user in order to calculate the average distance from moving average, creating an upper band and a lower band. This indicator is utilized by EA YKL_Scalper, version 2.0 or superior.
FREE

1. Why did I develop this series of indicators
I found that most traders need to use multiple time frame indicators. They usually switch time frame to see indicators. However, once the timeframe is switched, you cannot see the corresponding relationship between the price in the smaller timeframe and the indicator in the larger timeframe . For example: if your price chart is in H1 timeframe, you can see H4, D1 and W1 indicators in H1 timeframe Chart. This is more helpful for you to find th

1. Why did I develop this series of indicators
I found that most traders need to use multiple time frame indicators. They usually switch time frame to see indicators. However, once the timeframe is switched, you cannot see the corresponding relationship between the price in the smaller timeframe and the indicator in the larger timeframe . For example: if your price chart is in H1 timeframe, you can see H4, D1 and W1 indicators in H1 timeframe Chart. This is more helpful for you to find th

1. Why did I develop this series of indicators
I found that most traders need to use multiple time frame indicators. They usually switch time frame to see indicators. However, once the timeframe is switched, you cannot see the corresponding relationship between the price in the smaller timeframe and the indicator in the larger timeframe . For example: if your price chart is in H1 timeframe, you can see H4, D1 and W1 indicators in H1 timeframe Chart. This is more helpful for you to find th

1. Why did I develop this series of indicators
I found that most traders need to use multiple time frame indicators. They usually switch time frame to see indicators. However, once the timeframe is switched, you cannot see the corresponding relationship between the price in the smaller timeframe and the indicator in the larger timeframe . For example: if your price chart is in H1 timeframe, you can see H4, D1 and W1 indicators in H1 timeframe Chart. This is more helpful for you to find th

1. Why did I develop this series of indicators
I found that most traders need to use multiple time frame indicators. They usually switch time frame to see indicators. However, once the timeframe is switched, you cannot see the corresponding relationship between the price in the smaller timeframe and the indicator in the larger timeframe . For example: if your price chart is in H1 timeframe, you can see H4, D1 and W1 indicators in H1 timeframe Chart. This is more helpful for you to find th

1. Why did I develop this series of indicators
I found that most traders need to use multiple time frame indicators. They usually switch time frame to see indicators. However, once the timeframe is switched, you cannot see the corresponding relationship between the price in the smaller timeframe and the indicator in the larger timeframe . For example: if your price chart is in H1 timeframe, you can see H4, D1 and W1 indicators in H1 timeframe Chart. This is more helpful for you to find th

1. Why did I develop this series of indicators
I found that most traders need to use multiple time frame indicators. They usually switch time frame to see indicators. However, once the timeframe is switched, you cannot see the corresponding relationship between the price in the smaller timeframe and the indicator in the larger timeframe . For example: if your price chart is in H1 timeframe, you can see H4, D1 and W1 indicators in H1 timeframe Chart. This is more helpful for you to find th

1. Why did I develop this series of indicators
I found that most traders need to use multiple time frame indicators. They usually switch time frame to see indicators. However, once the timeframe is switched, you cannot see the corresponding relationship between the price in the smaller timeframe and the indicator in the larger timeframe . For example: if your price chart is in H1 timeframe, you can see H4, D1 and W1 indicators in H1 timeframe Chart. This is more helpful for you to find th

1. Why did I develop this series of indicators
I found that most traders need to use multiple time frame indicators. They usually switch time frame to see indicators. However, once the timeframe is switched, you cannot see the corresponding relationship between the price in the smaller timeframe and the indicator in the larger timeframe . For example: if your price chart is in H1 timeframe, you can see H4, D1 and W1 indicators in H1 timeframe Chart. This is more helpful for you to find th

1. Why did I develop this series of indicators
I found that most traders need to use multiple time frame indicators. They usually switch time frame to see indicators. However, once the timeframe is switched, you cannot see the corresponding relationship between the price in the smaller timeframe and the indicator in the larger timeframe . For example: if your price chart is in H1 timeframe, you can see H4, D1 and W1 indicators in H1 timeframe Chart. This is more helpful for you to find th

1. Why did I develop this series of indicators
I found that most traders need to use multiple time frame indicators. They usually switch time frame to see indicators. However, once the timeframe is switched, you cannot see the corresponding relationship between the price in the smaller timeframe and the indicator in the larger timeframe . For example: if your price chart is in H1 timeframe, you can see H4, D1 and W1 indicators in H1 timeframe Chart. This is more helpful for you to find th
MetaTrader市场是 出售自动交易和技术指标的最好地方。
您只需要以一个有吸引力的设计和良好的描述为MetaTrader平台开发应用程序。我们将为您解释如何在市场发布您的产品将它提供给数以百万计的MetaTrader用户。
