
Description One of the Dow theory tenets states: "Trends are confirmed by volume". This product is a multicurrency/multisymbol indicator that has been designed to define large and/or small tick volumes according to the mentioned tenet. The indicator may be used with any broker, irrespective of the name of the financial instrument since it is necessary to manually enter the name as an input parameter. If you enter a non-existent or incorrect name of a financial instrument, you will receive an err

Description The Panel is designed to select top signals from the terminal database and the MQL5.community website. To allow web requests for the program, you need to enable the "Allow WebRequest for the following URL" option in the terminal settings and explicitly manually specify URL https://www.mql5.com/ .
Parameters The terminal tab — selecting signals form the terminal data base. sorting — choose a sorting field to select the best signals from the data base: NONE RATING DATESTART DRAWDOWN G

The analyzer allows you to visually evaluate the margin level change when changing the price and position volume. The product shows the price level at which Stop Out, is activated, as well as the total buy and/or sell position level. The calculations are made only for the orders opened for the current chart's symbol. Impact of other orders is not considered. The panel allows you to quickly increase or decrease position volume in the most efficient way.

Description Pivot Lines is a universal color multicurrency/multisymbol indicator of the Pivot Points levels systems. You can select one of its three versions: Standard Old , Standard New and Fibo . It plots pivot levels for financial instruments in both windows simultaneously. The system will automatically calculate the Pivot Point on the basis of market data for the previous day ( PERIOD_D1 ) or week ( PERIOD_W1 ) and the system of support and resistance levels, three in each. It can also displ

The script allows to close all opened positions for a given currency pair (EURUSD by default, but it can be change to any existing currency pair). Input parameters sSymbol = "EURUSD"; PendingOrders = false; which will appear in the Inputs tab where you can change a working symbol and set PendingOrders to true to delete all pending orders for a given currency pair. This script will close and delete all positions for a given currency pair only. Keep in mind that you have to "Allow automated tradin

The Linker charts master utility links all open chart windows and switches them to one instrument. All the operations in the window on which the indicator is running are copied to all the linked ones. It is a great aid for those trading based on support and resistance levels. For instance, a level drawn for D1 will be drawn in other windows. The utility responds to the change of the style, color of objects and selection of the timeframes to display the objects. The utility copies the settings fr

This script is designed and used to move StopLoss for all EURUSD positions (or any other available currency pairs) at once. The Stop Loss will be moved to a level: Bid - StopLevel (for Long position) Ask + StopLevel (for Short position). STOPLEVEL applies to distance between entry price and SL. Of course, this script will move the StopLoss only if: Bid > OrderOpenPrice() + StopLevel (for Long) and Ask < OrderOpenPrice() - StopLevel (for Short). When you put the script on the chart the Input Box

The script allows you to close all opened positions for a given currency pair ( EURUSD by default, but it can be changed to any existing currency pair) when Sum of Profit from all opened positions (by chosen currency pair) is equal or greater than value of the input parameter: SumProfit .
Input Parameters sSymbol = EURUSD SumProfit = 100 Slippage = 2 You can change SumProfit to any positive value ( in dollars , not in points!). This script closes all positions for a given currency pair only.

BuyStop_SellStop_Grid script opens BuyStop and SellStop pending orders. You just need to drop this script on the chart with a desired currency pair. Before placing all pending orders, the input window is opened allowing you to modify all input parameters: LongPos - if TRUE, BuyStop orderi is opened. ShortPos - if TRUE, SellStop order is opened. InitLot - initial lot. LotCoeff - if 1, all pending orders will have the same lot size. InitStep - difference between two consecutive orders in points.

BuyLimit_SellLimit_Grid script opens BuyLimit and SellLimit pending orders. You just need to drop this script on the chart with a desired currency pair. Before placing all pending orders, the input window is opened allowing you to modify all input parameters: LongPos - if TRUE, BuyLimit order is opened. ShortPos - if TRUE, SellLimit order is opened. InitLot - initial lot. LotCoeff - if 1, all pending orders will have the same lot size. InitStep - difference between two consecutive orders in poi

Complete Pending Orders Grid System opens any combinations of Buy Stop, Sell Stop, Buy Limit and Sell Limit pending orders and closes all existing pending orders. You just need to drop this script on the chart of a desired currency pair. Before placing all pending orders, the input window is opened allowing you to modify all input parameters: DeleteAllPendings – if true , then all pending orders (for current currency) will be deleted. BuyStop – if true , BuyStop order is opened. SellStop – if tr

Description Trend Trading is an innovative analyzer designed for trend following trading. The analyzer consists of a trend line, colored bars, arrow pointers and reference information. After completion of the current bar, the trend line, the color of the bar and the arrow pointers are not redrawn. Change of market sentiment can be calculated based on one of the fourteen basic indicators included in the standard package of MT4, it affects the color of the trend line. Optionally colored bars, arro

Description Stoploss Master Expert Advisor helps you to manage the virtual Stop Loss. It replaces the real Stop Loss levels by virtual ones with further trailing according to its own strategy of preserving a reached profit level. This EA is used when following the trend. In multicurrency/multisymbol mode, the EA is attached to the chart of each financial instrument separately and tracks positions only of a certain financial instrument. Management is performed only by market orders. The EA starts

The analyzer panel allows traders to add the pending order grid (Buy Limit, Sell Limit, Buy Stop, Sell Stop) quickly and efficiently. Parameters stop mode - select stop setting mode every order - stop levels are set for each order separately position as - common stop levels for all orders order type - select pending order type Buy Limit Sell Limit Buy Stop Sell Stop magic - set a magic number for open orders if necessary. If position as mode is enabled, stop levels are corrected for all orders

This script searches for all positions for the current currency pair and calculates the sum of all lots for those positions with negative profit and offers to open a hedge (opposite) position with a lot size equal to the calculated sum of lots multiplied by LotCoeff. You just need to drop this script on the chart with a desired currency pair. Before placing opposite orders, the input window is opened allowing you to modify all the input parameters: LotCoeff = 1.5; BuySearch = true; SellSearch =

Spread Histogram displays spread changes at each price movement. The product is very useful for scalpers as it allows them to spot good market entry points. Small spreads can be used to open a new order or close the current one. This indicator is equipped with: maximum spread minimum spread up / down spread histogram average spread Inputs: AveragePeriod (determine the average of the "X" Histogram) Shift Report

The script allows to close part of opened position if this position has some profit. You just need to drop this script on the chart with a desired currency pair. Let's say you have 1 lot for a Long position with positive profit. With this script you can close any part of the 1 lot (input parameter LotCoeff from 0.1 to 0.9) and remain (for example, 0.4 lot) will have a BreakEven StopLoss. Before placing an opposite orders, the input window is opened allowing you to modify all input parameters:
Automatic stops monitors your account and automatically sets the values you enter in the EA for stop loss, take profit and also trailing stop. As long as the EA is attached on a chart it will set stops and offer automatic trailing to any new trades for that currency pair so you wont have to manually enter them every time you open a trade. Features include: Ability to select which trades should be monitored via magic number. You can leave the value to 0 to only monitor manual trades or to any one

Bears CD HTB Global (Bears Convergence/Divergence High Top Bottom Global) is an analytical bears convergence/divergence indicator (C, D or CD) between a financial instrument and 22 MT4 indicators working on all periods simultaneously. The indicator measures the power of CD for indicators and periods and is the second one out of the two possible versions (HBT and HTB).
Features The analyzer is not a lagging one. It works by ticks and is able to show CD in the main window even in case the MT4 in
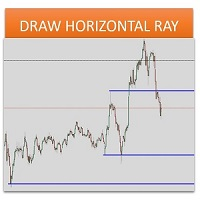
Sometimes we want to draw a horizontal ray from any given price based on a candlestick, and this tool solves that with just 1 key! In order to draw an horizontal ray you just need to drag and drop the indicator over any chart you want and then: 1) Click over ANY candle and then 2) Hit any of the following keys: O - It will draw an horizontal ray right at the OPEN price of the clicked candle H - It will draw an horizontal ray right at the HIGH price of the clicked candle L - It will draw an horiz

Bulls CD LBT Global (Bulls Convergence/Divergence Low Bottom Top Global) is an analytical bulls convergence/divergence indicator (C, D or CD) between a financial instrument and 22 MT4 indicators working on all periods simultaneously. The indicator measures the power of CD for indicators and periods and is the first one out of the two possible versions (LBT and LTB).
Features The analyzer is not a lagging one. It works by ticks and is able to show CD in the main window even in case the MT4 i

The FFx Watcher PRO is a dashboard displaying on a single chart the current direction of up to 15 standard indicators and up to 9 timeframes. It has 2 different modes: 1. Watcher mode: Multi Indicators User is able to select up to 15 indicators to be displayed User is able to select up to 9 timeframes to be displayed
2. Watcher mode: Multi Pairs User is able to select any number of pairs/symbols User is able to select up to 9 timeframes to be displayed This mode uses one of the standard indicat

THE [VIZUALIZER] is a MetaTrader (MT4) Script designed to visualize an account history. It will read the account statement and then will visualize the positions on chart in form of rectangles, showing the OpenTime, OpenPrice, CloseTime and ClosePrice. Generally, it has been developed to analyze the trading history, to observe how risky the particular positions were, allowing you to analyze the trading strategy from the account statement. It is working with standard MS Excel CSV files It is visua

MarkerElliottWave is a panel for rapid and user-friendly manual markup of Elliott waves. One can select a color and a font of marks. There are also functions for removing the last markup and the entire markup made by the indicator. Markup is made in one click. Click five times - have five waves! MarkerElliottWave will be a great instrument both for beginners and professional analysts of Elliott waves.

Copies transactions between MT4 terminals. Possibilities: quick copy start minimum processor load direct and reverse (reverse) copying. copying Take Profit and Stop Loss levels copying deferred and their changes copy transactions one to many copy trades many to one local copy only Attention: The product is designed for copying trades only within a single computer or VPS with access to the desktop. The product will not work on the built-in Virtual Hosting of the terminal. We will help you set up

货币趋势和强度的可视化指标,其形式为直方图和主图表上的表格,货币趋势变化图表和附加图表窗口上的分析块。分析由 8 种主要货币(欧元、美元、英镑、日元、澳元、加元、瑞士法郎、新西兰元)形成的 28 种货币对。
指标特点 确定货币和符号趋势的方向和强度,并在此基础上构建多色直方图、表格,告知数字值和图表 实时显示货币的相对位置和变化趋势。 它以图表的形式表示安装该指标的货币对的每种货币的历史趋势。 根据所选模式之一分析货币(分析块)
分析块 由分析结果列表和按钮组成。可以使用 Analisis 参数设置默认分析模式。使用 Next 和 Prev 按钮,您可以切换分析模式,使用 Revs 按钮,您可以反转评级排序。 分析模式: 货币评级(分析=1个参数); 货币趋势强度(分析=2 参数); 字符评级(分析= 3参数); 符号趋势强度(分析 = 4 参数)。
使用该指标进行交易的策略示例 买入最强的品种并卖出最弱的品种; 买入或卖出包含最强或最弱货币的符号; 趋势线交叉——换仓、平仓; 如果趋势强度超过一定水平(例如,M15 图表为 50),则购买货币; 如果趋势强度大于/小于特定水平(
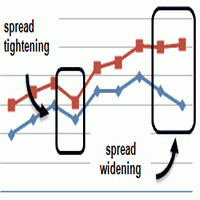
This is an indicator that allows you to check the past data on the spread from your broker’s account. All the data is being recorded and you can check at any time what was the Maximum, Minimum and Typical Spread in any hour. All you need to do is to allow Low Spread Seeker to keep track of your data and then you will just check how it was changing during the day. This information is useful if you want: To select a broker for real trading. Create your demo account or real account with minimal fun
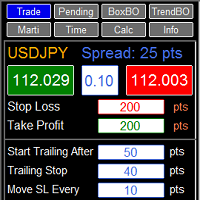
RFX EasyTrade is a professional panel to make your trades as easy as possible. You can perform scalping by acting fast and efficient. You can draw a box or a trend line and let RFX EasyTrade to catch a breakout and manage the trade automatically. You can set pending orders and set Order-Cancels-Order easily. If you are a fan of Martingale strategy just set a few settings on the panel and let RFX EasyTrade to automatically manage the trades. You can trade based on time without waiting long time
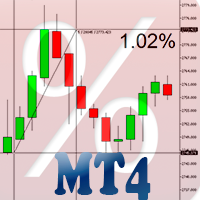
Percent Crosshair is a powerful and easy percentage measure tool. Measure the chart percentage quickly! Don't waste your time anymore! Just attach the Percent Crosshair indicator to the chart, select crosshair mode at toolbars or press Ctrl+F and start using the crosshair as you always do! The percent measure will be next to the indicative price. Customize your indicator the way you want! There are four entry parameters: Positive % color: set the desired color when % is positive. Negative % colo

You can directly test and improve your trading skills through simulation. Contact me if you want to add another button's feature. Live trading available!
Main features: Direct buy Direct sell Pending Buy (Limit/Stop) Pending Sell (Limit/Stop) Setup Takeprofit point and/or Stop Loss point Setup a price for pending orders Setup the breakeven stop loss to the plus direction (in pips) Close only Buy Close only Sell Close all orders opened Modification of SL/TP/Pending price (drag it)
Modification

This indicator will help you to show ALL history trading statistics of any account you want. You just need to add it on any chart, and it will calculate important information from history of trading to help you to analyze trading result. It will help you to save your time to analyze any account's trading result, you will see win/lose rate of all trades on all pairs, trades number of all pairs, total lot on each pair, total lots on all pairs, total win/lose on this account... So, you will know wh

This EA represents an interactive panel with adjustable parameters destined for installation and deletion of pending orders (orders grid generator). You can place the panel anywhere on the screen or hide it into a dot clicking on the button in the upper left part of the chart (it will be shown after clicking on it for the second time). Number and step of orders, lot size, vertical shift for limit orders - all these things make your work easier. There are functions for restoring according to pend

Provides the simplicity of binary options but addresses the shortcomings of regular binary options, namely: Poor risk reward ratio, fixed duration trades, poor broker choice, poor indicators/alerts, no hidden (stealth) stop loss/take profit, etc.
Features 1 to 1 risk reward ratio, calculated automatically (configurable) Manual (with alert) or automatic trade entry (on alert conditions) Lot size calculation (money management) - based on % of account to risk or fixed amount Compact interactive on

Pending Orders Grid Complete System opens any combination of Buy Stop, Sell Stop, Buy Limit and Sell Limit pending orders and closes all existing pending orders. You will have a possibility to put a legitimate Open Price for the first position in the grid. Usually it should in the area of Support/Resistance lines. You just need to drop this script on the chart of a desired currency pair.
Input Parameters Before placing all pending orders, the input window is opened allowing you to modify all in

Olimpia Dragged Trends! This dashboard indicator is a visual tool which recognizes dragged trends of 28 pairs in a easy-to-read histogram. You will see a group of squares indicating the sum and average values of trends of the last "...." minutes for each square from L to A in a dragged way. "Dragged Way" means that regardless the hour of the day or opened or closed candle it always shows the present and the pastinformation. You can configure a sequence of numbers with values between 1 minute to
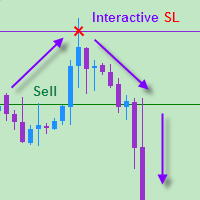
The EA allows a trader to place stop loss invisible for brokers and thereby prevent false breakthroughs and unwanted stop loss triggering. When you use standard stop loss, the price may break through stop loss before moving to the direction of an open order and therefore the orders is closed. Interactive Stop Loss removes standard stop loss of the open order and adds a horizontal line instead. After this it maintains the order until the line is crossed by the price. And then it finally closes th
Pending Orders Grid Complete System opens any combination of Buy Stop, Sell Stop, Buy Limit and Sell Limit pending orders and closes all existing pending orders. You will be able to Drag-and-Drop the Script on the chart and it will pick up the start price for the first position in the grid from the "Drop" point. Usually it should be in the area of Support/Resistance lines.
Input Parameters Before placing all pending orders, the input window is opened allowing you to modify all input parameters:

This is a must have tool for a serious trader. It saves your precious time spent for opening/closing trades, creating pending trades and modifying your TP/SL in bulk according to either pips or price. If you need to quickly open several pending orders (Buy Stop, Sell Stop) at a certain distance from each other, this script will do all the routine for you! The first time you use this handy tool, you will realize it has already paid for itself. Instructions: Drag and drop this script onto a chart.

The product combines a manual trade panel with the ability to perform actions automatically in a highly configurable way. Actions include capturing indicator values and then based on those values raising alerts, open/close or partially close trades, scale-in, setting up pending orders, adjusting stop loss, take profit and more. On-chart controls can be configured, such as tick boxes and buttons, so can be fully interactive. The EA also handles money management, news events, hidden stop loss, tak

Most of brokers make slippage for your orders (stop orders or market orders). When you make limit orders (Buy or Sell), they don't make slippage for you. Because it is for your advantage. This EA will resolve limit slippage problem for you with any brokers. Slippage Problem Example: The price now is 1.31450, you put sell limit at 1.31500. If the price jumps to 1.31550. The Broker will execute your sell limit at 1.31500 NOT 1.31550. If you put buy stop, the Broker will execute it at 1.31550 (or m

All Pending Orders with StopLoss opens any combination of Buy Stop, Sell Stop, Buy Limit and Sell Limit pending orders and closes all existing pending orders. If boolSL = true then this Script will calculate one common StopLoss value as the StopLoss for a first/last orders and put this value in all pending orders.
Input Parameters Before placing all pending orders, the input window is opened allowing you to modify all input parameters: DeleteAllPendings : if true , then all pending orders (for

Binary Options Trading Pad is a very useful tool for trading binary options on the MT4 platform. No need to setup plugins outside MT4 anymore. This is a simple and convenient panel right on MT4 chart. Demo: For testing purpose, please download the free demo version here: https://www.mql5.com/en/market/product/9981 Features
One-click trading buttons on the panel. Trade multi-binary option symbols in one panel. Auto recognize all binary options symbols. Show order flow with expiration progress. Mo

Binary Options Copier Local is an EA that allows to copy binary options trades between MT4 accounts on the same computer. With this copier, you can act as either a provider (source) or a receiver (destination). All binary options trades will be copied from the provider to the receiver with no delay. Demo : Demo version for testing can be downloaded at: https://www.mql5.com/en/market/product/10047 Reference : If you need to copy between different computers over Internet, please check Binary Optio

Binary Options Copier Remote is an EA that allows to copy binary options trades between MT4 accounts at different computers. This is an ideal solution for signal provider, who want to share his trade with the others globally on his own rules. Provider can give free bonus license to 10 receivers. That means those 10 receivers can copy from provider by using Binary Options Receiver Free (no cost). From 11th one, receiver have to buy Binary Options Receiver Pro (paid version) in order to copy from
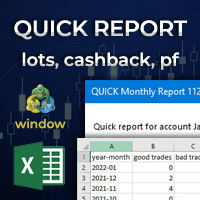
Quick Monthly Report – One Click Report Displays the results of trading according to monthly periods in a pop-up window Advantages With just one click you can view a list of the entire history according to months Exports data to CSV files with custom separator Filter by Magic Numbers Filter by Symbols Filter by words, letter or phrase in the comment Calculates the profits gained and the percentage of a Performance fee Enables to calculate the traded Volume or Lots with cachback in USD Par
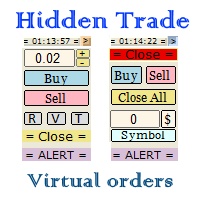
Small trading panel for managing orders and positions in 1 click for MetaTrader 4 Version for MetaTrader 5 here Set hidden TakeProfit, StopLoss and pending orders at lines placed on the chart Work on time on the news Backtesting manual strategies in the tester Placing virtual orders Playing a sound signal when the price reaches a level Automatic closing of all positions on the account or symbol by the total take profit in the deposit currency
Description Can be dragged to any part of the chart
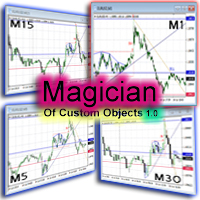
前言: 或许你已经寻找心仪的工具很久了,现在它就在这里,赶快行动吧。这是一个非常实用的脚本工具,已经在实盘交易中得到应用。 背景: 我们经常会在图表上手动绘制各种各样的线条(物件),我们也经常需要同时使用多个不同周期的图表协调工作这是很重要的。 过去,我们需要在不同周期的图表上重复同样的手动绘制各种线条的工作(比如,压力线,支持线等等)。然而,在小周期(比如M1)上如果我们要绘制一个跨越稍微大一点的时间周期或者跨越稍微大一点的价格幅度的时候,手动绘制将变得麻烦而且很难保证精度。 比如,可能需要我们缩小图表到不能再小……或者又需要我们放大图表到不能再大……或者需要不停的向右拖动图表才能找到我们需要绘制项目的一个历史位置(此时你最好没忘记关闭“自动滚动”按钮否则一切白费了)……或者有时候需要绘制的项目较多需要花费很长时间……或者当我们还没有绘制完毕的时候,一个明显趋势已经开始了导致你错过了最好的入场位置错过本属于你的很多利润…… 现在,有了这个脚本,以上这些问题都可以在瞬间得到解决, 它能 让你的交易变得更轻松,辅助你更轻松的获得本属于你的利润! 功能简介: “搬运大师”可实现将
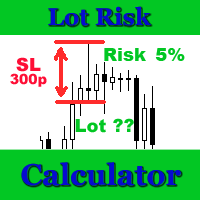
Lot Risk Calculator is a panel for order size calculation according to stop loss and allowed risk per trade. The calculation is performed for the symbol the indicator is launched at. You can set risk and stop loss manually in the panel. The stop loss is set considering 4 or 5 digits, for example, 20 - 4-digit, 200 - 5-digit. After editing each parameter, press Enter to confirm. To calculate a lot, click Calculate. The result appears below the button. Note! Set the panel for all necessary symbols

Desk Analytical Table Portfolio Monitoring for Active Traders Overview: The Desk Analytical Table indicator is a professional tool designed for traders managing multiple financial instruments simultaneously. It consolidates key data on open positions, orders, and market statistics into a single window, ensuring seamless portfolio control even during high-intensity trading sessions. Key Features: ️ Multi-Instrument Analysis - Monitor up to 30 assets in real time with quick switching between inst

This utility ensures a real-time synchronization of multiple charts. Any event of a graphical object creation/modification/deletion, chart scrolling and zooming is copied from the current source chart to one or more receiving charts. Note: demo-version of this product doesn't work in the backtester! ______________________________________________________________ Settings: Synchronize with - select the receivers: Same symbol - all charts with the same symbol; Same symbol - all charts with the same

EquityProtect provides hidden StopLoss, TakeProfit or TrailingStop based on the account equity. All orders of all symbols can be closed or just the chosen currency and/or just buys or sells or pending orders deleted. EquityProtect closes all or just defined orders when the account equity falls under or rises over a certain level. Besides EquityProtect can use the account equity as trailing stop. A comment in the chart shows the equity where the robot will react. mt5 version >> EquityProtect is v

This is a prototype of the famous Control and management of transactions panel. There are two main differences: Allows to work with all the variety of financial instruments opened by a user and not only with instruments it was attached to; To activate levels of order closure hidden from a broker, it uses not lines but modifiable virtual levels. To enjoy the full functionality of the panel you are advised to have: Desk analytical table . Their combined operation allows to keep the situation under

Inform Panel For ALL Symbols — Advanced Multi-Instrument Trading Management The Inform Panel For ALL Symbols is a sophisticated trading management tool designed to streamline control over all financial instruments in a trader’s portfolio, eliminating the need to attach it to specific charts. Its core innovation lies in using modifiable virtual levels for stop loss (SL) and take profit (TP), allowing discreet order closure hidden from brokers. The panel automatically detects and lists all active

This panel is very simple to use and it is a very ally to manage your positions and orders. Also you can modify your risk, writing in fields directly on Panel.
One click on buttons and the operation on market is done!
Operations possible: BUY/SELL Break Even Split (close 50% all orders) Close All positions Hedging (opens reverse positions to cover) Close only BUY positions Close only SELL positions Close All pending orders Reverse all positions Please watch the video to verify the very simple u

The script clears the chart window from labels of order tracing. It removes labels of only closed orders. It clears charts in all windows opened in the terminal.
Parameters: Symbol: clear charts of the specified symbol. If not said, clear charts in all windows. Last Data : orders with a date of closure which goes after the specified one will not be deleted. If not said, tracing of all closed orders will be deleted. Confirmation : True - confirmation of chart clearance for each window, False - n

The script draws levels based on the weekly options reports published on the ftp server of CME Group ftp://ftp.cmegroup.com/bulletin/. On the server, select the report for the day preceding the one you want to draw the levels on (to draw levels on 02.10.2015 download a report of 01.10.2015, most reports are published at 10:00 Moscow time the day after the reporting date, this is exactly what we need). Select the required option from the downloaded ZIP file, for example for EURUSD you need Sectio
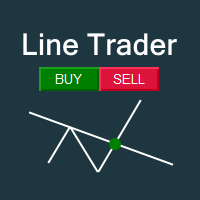
This EA you can automatically act on trend lines of your choice. You only need to draw a line and then press the buy or sell button. Suitable for traders the chart pattern (triangles, channels, spikes ...) act. The tool is also suited for quick and easy to set Pending Orders.
Input parameters Magic - Choose magic number MoneyManagement - Automatically calculated lot size, values are displayed on the lines RiskMode - Choose risk model RiskPercent or RiskMoney RiskPercent - In percent when money
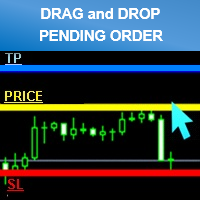
Easy way to place pending order , "Just Drag & Drop" Work on live and back-test (Strategy Tester) Note: Demo version for testing can be found here: https://www.mql5.com/en/market/product/11287
Features
1.Easy Way for Opening Pending Orders. You only need to drag line to define open price, stop loss, take profit values. Then click the "ORDER SEND" button. EA will open pending orders for you automatically. And also automatic detect types of pending order (Limit and Stop).
2. Can work on
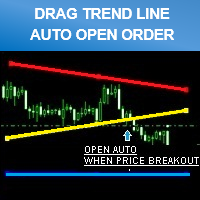
Smart tool system for opening orders by Trend Line automatic.
Just drag a Trend line to define your breakout point then click "Confirm Order" button. The EA will automatically opening order when price breakout Trend line that defined by you. Work on live and back test (Strategy Tester) Can modify trend line on real-time. Note: Free Demo version for testing can be found here: https://www.mql5.com/en/market/product/11289 Features
Drag trend line for open trading by when price breakout that line.
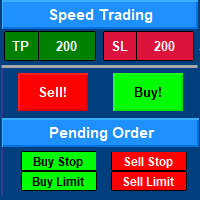
Speed Trading / One click trading / Faster trading. The EA is helping in opening order and allows you to manage orders more quickly with "One Click Trading" system. It can also work with pending orders. This EA can work on live and back-test (Strategy Tester). Note: Demo version for testing can be found here: https://www.mql5.com/en/market/product/11290
Features
1. Speed Trading / One Click Trading Panel. Open orders with one click. Setting Lot Size ,Take Profit, Stop loss on the screen.

This utility tool help you to close all orders or apart of all (you can choose which symbol you want) immediately with only ONE CLICK, its work very fast ,so it will helpful for you in your trading to manage trading faster. If you want to close all orders, you just need to let symbol parameter is blank (like in default setting). If you want to close all orders of one pair (for example EURUSD orders) you need to put symbol =EURUSD (see screenshot below). This is a script, so its will be putted in

This utility tool help you to close all orders having profit immediatly with only ONE CLICK, its work is very fast. You can choose which symbol you want or close all symbols so it will helpful for you in your trading to manage trading faster. If you want it work on all symbols, you just need to leave symbol parameter blank (like in default setting). If you want it work on 1 symbol only (for example EURUSD orders) you need to put symbol =EURUSD (see screenshot below). This is a script, so its wil

This utility tool help you to close all orders which is having loss immediatly with only ONE CLICK, its work is very fast. You can choose which symbol you want or close all symbols so it will helpful for you in your trading to manage trading faster. If you want it work on all symbols, you just need to leave symbol parameter blank (like in default setting). If you want it work on 1 symbol only (for example EURUSD orders) you need to put symbol =EURUSD (see screenshot below). This is a script, so
"All in one on Ultimate Panel" Helping in opening and manage orders with "one click trading" system. Note: Demo version for testing can be found here: https://www.mql5.com/en/market/product/11563
Features
1. Speed Trading / One Click Trading. Just set Lot Size, Stop Loss,Take Profit level. Then click the "BUY!" / "SELL!" button. Order will open immediately.
2. Drag line to place pending order. Just click "BUY LINE" or "SELL LINE" button. Then 3 horizontal lines will appear on the cha

BuyLimit and SellLimit Buttons opens any combination of Buy Limit and Sell Limit pending orders and closes all existing pending orders. If boolSL = true, then the EA will add a Stop Loss value to all pending orders. If boolTP = true, then the EA will add a Take Profit value to all pending orders.
Inputs Before placing all pending orders, the input window is opened allowing you to modify all input parameters: DeleteAllPendings: if true , then all pending orders (for the current currency) can be

Auto SLTP Maker MT4 is an assistant for all those who forget to set StopLoss and/or TakeProfit in deal parameters, or trade on a very fast market and fail to place them in time. This tool automatically tracks trades without StopLoss and/or TakeProfit and checks what level should be set in accordance with the settings. The tool works both with market and pending orders. The type of orders to work with can be set in the parameters. It can track either trades for the instrument it runs on, or all
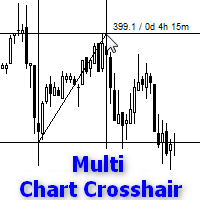
Indicator works like script and shows crosshair on all charts of any symbol. It can be used for comparison price levels and time periods on all charts of the same currency pair or for comparison candles according to time periods on charts of any symbols. You can also compare different types of charts, for instance standard chart with tick or range bar charts. Indicator can be easily attached to chart from navigator menu or using hotkey Ctrl + F, which you need to set manually. Moreover you can a

The Grid Builder MT4 utility is designed for placing a grid of pending orders of any complexity and will be an excellent tool in the hands of a trader who trades grid trading strategies. The tool has numerous settings that allow you to quickly and easily build a grid of orders with the specified parameters. All types of pending orders are supported:
Buy Stop; Buy Limit; Sell Stop; Sell Limit. The script also allows you to delete a previously placed grid of orders in one click. If the "Delete

TPSpro 风险管理器 是一个独特的专业风险控制系统,适用于任何培训和任何资本的交易者。让您避免交易中的损失和交易中的严重错误。
TPSpro 风险管理器对于风险管理是必要的,主要是对于剥头皮交易者和日间交易者而言,但任何交易风格的交易者都可以成功使用。 该面板有 3 列,每一列都包含有用的信息。
第一列显示截至当月初的账户信息,即以百分比和存款币种显示总体结果。 第二列显示设置中指定日期的风险。 第三列显示当前账户情况。 如果一天超过规定的风险或超过订单数量,顾问将关闭所有订单,并且不允许开设新订单,从而保护交易者免受“情绪交易”的影响。 “风险管理器”允许您根据以下参数控制交易: 每日损失限额 余额损失限额 交易数量限制 单一方向交易数量限制(网格保护) 连续亏损交易后被迫止损
连续两天亏损后,交易将被锁定一天
风险管理系统允许交易者: 保持每日利润 在线查看您的交易统计数据 理顺交易纪律,显着提高盈利能力(摆脱“倾斜”和“网格”) 查看当前资金并考虑经纪佣金 为了使风险经理能够满负荷工作,它必须位于远程 VPS 或任何其他偏远的地方,在情绪爆发时交易者无法快速到达并干扰
This is a purely Price Action indicator that tracks the open and close prices of all 28 major Forex currency pairs and calculates a volatility value based on every tick in real time. It only tracks raw price data and not data from another indicator and it does not use any complicated formula or algorithm in calculating volatility. This version shows volatility for all 28 major currency pairs
Benefits Accurate and real time update of volatility Volatility across all 28 major Forex currency pairs
MetaTrader市场提供了一个方便,安全的购买MetaTrader平台应用程序的场所。直接从您的程序端免费下载EA交易和指标的试用版在测试策略中进行测试。
在不同模式下测试应用程序来监视性能和为您想要使用MQL5.community支付系统的产品进行付款。
您错过了交易机会:
- 免费交易应用程序
- 8,000+信号可供复制
- 探索金融市场的经济新闻
注册
登录