 MetaTrader 5
 专家
 指标
 程序库
 实用工具
 窗口小部件
 规则
适用于MetaTrader 4的新EA交易和指标 - 155
 EA交易自动执行市场交易,而指标可使您更准确地分析报价并预测价格行为。
通过这些应用程序,您将能够更明智地在MetaTrader 4执行交易,抓住更多的交易机会。
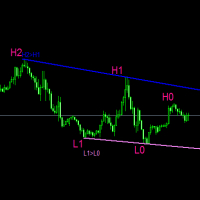
#forex #sharemarket #trading Disclaimer :- My videos, presentations, and writings are strictly for educational purposes and should not be considered investment advice. I cannot guarantee the accuracy of any information provided. It is essential to conduct your own research and consult a qualified financial advisor before making any investment decisions. I bear no responsibility for any financial losses or negative outcomes resulting from the use of my content. Please exercise caution and seek
FREE
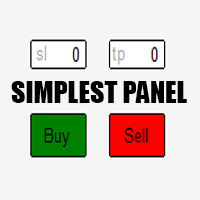
Just a simple panel that I created to make my trading life easier. Features: Buy and Sell with TP & SL right on chart Lot size is calculated by risk percentage Martingale - will open opposite position when SL hit (please don't enable unless you know what you are doing)
Will have more add-ons like Close-all button, Break-even, Trailing-Stop, etc. It's FREE so please leave your negative review somewhere else.
FREE

I was looking for a lean symbol changer. I could not find any. Normally other products hide lot's of screen space. So I developed a very lean symbol changer Just click on the 2 currencies you want to combine. The order does not matter. If you miss some pairs, you can add up to 5 custom symbols. Please make sure, your broker support your custom symbols. Drag an drop the panel with the green button.
In future I plan to include suffix and prefix als well.
FREE

This is an EA using the moving average as an indicator.
The parameters are as follows:
Lots=0.1 (number of hands at opening)
MaximumRisk=0.02 (maximum risk coefficient)
DecreaseFactor=3 (Risk Factor)
MovingPeriod=12 (calculated time period)
MovingShift=6 (time period offset)
Trading strategy: When the closing price is higher than the average price and the opening price is lower than the average price, make a purchase order.
When the closing price is less than the average price and the o

All Cleaned Up Trading - integrated with market volatility scalping trading. Settings for all 28 Currency Pairs and XAUUSD (for 5 Digits pairs) are available in the comments section for immediate use. Thus, there is literally no Symbol that cannot be traded. Download and start your live trading NOW!
The Universal HedgeR Expert - just like The Fibo Reversal Expert is the Expert Advisor built based on the trading strategy of "The Fibo Reversals Indicator". Here too, the E.A. is used with two ot

Market Profile Heat indicator — is a classic Market Profile implementation that can show the price density over time, outlining the most important price levels, value area, and control value of a given trading session.
This indicator can be attached to timeframes between M1 and D1 and will show the Market Profile for daily, weekly, monthly, or even intraday sessions. Lower timeframes offer higher precision. Higher timeframes are recommended for better visibility. It is also possible to use a fr

Better Risk Management. Smart Limit Order will replace your limit order with the correct lot size.
Input Variables : Risk — The risk calculation function calculates the volume for the limit order based on entry price & stop loss price. T he percentage amount that will be. lost if hit by a stop loss Reward1 — Risk Reward Ratio 1; Reward2 — Risk Reward Ratio 2, set value to 0 if not used; Reward3 — Risk Reward Ratio 3, set value to 0 if not used; Reward4 — Risk Reward Ratio 4, set value to

Gumper Options USES THE TREND WAVE INDICATOR AND IT CAN IDENTIFY THE BEGINNING AND THE END OF A NEW WAVE TREND MOVEMENT.
AS AN OSCILLATOR, THE INDICATOR IDENTIFIES THE OVERBOUGHT AND OVERSOLD ZONES.
IT WORKS GREAT TO CATCH THE SHORT TERM PRICE REVERSALS AND USES A MARTINGALE STRATEGY TO CLOSE ALL TRADES IN PROFIT.
USE DEFAULT SETTINGS ON H1 OR HIGHER TIME FRAME ON ANY PAIR FOR MORE ACCURATE TRADES
WHY THIS EA :
Smart entries calculated by 5 great strategies The EA can be run on even a $200

Description Helps you detect the structure of the market, using different types of Smart Money concepts. This should help you to upgrade your trading strategy in every way. MT5 Version Here Smart Money Features: Color candle to signal the type of structure Shows CHOCH and BOS Equal Lows and Highs Order Blocks Internal and Swings Weak and strongs high and lows Fair Value Gaps High and Lows in daily weekly and monthly timeframes Premium and discount Zones KEY LINKS: How to Install – Frequent

The liquidity swings indicator highlights swing areas with existent trading activity. The number of times price revisited a swing area is highlighted by a zone delimiting the swing areas. Additionally, the accumulated volume within swing areas is highlighted by labels on the chart. An option to filter out swing areas with volume/counts not reaching a user-set threshold is also included.
This indicator by its very nature is not real-time and is meant for descriptive analysis alongside other com

This indicator is based on the classical indicator Stochastic and will be helpful for those who love and know how to use not a visual but digital representation of the indicator. All TimeFrames RSI MT4 indicator shows values from each timeframe. You will be able to change the main input parameters for each RSI for every TF. Example for M1: sTF1_____ = "M1"; kPeriod1 = 5; dPeriod1 = 3; Slowing1 = 3; stMethod1 = MODE_SMA; Price_Field1 = MODE_MAIN; stMode1 = 0;
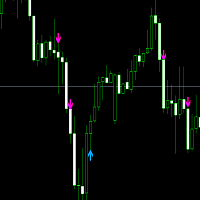
This offer is limited to a temporary period. Entry signal :follow the blue arrow for a buy trade and the Pink for a sell. Buy Trade: When the blue arrow appears, you wait until the candle completely finishes. Then you enter into a Buy Trade as soon as the next candle appears. Now wait until you hit TP1 from the Buy Goals box, then close the trade with a profit. Sell Trade: When the Pink arrow appears, you wait until the candle completely finishes Then you enter into a Buy Trade as soon as the
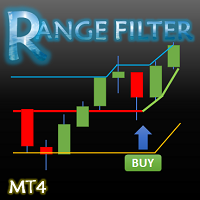
This indicator converted from 5 min Buy and Sell Range Filter - guikroth version on TradingView Popularity of the Range Filter
The Range Filter is a very popular and effective indicator in its own right, with adjustments to the few simple settings it is possible to use the Range Filter for helping filter price movement, whether helping to determine trend direction or ranges, to timing breakout or even reversal entries. Its practical versatility makes it ideal for integrating it's signals into a

ZIWOX TRADE LIST Description:
Feeling weary with your small screen? and you need to close your trade list tab to have a larger perspective of chart? Require better management of your trade list? such as win rate, risk/reward ratio? Its a simple tools, but usefull. consolidate your trade list, active positions, opened positions and pending orders onto a distinct chart embellished with refined visuals. It contains with a lots of usefull information.
Feautures: List your trades and positions sort
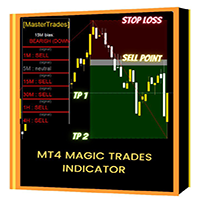
Introducing the "Magic Trades" for MetaTrader 4 – your ultimate tool for precision trading in dynamic markets. This innovative indicator revolutionizes the way you perceive market trends by harnessing the power of advanced analysis to detect subtle changes in character, paving the way for optimal trading opportunities.
The Magic Trades Indicator is designed to empower traders with insightful entry points and well-defined risk management levels. Through its sophisticated algorithm, this indicato

The Price Volume Trend Oscillator (PVTO) is a powerful technical analysis tool designed to provide insights into the relationship between price movements and trading volumes. This indicator offers a unique perspective on market trends, helping traders identify potential buying and selling opportunities. Parameters: EMA Short Period: Defines the short EMA period for calculating the PVTO. Default 3 EMA Long Period: Specifies the long EMA period for PVTO calculation. Default 10 EMA Signal Period: S
FREE
Just key in your equity target
step 1: drag/ Double click ''Auto Close EA for Prop Firm "
step 2: Allow modification of signals settings, Allow DLL imports, Allow import of external experts & Allow LiveTrading
step 3: Key in your equity target
step 4: Turn on AutoTrading
*you can add some buffer, example: 8% for 10,000 acc, key in 10805 / 10801 / 10810 and etc
"Disclaimer:
The information provided in this communication is for informational purposes only and does not constitute financial ad

Sale ends on 09/09/2023 Note: Trading is dangerous and you can lose all your money. This is a warning Good brevity makes sense .... It is a simple and smart expert that monitors the intraday market movements and enters with the market makers Recommendations Test with minimal risk first Use a VPS whose location is close to the server location of the broker you are working with. Use a leverage of 1:100 or more Use ECN Account + Stop Levels == 0 + Low spread + Low commission +

MT4 to Discord Signal Provider 是一款用户友好、完全可定制的工具,专为直接向 Discord 发送交易信号而设计。这个工具将您的交易账户转变为一个高效的信号提供者。 自定义消息格式以适应您的风格!为了方便使用,您可以从预先设计的模板中选择,并决定包括或排除哪些消息元素。 [ 演示 ] [ 手册 ] [ MT5 版本 ] [ Telegram 版本 ] New: [ Telegram To MT5 ]
设置 遵循我们详细的 用户指南 进行简单设置。 不需要预先了解 Discord API;我们提供所有必要工具。
主要特性 为订阅者更新自定义订单详情。 实施分层订阅模型,如铜牌、银牌、金牌,每一层都提供不同级别的信号访问。 附加执行订单的图表截图。 在这些截图上显示已关闭的订单,以增加清晰度。 提供延迟发送新订单消息的选项,以便在发送前进行最后调整。 透明和详细的订单信息: 带截图的新市场订单。 订单修改(止损、获利)。 已关闭和部分关闭的订单。 新的和修改的挂起订单。 挂起订单的激活和删除。 关于历史订单的详细报告。 每个订单的可定制评论。 注意: *

MyBTCUSD GRID EA 是 BTCUSD GRID EA 的免费版本 https://www.mql5.com/en/market/product/99513
MyBTCUSD GRID EA 是一个旨在使用网格交易策略的自动化程序
MyBTCUSD GRID EA 对于初学者和经验丰富的交易者都非常有用。虽然您可以使用其他类型的交易机器人,但网格交易策略的逻辑性质使加密货币网格交易机器人可以轻松地执行自动交易而不会出现问题。如果您想尝试网格交易机器人,MyBTCUSD GRID EA 是整体上最好的平台。
MyBTCUSD GRID EA 对于加密货币行业非常有效,因为即使在货币波动的情况下,它也能够以理想的价格点执行自动交易。 这种自动交易策略的主要目的是在 EA 内以预设的价格变动发出大量买卖订单。这种特殊的策略很容易实现自动化,因此通常用于加密货币交易。如果使用得当,网格交易策略可以让人们在资产价格变化时赚钱。事实证明网格交易策略是最有效的。由于加密货币价格的波动。
-------------------------------------------
FREE
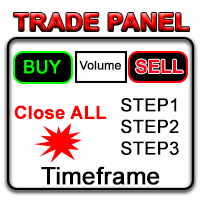
在金融市场领域,熟练的资本管理至关重要。它不仅仅是为了保护你的初始投资,还要增加它。手工计算的时代已经过去。最大化你的回报,最小化你的风险,以前所未有的方式释放金融市场的潜力。通过交易面板掌控你的交易旅程。 如果你是一名高频交易者,需要快速执行交易,我们的交易管理面板提供了所有必要的工具。通过简单点击“买入”或“卖出”按钮,设置固定的订单参数并迅速执行交易。你可以通过一个按键关闭所有头寸,或选择特定类型的挂单,或仅平仅盈利或亏损交易。 体验一种新的便捷、高效和盈利的水平。
如何使用Trade Panel MGH MT5 version
设施:
• 跟随止损 - 当你的交易获利时,程序会保护利润的另一部分
• 部分平仓 - 当价格向有利方向移动,你的交易达到更多中间目标时,程序会通过平仓来实现利润
• 保本 - 你的交易既不赚也不亏的点位
• 无风险 - 如果你选择了止损位为零,将是无风险的
• 3个精确的手数选项
• 在图表的角落看到有关TP、SL、买入盈利、卖出盈利、交易品种和时间框架的信息
• 一键下挂单
• 点数设定的获利

Silver Bullet EA 基于 ICT Silver Bullet 策略,这是一种经过验证的流行交易模型。使用特定的交易窗口,专家顾问将根据 ICT 教学自动为您输入交易。通过完全可定制的风险管理设置,您可以选择每笔交易愿意承担的风险,通过盈亏平衡触发器管理您的交易,甚至通过第二个止盈水平追逐更多利润。 常规设置: 设置每笔交易的风险百分比和 RR。 获利 2: 启用或禁用第二个止盈、您期望的 TP2 RR 以及以 TP1 平仓的交易百分比。 银弹会议: 独立启用或禁用每个 Silver Bullet 会话。根据您的经纪商时区设置时间窗口。 其他设置: 设置被视为有效的 FVG 最小大小,添加额外的喘息空间以止损,在 FVG 的第一根蜡烛处启用严格止损,实现盈亏平衡并设置整体变动的百分比以触发盈亏平衡。 **重要的** 由于 MQL5 不喜欢 EA 设置时间限制,因此默认情况下所有 Silver Bullet 周期均被禁用,在上线之前请确保启用这些窗口,否则 EA 将在每个 FVG 上进行交易。 请让我知道您想要设置文件的其他货币对/时间范围! 请告诉我您希望在此 EA 中看到

该程序将允许您使用非常友好的用户界面将所有交易从 MetaTrader 帐户直接导出到 Notion。 MT5版本 | 用户指南+演示 要开始使用,请使用用户指南并下载概念模板。 如果您想要演示,请参阅用户指南。 在策略测试器中不起作用! 主要特点 将所有交易从您的交易账户导出到您的 Notion 将运行交易和挂单导出到 Notion 并更新它们 创建模板 最后一日出口贸易 上周出口贸易 上个月出口贸易 从自定义时间范围导出交易 自动将所有新的已平仓交易发送至 Notion 选择要包含在导出中的字段,例如订单类型、数量、开仓时间、平仓时间等
如何开始 转到上面的用户指南或启动 EA 并单击“获取连接帮助” 连接后,单击“开始:导出全部”将历史记录中的所有当前交易发送到 Notion 如果您希望它自动将所有新的已平仓交易发送到 Notion,请选中“更新新已平仓交易”
如果您有任何问题,请告诉我。 随着产品的开发,将添加新功能。
介绍:
“Turning Zone”是一种复杂且创新的 MT4 指标,旨在为交易者提供强大的工具来检测金融市场中潜在的趋势逆转。通过利用干草叉分析的永恒概念,转向区域指标可以识别市场情绪可能发生变化的关键反转区域,为交易者提供宝贵的见解,以做出明智的决策。 MT5 版本 : WH Turning Zone MT5
相关产品 : WH Trend Continuation MT4
主要特征:
干草叉分析. 逆转概率. 视觉清晰度. 定制选项. 实时警报.
如何使用 :
选项 1:等待价格到达转向区域并使用您自己的入场规则、止损和目标上方/下方区域。
选项 2:等待我的入场规则形成(以红色/蓝色箭头指示)止损,并且目标出现在图表上。
利用转向区指标释放精确趋势反转检测的潜力并提升您的交易策略。通过利用干草叉分析的力量,体验交易决策的新水平的信心和准确性。立即下载 MT4 的转向区域指标,在瞬息万变的金融市场世界中获得竞争优势。

隆重推出 Zaap - MT4 经纪商监控工具! 使用 Metatrader 4 平台的交易者必备的经纪商监控工具来保护您的账户!
检测不值得信赖的经纪商并有效识别 MetaTrader 4 问题。 告别猜测并获得事实见解,以确保经纪人可靠。 Zaap 是一款专门为新手和经验丰富的交易者打造的工具,体现了用户友好性和高级功能的独特结合。 其主要目的是保护用户免受欺诈经纪人和技术故障的侵害,防止潜在损失。
主要特征:
可疑活动检测:Zaap 努力识别并通知用户各种可疑行为,包括: 重新报价 价格下滑 执行时间延迟 平均请求时间 保证金调整 交易期间异常点差 服务器断开连接 1. 详细报告: Zaap 生成综合报告,总结检测到的问题。 当您向经纪商解决有关任何可疑账户活动的疑虑时,这些报告是非常宝贵的工具。
2. 管理 Metatrader 4 日志 :Zaap 通过监控 Metatrader 4 日志来确保您计算机的安全。 它可以防止潜在的风险,例如失控的专家顾问消耗过多的存储空间并可能导致系统崩溃。
3. 冲突解决 :检测 Metatrader 4 实例(同时运行多个实例)

Parabolic EA:趋势驱动交易策略的巅峰! 主要规格: 最佳交易对:XAUUSD 推荐时间框架:30分钟和1小时(适用于更短时间间隔) 最低资金要求:$1,000 Parabolic EA:通过先进的趋势分析工具精确驱动!在我们的官方网站上进一步了解。 充满信心地操控市场波澜!使用Parabolic EA,一款强大的工具,精准地找出市场的高点和低点。 前沿市场趋势识别:我们的先进算法深入研究市场趋势。它识别关键的高点和低点,准确找出传统系统可能忽视的潜在趋势转变。 与移动平均线和相对强弱指数(RSI)同步:Parabolic EA巧妙地整合了移动平均线和RSI。这种组合能够过滤市场噪音,确保您与当前市场趋势保持一致。 卓越的预设设置:无论您是交易新手还是市场老手,我们的默认设置都经过优化,可在从5分钟到1小时的时间框架内提供出色的结果。 输入参数: 魔术编号: 198723(用于交易的唯一标识符) 下一次开仓交易间隔: 200(下一次开仓交易前的柱状图/蜡烛数量) 获利水平: $1,000(交易的获利水平) 止损水平: $5,000(交易的止损水平) 跟踪止损: 开启(跟踪起始
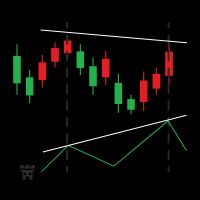
RSI 差异指标是一个强大的工具,设计用于通过发现相对强度指数(RSI)和价格运动之间的差异来识别市场中的潜在反转。差异可能是即将发生的趋势变化的重要指示,从看涨转为看跌或反之亦然。此指标的目的是使识别潜在交易机会的任务变得更简单和高效。 特点: 自动检测:指标扫描图表查找RSI差异并自动绘制箭头以指示潜在的交易机会。 买卖信号: 绿色向上箭头:基于看涨的RSI差异建议潜在的购买机会。 红色向下箭头:基于看跌的RSI差异建议潜在的销售机会。 差异强度识别:指标区分弱和强的差异,为交易者提供更细微的见解。 强烈的差异:由粗箭头表示。 微弱的差异:由更淡的箭头表示。 移动通知:内置的移动通知功能确保您即使在移动时也永远不会错过潜在的交易信号。一旦发现差异,指标会向您的移动设备发送推送通知。 自定义设置:用户可以调整RSI期间、超买和超卖水平以及其他设置,以根据其交易风格和偏好调整指标。 工作原理: 看涨差异(购买信号):当价格形成一个新的更低的低点,但RSI形成一个更高的低点时发生。这种差异可能表明潜在的上行反转。 看跌差异(卖出信号):当价格形成一个新的更高的高点,但RSI形成一个较低的
FREE

"无重绘"指标旨在分析市场动态并确定潜在的交易信号时机。该指标的主要特点是信号不会重绘,从而有助于更准确可靠地预测市场价格的变动。
操作机制: "无重绘"指标使用多种类型的图形元素来表示交易信号: 上箭头和下箭头:指标用上箭头和下箭头标记可能的市场入场点。上箭头表示可能开设多头头寸的可能性,而下箭头表示空头头寸。 线条:该指标还在图表上绘制线条,表示从上一个箭头到当前箭头的点数距离。这有助于评估价格运动的强度和交易的潜在盈利能力。
交易建议: "无重绘"指标可用于基于以下原则确定市场入场点: 上箭头和下箭头:出现上箭头可能表示可能开设多头头寸的可能性,建议通过其他技术指标或趋势分析来确认信号。同样,下箭头可能表示可能开设空头头寸的可能性。 线条:分析从上一个箭头到当前箭头的点数距离有助于评估价格运动的强度和交易的潜在盈利能力。箭头之间的显著距离可能表示强劲的运动,需要更谨慎的入场。
设置: Wavelength :该参数确定计算指标敏感性的波长。默认值为25。

Forex Calculator is a must-have program for every trader. This script allows you to calculate the percentage% risk of a deposit depending on the set Stop Loss in pips. The advantages of the script: You always know exactly what you are risking in every trade The calculator takes into account the contract specification Only 2 columns for data entry risk and Stop Loss size in pips Recommended Robot Scalper - https://www.mql5.com/en/market/product/77108
Options Risk_in_% – the percentage of
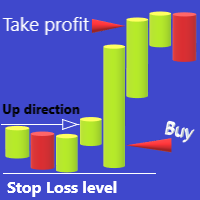
The Expert Advisor is designed for Forex trading as part of intraday trading. The adviser determines the main movement of the day up or down and opens positions according to the specified parameters. In the settings, you can set the average range of the day (you can see it using the ATR D1 indicator), lot, time and position opening level, as well as the take profit level. This Expert Advisor will greatly facilitate your trading if you open positions that are traded during the trading day. Expert


The initial price is 150 USD, the future price is 250 USD
Smart Neuro Trade Robot - The EA does not use the usual strategies for trading. The EA traps the price, gradually adding it up from orders opened using a safe and profitable strategy. He does not use dangerous strategies like martingale and its varieties. In whatever direction the market moves, the adviser will in any case close a series of orders in plus, because he will open deals in both directions and when he gets a profit he

for xau/usd marthingale expert adviser.
・The initial lot is carefully selected for both buying and selling. ・When there is a large price movement, or there is a trend, we do not have a new position. ・Nanping also does not have a new positions when there is a trend or there is a sudden change (when it rises or falls). ・Separately setting for buying and selling can use,(for example Nanpin ratio, Nanpin Interval, Nanpin Interval_add,and profit take method.) «two type of profit take method» 1) s
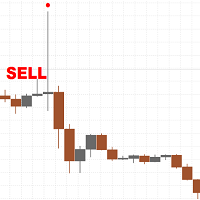
There are only a limited number of copies left, priced at 39 USD . After that, the price will be raised to 100 USD. The classic and most powerful price action pattern is called the pin bar. This pattern works well after the release of fundamental news on M15, M30 and H1 timeframes, but can also be used on other timeframes such as M5 or D1. By default, the settings are set for the H1 timeframe, but you can always adjust for other timeframes. Description of settings: % Pin Bar Size Volatility

The presented indicator marks signals on the price chart with arrows in accordance with the data of the Hull Momentum AM indicator. The indicator gives a signal and sends a notification to the mobile terminal and email. The indicator is part of a series of indicators - Hull Line AM, Hull Momentum AM, Hull Candles AM, Hull Signal AM . For a better understanding of the operation of each of the indicators, it is recommended to start working with them by using them together on one chart. The Hull M
FREE

This indicator is a moving average built according to the method proposed by Alan Hull. The indicator is part of a series of indicators - Hull Line AM, Hull Momentum AM, Hull Candles AM, Hull Signal AM . The indicator has minimal lag and allows you to effectively follow the trend direction. The indicator is not redrawn on fully formed bars. The indicator is supplemented with signals and notifications to the terminal and e-mail.
The application of the indicator is identical to the application o
FREE

This indicator is an oscillator built on the principle of the classic Momentum. The indicator is part of a series of indicators - Hull Line AM, Hull Momentum AM, Hull Candles AM, Hull Signal AM . The indicator represents the difference between the current price and the price some number of periods ago. The difference from the classic indicator Momentum is the preliminary smoothing of prices according to the method proposed by Alan Hull.
Using the indicator: It should be taken into account that
FREE
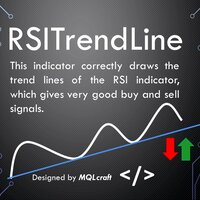
RSI Trend Lines Indicator - Identify Optimal Buying and Selling Opportunities Introduction :
The RSI Trend Lines Indicator is a powerful tool designed to assist traders in identifying optimal buying and selling opportunities based on the Relative Strength Index (RSI) oscillator. This advanced indicator draws trend lines on the RSI chart using multiple points, providing valuable insights into potential market trends and reversals. By leveraging the RSI Trend Lines Indicator, traders can enhance t
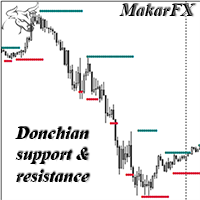
Support and resistance level indicator based on the Donchian channel. The most famous example of trading through the Donchian channel is an experiment with a group of turtles, who earned one hundred and twenty-five million dollars in five years. This indicator can be used as a standalone tool, as well as an additional confirmation. There is MTF, NRP. There are color and thickness settings.
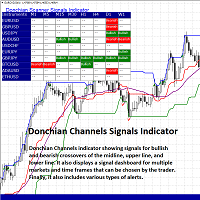
The Donchian Scanner Signals Indicator with is a powerful tool designed for traders operating in the financial market using the Metatrader 4 platform. This indicator combines the popular Donchian Channels strategy with advanced signalization and real-time alert features, providing a clear view of potential entry and exit points in a financial asset. Key Features: Donchian Channels Visualization: The indicator graphically displays Donchian Channels on the price chart. These channels are formed us
The trading advisor trades with money management elements, both using the martingale system and using the anti-martingale system, at the user's choice. You can choose the type of money management system in external variables. (Usage options with money management according to Martin or AntiMartin) Opens starting positions on the RSI indicator, after exiting the position on the take profit, increases the lot by the AntiMartin coefficient, again we enter the market on the RSI indicator. With Marti
This is a dashboard indicator that displays the Average Level of each selected currency pairs that filters and gives us a signal for overbought (>=90%) or if price at extreme peak above 90, and/or oversold (<=10%) or if price at extreme peak below 10.
The calculation is using Relative Strength Index default periods (2 & 9) applied to three different higher time frames H4,D1,&W1.
This won't change or altered even if you change symbol or switch to lower time frames or even in monthly and year

An MT4 Expert advisor for finding Break-Even point of open position, especially grid or hedge orders. also, you can close all open orders, or delete all pending orders , and set your desire Take Profit how far from Break Even point. All traders that using Grid strategy, or Hedge strategy should use this ea. it shows you break-even point by drawing a line and also automatically set your Take profit and stop loss.

Торговый робот предназначен для торговли криптовалютой по уровням Фибоначчи на рынке Форекс. Безопасность в торговле: постоянный стоплосс, тейкпрофит, защита от повышенного спреда, а лгоритм не использует опасные методы торговли - мартингейл, сетку и усреднение . Достоинством советника является торговля Мани Менеджмент (система управления капиталом) автоматический расчет лота на основе размера вашего депозита, автоматическая установка и перемещение уровней Фибоначчи. Установка отложенных ордеров
FREE
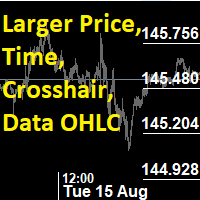
This utility indicator provides accessibility and readability, by displaying a larger price scale, time scale, crosshair, and symbol name/tf/ohlc information. All features are sizeable and can be styled separately, and are optional to show.
All Features optional to use font, size and color options
Price Scale
option to hide the default MT4 price scale option to show horizontal lines at price levels prices drawn can be at round numbers (ie automatic rounding to multiples of 5/10/20/25 points),
FREE
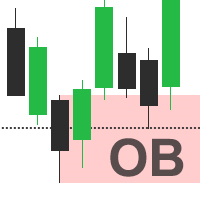
Automatically detect bullish or bearish order blocks to optimize your trade entries with our powerful indicator. Ideal for traders following ICT (The Inner Circle Trader). Works with any asset type, including cryptocurrencies, stocks, and forex. Displays order blocks on multiple timeframes, from M2 to W1. Alerts you when an order block is detected, migrated, or a higher timeframe order block is created/migrated. Perfect for both scalping and swing trading in Smart Money Concepts. Enhanced by st
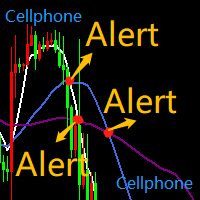
SMA5_SMA10_SMA55三均线系统,均线相互交叉,发送通知到手机 MT4 APP, 同时电脑桌面客户端也会发出警报通知。 注意:这个EA不会帮你下单交易,只会在均线交叉,即关键位置转向的时候给你发出警告,特别是手机通知,方便没时间盯盘的交易员放心出门,同时不会错过关键位置的转向,收到通知,打开手机APP就能处理头寸。是否变动头寸仓位,依然是要由自己判断。 均线的交叉往往意味着趋势的转向和启动,震荡的关键位置,请结合自我经验,以及趋势位置形态,多方位判断操作。 比如: MA5从下往上穿插MA10,则会向手机MT4 APP发出通知,提示多头有启动迹象,若有空单在手提示减仓。 MA5从上往下穿插MA10,则会向手机MT4 APP发出通知,提示空头有启动迹象,若有多单在手提示减仓。 -- MA10从下往上穿插MA55,则会向手机MT4 APP发出通知,提示多头启动,若有空单在手必须清仓,并且开多头。 MA10从上往下穿插MA55,则会向手机MT4 APP发出通知,提示空头启动,若有多单在手必须清仓,并且开空头。 -- MA5穿插MA55同理 -- 预祝:交易之路长虹! SMA5_SMA

Stochastic Scanner is a multi symbol multi timeframe Stochastic dashboard that monitors the indicator for price entering and exiting overbought and oversold in up to 28 symbols and 9 timeframes.
Download Demo here (Scans only M1 and W1) Settings description here MT5 version here
Stochastic Scanner features: Signals price entering and exiting the overbought and oversold zones. Monitors up to 28 customizable instruments and 9 timeframes at the same time. You can choose between 3 alert mode

Tailored for traders with smaller accounts, this EA offers an opportunity to witness prudent profits while maintaining a cautious and controlled trading strategy. Chart Timeframe: 5-Minute
Market: EUR/USD
Trading Days: Monday to Friday Key Features: Profitable and Responsible: The "Dollar Trader" EA brings you the best of both worlds – profitability and risk management. Its algorithm strikes a fine balance between seizing opportunities and protecting your investment, ensuring that you can experi

Простой и удобный индикатор, указывающий зоны стандартных индикаторов в различных таймфреймах, при необходимости можете в настройках изменить параметры RSI- Relative strength index. Стрелка вверх- если сигнальная линия ниже уровня 300, стрелка вниз- если сигнальная линия выше уровня 70 STOCH- Stochastic. Стрелка вверх- если сигнальная линия ниже уровня 20, стрелка вниз- если сигнальная линия выше уровня 80 ENVELOPE - Envelopes. Стрелка вверх- если свеча открылась ниже красной линии индика
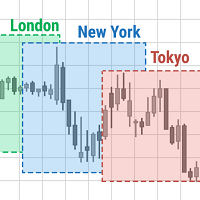
This indicator shows when user set sessions are active and returns various tools + metrics using the closing price within active sessions as an input. Users have the option to change up to 4 session times.
The indicator will increasingly lack accuracy when the chart timeframe is higher than 1 hour.
Settings
Sessions
Enable Session: Allows to enable or disable all associated elements with a specific user set session.
Session Time: Opening and closing times of the user set session in the

Introducing the TPS Pair Hedging EA – Your Ultimate Solution for Precise Pair Trading Strategies! Are you seeking to navigate the intricate world of forex pair trading with finesse and efficiency? Look no further than the TPS Pair Hedging EA, your advanced trading companion designed to excel in dynamic market conditions. The TPS Pair Hedging EA empowers traders with a cutting-edge algorithm that seamlessly identifies and capitalizes on correlated movements within currency pairs. Through intellig

Anubis Skunk USES THE TREND WAVE INDICATOR AND IT CAN IDENTIFY THE BEGINNING AND THE END OF A NEW WAVE TREND MOVEMENT.
AS AN OSCILLATOR, THE INDICATOR IDENTIFIES THE OVERBOUGHT AND OVERSOLD ZONES.
IT WORKS GREAT TO CATCH THE SHORT TERM PRICE REVERSALS AND USES A MARTINGALE STRATEGY TO CLOSE ALL TRADES IN PROFIT.
USE DEFAULT SETTINGS ON H1 OR HIGHER TIME FRAME ON ANY PAIR FOR MORE ACCURATE TRADES
WHY THIS EA :
Smart entries calculated by 5 great strategies The EA can be run on even a $20000

Gold Standard USES THE TREND WAVE INDICATOR AND IT CAN IDENTIFY THE BEGINNING AND THE END OF A NEW WAVE TREND MOVEMENT.
AS AN OSCILLATOR, THE INDICATOR IDENTIFIES THE OVERBOUGHT AND OVERSOLD ZONES.
IT WORKS GREAT TO CATCH THE SHORT TERM PRICE REVERSALS AND USES A MARTINGALE STRATEGY TO CLOSE ALL TRADES IN PROFIT.
USE DEFAULT SETTINGS ON H1 OR HIGHER TIME FRAME ON ANY PAIR FOR MORE ACCURATE TRADES
WHY THIS EA :
Smart entries calculated by 5 great strategies The EA can be run on even a $200

Goldmine Ventures USES THE TREND WAVE INDICATOR AND IT CAN IDENTIFY THE BEGINNING AND THE END OF A NEW WAVE TREND MOVEMENT.
AS AN OSCILLATOR, THE INDICATOR IDENTIFIES THE OVERBOUGHT AND OVERSOLD ZONES.
IT WORKS GREAT TO CATCH THE SHORT TERM PRICE REVERSALS AND USES A MARTINGALE STRATEGY TO CLOSE ALL TRADES IN PROFIT.
USE DEFAULT SETTINGS ON M15 OR HIGHER TIME FRAME ON ANY PAIR FOR MORE ACCURATE TRADES
WHY THIS EA :
Smart entries calculated by 5 great strategies The EA can be run on even a

ROYAL DUTCH SKUNK USES THE TREND WAVE INDICATOR AND IT CAN IDENTIFY THE BEGINNING AND THE END OF A NEW WAVE TREND MOVEMENT. AS AN OSCILLATOR, THE INDICATOR IDENTIFIES THE OVERBOUGHT AND OVERSOLD ZONES. IT WORKS GREAT TO CATCH THE SHORT TERM PRICE REVERSALS AND USES A MARTINGALE STRATEGY TO CLOSE ALL TRADES IN PROFIT. USE DEFAULT SETTINGS ON H1 OR HIGHER TIME FRAME ON ANY PAIR FOR MORE ACCURATE TRADES WHY THIS EA : Smart entries calculated by 6 great strategies The EA can be run on even a $20000

Gold Whiskers USES THE TREND WAVE INDICATOR AND IT CAN IDENTIFY THE BEGINNING AND THE END OF A NEW WAVE TREND MOVEMENT. AS AN OSCILLATOR, THE INDICATOR IDENTIFIES THE OVERBOUGHT AND OVERSOLD ZONES. IT WORKS GREAT TO CATCH THE SHORT TERM PRICE REVERSALS AND USES A MARTINGALE STRATEGY TO CLOSE ALL TRADES IN PROFIT. USE DEFAULT SETTINGS ON H1 OR HIGHER TIME FRAME ON ANY PAIR FOR MORE ACCURATE TRADES WHY THIS EA : Smart entries calculated by 6 great strategies The EA can be run on even a $20000 acc
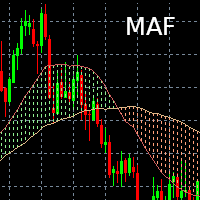
Indicateur Moving Average Filling Affiche deux moyennes mobiles (une courte et une longue) dont la durée et le type (Simple, exponentielle) est paramétrable. L'espace entre les deux moyennes mobiles est alors colorié (rempli) :
- Vert si courte > longue
- Rouge si courte < longue Il est possible de changer les couleurs selon les préférences de chacun / chacune.

Maximo Bull Skunk USES THE TREND WAVE INDICATOR AND IT CAN IDENTIFY THE BEGINNING AND THE END OF A NEW WAVE TREND MOVEMENT. AS AN OSCILLATOR, THE INDICATOR IDENTIFIES THE OVERBOUGHT AND OVERSOLD ZONES. IT WORKS GREAT TO CATCH THE SHORT TERM PRICE REVERSALS AND USES A MARTINGALE STRATEGY TO CLOSE ALL TRADES IN PROFIT. USE DEFAULT SETTINGS ON H1 OR HIGHER TIME FRAME ON ANY PAIR FOR MORE ACCURATE TRADES WHY THIS EA : Smart entries calculated by 6 great strategies The EA can be run on even a $20000

Note: After installation, please go to Tools>Options>Expert Advisors and add https://porsaj.com to 'Allow WebRequest for listed URL'. Still Problem?! Please check Internet connection!
Unveiling the Porsaj Scalper: Your Cutting-Edge MetaTrader 4 Utility for Precision Scalping Are you ready to take your forex trading to the next level? Look no further than the revolutionary Porsaj Scalper – a MetaTrader 4 utility designed to empower scalpers with the tools they need to thrive in the fast-pac

This is MT4 Trade panel manager which use Automatic and Manual mode which can be selected in settings. With this you can determine how much can you profit from each trade and what is the profit to risk ratio? Before you set the lot size, you need to do the necessary calculations to get an answer to the question of what the lot size should be. This is based on RSI Signal and Candlesticks to determine volume currency strength and indicate the amount of percentage. Blue % is for buy trades and red

Maximo Momentum USES THE TREND WAVE INDICATOR AND IT CAN IDENTIFY THE BEGINNING AND THE END OF A NEW WAVE TREND MOVEMENT. AS AN OSCILLATOR, THE INDICATOR IDENTIFIES THE OVERBOUGHT AND OVERSOLD ZONES. IT WORKS GREAT TO CATCH THE SHORT TERM PRICE REVERSALS AND USES A MARTINGALE STRATEGY TO CLOSE ALL TRADES IN PROFIT. USE DEFAULT SETTINGS ON H1 OR HIGHER TIME FRAME ON ANY PAIR FOR MORE ACCURATE TRADES WHY THIS EA : Smart entries calculated by 6 great strategies The EA can be run on even a $20000 a

This is a dashboard indicator that displays the auto-calculated risk lot, with the given risk percentage & risk points (Stop Loss) and others. The main function of this indicator is to help you calculate your exact scalping risk lots and swing risk lots. Also it displays the active trades of each pair you've executed with the following: type of trade, lot size, symbol, & equity(+/-). Also displays the bar counter set in every 5-minute bar timer. (whichever time frame you're active, the bar time

你是否曾 经想过为什么大多数专家顾问在实盘交易中并不有效,尽管它们在回测中表现完美? 最有可能的答案是过拟合。许多专家顾问被创建为对现有的历史数据进行“学习”和完美适应,但由于构建模型的泛化能力不足,它们无法预测未来。 一些开 发者可能根本不知道过拟合的存在,或者他们知道但没有办法防止它。其他人则将其作为美化回测结果的工具,他们添加了数十个输入参数,而不考虑统计学意义,使交易策略过度依赖历史数据,并试图说服他人他们的专家顾问未来能够实现类似的表现。 如果你 对这个迷人的主题感兴趣,并想更深入地了解过拟合,请参考我的这些文章: Avoiding Over-fitting in Trading Strategy (Part 1): Identifying the Signs and Causes Avoiding Over-fitting in Trading Strategy (Part 2): A Guide to Building Optimization Processes 有几种方法可以避免在 仅仅依赖读取过去数据的专家顾问上亏钱。而最简单的方法是,在没有至少 5 个月或 30
介绍二元智能系统:您的终极交易伴侣 二元智能系统不仅仅是一个指标,它是一个精心设计的复杂交易工具,为交易者提供精确的交易信号和市场洞察。该系统建立在先进的算法和广泛的技术指标基础上,是您解锁交易成功的关键。 指标组件: 移动平均百分比(MAP): 该组件计算多个移动平均线的加权平均值,为趋势识别提供强大的基础。MAP会根据市场条件动态调整,提供有关当前趋势方向的见解。 商品通道指标(CCI): CCI通过分析价格偏离平均值来衡量超买和超卖情况。二元智能系统的CCI集成确保了从整体上识别潜在的反转点。 移动平均线收敛/发散(MACD): 系统中的MACD组件超越了简单的价格交叉。它评估MACD线和信号线的收敛和发散,揭示隐藏的交易机会并确认趋势强度。 平均方向指数(ADX): 使用ADX,二元智能系统量化趋势动量。它可以准确地识别强劲的趋势并帮助您避免弱势、不确定的市场阶段,从而增强您的交易决策。 多空力量: 通过这些指标,可以利用多空情绪的综合力量。这对市场情绪的全面了解有助于进行明智的交易入场。 随机指标: 二元智能系统中的随机指标有助于识别超买和超卖情况,并

完整的 STO 指标(包括三个 STO 指标的所有版本:高级版、黄金版、白银版) - STABLE TRADE OPTION 专为自动二元期权交易而设计。 请仔细阅读!!!!!
重要事项 在一个终端中创建两个不同到期时间的模板,一个为 18:01、18:02,到期时间为 1 至 15 分钟的模板,另一个为 22:00,到期时间为 10 至 20 分钟的模板。 胜率:过去 5 年为 71
资金管理:存款的 0.3
此版本的指标仅用于莫斯科时间 18:01、18:02、22:00 的交易,白银和黄金的到期时间为 1 至 15 分钟,高级版本的到期时间为 10 至 20 分钟。信号出现在蜡烛内部并立即打开交易,如果您使用连接器,则在蜡烛内部打开一个标记。
该指标配置齐全,您无需自行更改。安装并交易
请勿在未经任何检查和测试的情况下购买该指标,我花了两年多时间在真实账户上检查所有版本的sto并查看结果。经过多年测试,我们选择了最佳参数。
应用算法 1. 将指标安装到信号顾问中,信号顾问会自动向经纪商平台发送信号。
- mt2trading.com 平台将为此提供帮助

Golden Rush EA,又名Gold Prime - 精密强大的交易卓越性 - 从2023年5月开始,实现了1,000美元的实盘账户244%的增长。如下图所示。 介绍Golden Rush EA-一种为要求最佳的交易者构建的先进交易算法。无论您是在市场上进行超短线交易还是进行日内交易,都可以确保该EA经过精心设计,以实现最佳性能。 以下是Golden Rush EA的亮点: 时间框架-1M,5M,15M,30M,1H 最低账户余额要求:1,000美元 设置文件在评论部分提供 恢复网格系统:内置的网格模式确保强大的恢复策略,降低风险并增强交易弹性。 战略例程:既适用于超短线交易,又适用于日内交易,确保灵活性,以匹配您的交易风格。 信号精确性:利用移动平均线来精确定位买入/卖出点,然后利用布林带和RSI的力量来优化信号并确定退出策略。结果是一个无缝的交易体验,降低市场噪音。 四重扫描仪优势:借助其四个专用分析波动性、交易量和市场情绪的扫描仪,该EA可以剔除市场杂音,实现高准确度交易。 安全协议:坚实的止损机制,结合战略性的盈利和追踪止损功能,为您的交易提供了额外的安全层。 自豪地呈
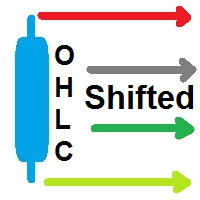
前一交易日的收盘价与K线位移 MetaTrader! 前一交易日的收盘价与K线位移指标是一种旨在改善技术分析和交易决策的工具。借助该指标,您可以获取有关任何K线的开盘价、最高价、最低价和收盘价的详细信息,从而实现对市场走势的精确和全面分析。 想象一下,您可以将一个时间框架放置在另一个时间框架之内,以便在当前时间框架内详细分析每根K线。通过前一交易日的收盘价与K线位移指标,您可以轻松实现这一令人难以置信的功能! 前一交易日的收盘价作为支撑位和阻力位的重要性已经得到交易者社区的广泛认可。现在,通过这个工具,您可以清晰准确地看到价格在前一收盘价停止的水平,为您的买卖决策提供宝贵的见解。 将该指标应用于您的图表上后,您将立即获得前一交易日的开盘价、最高价、最低价和收盘价等关键信息,以视觉上引人注目的方式突出显示。此外,您还可以调整K线的位移,使您能够在当前时间框架内分析MetaTrader的任何时间框架的数据。 这个独特的功能将使您能够根据所选时间框架中前一交易日收盘价提供的支撑位和阻力位,识别基于任何所需时间框架的蜡烛图形态,开启新的交易机会,并增加您的成功机会。您可以基于前一交易日的收盘价
FREE

隆重推出 PivotXpert ,这是一种先进的 多图表 指标,旨在增强您的枢轴点策略。直观的界面让枢轴交易变得轻而易举,轻松释放其潜力。
PivotXpert 的多图表模式通过在所有打开的图表上绘制枢轴线来简化您的交易。使用CalculatePips 功能轻松计算每个级别的剩余点数,轻松微调您的策略。
使用枢轴时间范围定制您的方法,使您的策略与您首选的时间范围保持一致。通过 ATR 参数更深入地了解市场波动性,叠加 ATR 水平以获得更清晰的视图。
使用警报过滤器保持警惕,确保您不会错过任何机会。 PivotXpert 使您能够优化策略并保持领先趋势。使用 PivotXpert 提升您的枢轴交易。
参数 模式 - 在多图表和单图表使用之间进行选择。 枢轴点参数 - 针对特定条件自定义枢轴点指示器。 ATR 参数 - 针对特定条件自定义 ATR 指标。 警报过滤器 - 自定义特定条件的警报。 图形参数 - 自定义视觉外观和颜色。

欢迎使用高级加特利模式识别指标 该指标根据价格结构的 HH 和 LL 以及斐波那契水平检测加特利模式,当满足某些斐波那契水平时,指标将在图表上显示该模式。 MT5版本: WH Advanced Gartley Pattern MT5
**该指标是 组合 的一部分 WH Ultimate Harmonic Patterns MT4 ,其中包括所有模式识别。** 特征 : 用于检测 Gartley 模式的高级算法 准确性 。 非常 快速地 和 低的 资源(对机器要求较低)。 不 落后 也不 重新粉刷 。 风俗 Fib 水平 调整(您可以根据您的首选设置更改斐波那契水平)。 展示 看跌 和 看涨 同时模式(能够显示看跌或看涨设置的多种模式)。 展示 贸易水平 线(带有可调节的停止点以及目标 1 和目标 2)。 适用于任何 象征 和任何 时间范围 。 更多的 特征 未来还会来! 参数:
最大条数 - 选择要回顾的最大条数。 XlegBar深度 - 调整 HH 和 LL 深
FREE
MetaTrader 市场 - 在您的交易程序端可以直接使用为交易者提供的自动交易和技术指标。
MQL5.community 支付系统 提供给MQL5.com 网站所有已注册用户用于MetaTrade服务方面的事务。您可以使用WebMoney,PayPal 或银行卡进行存取款。
