FxBears Super

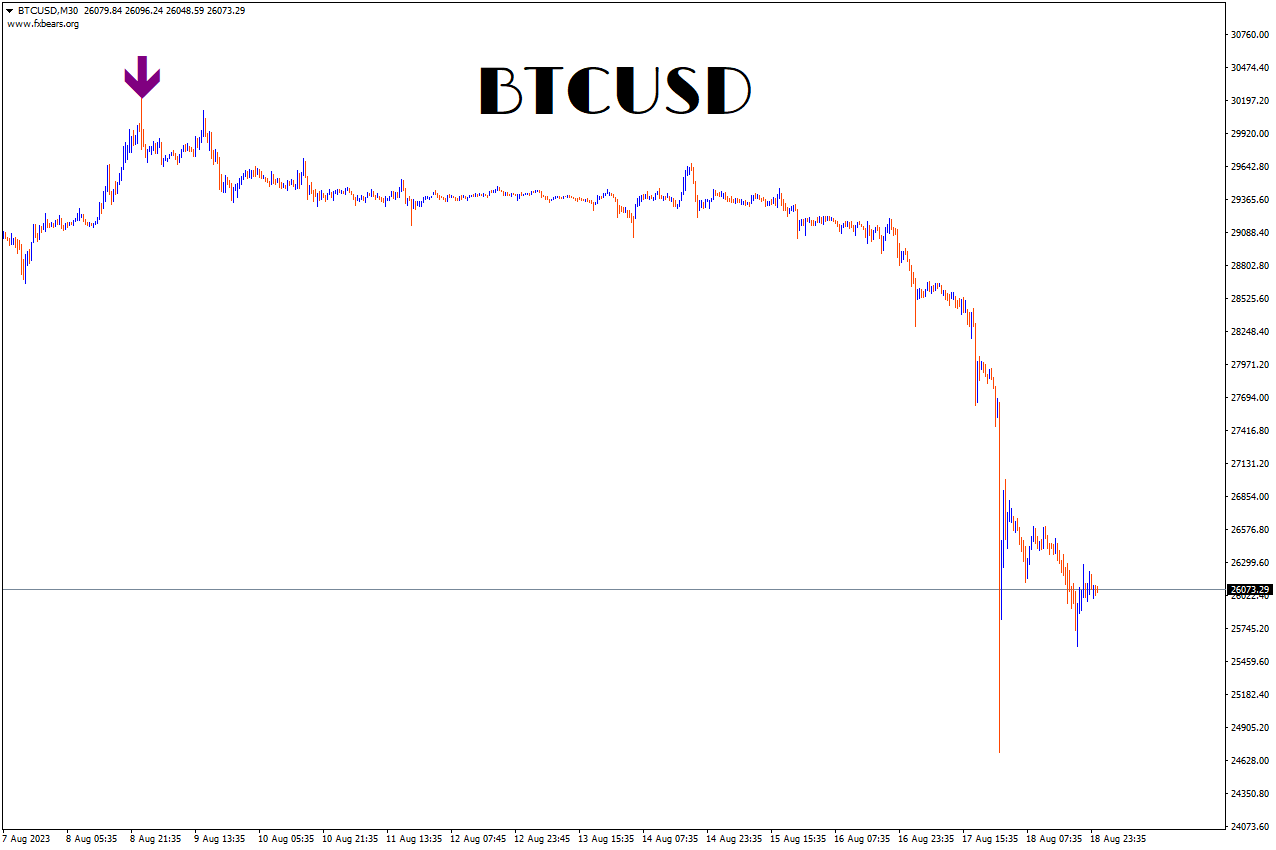
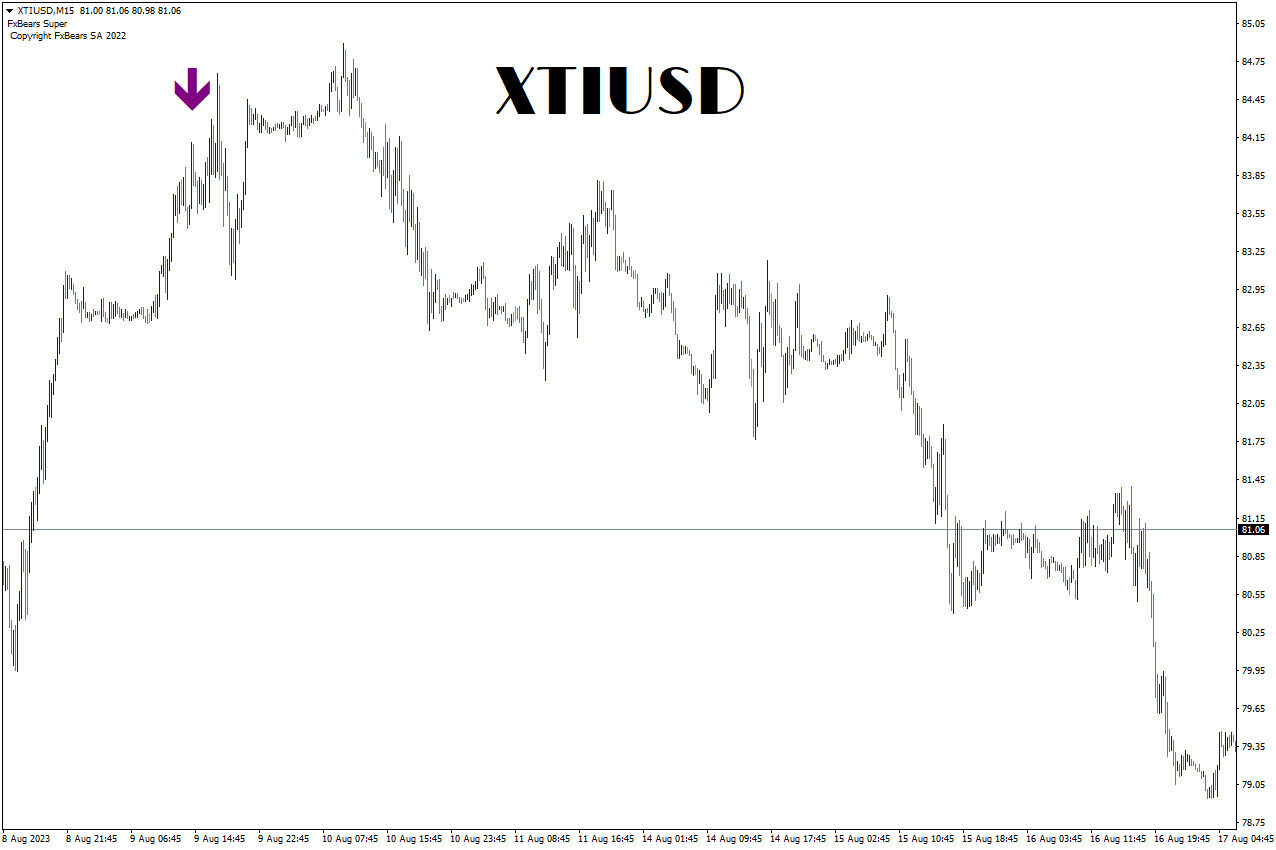
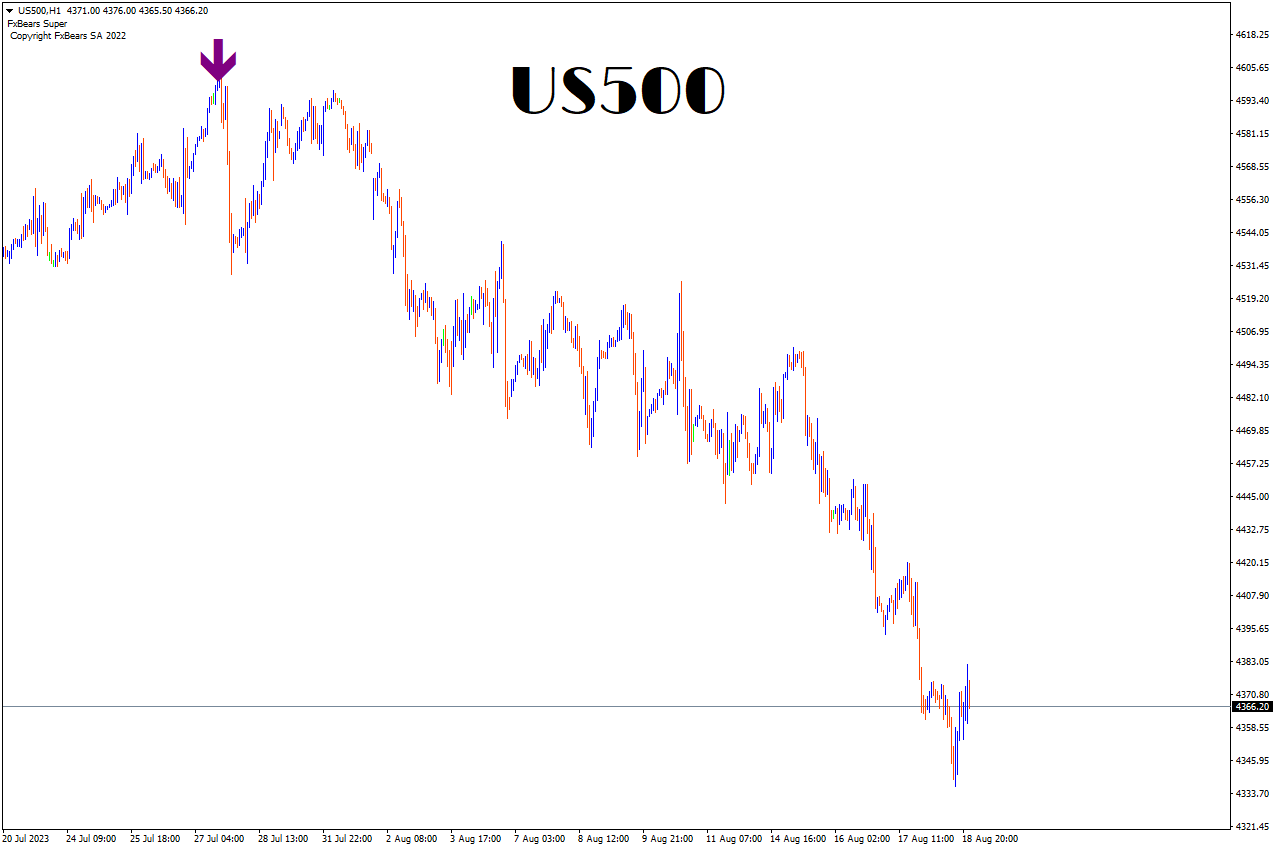
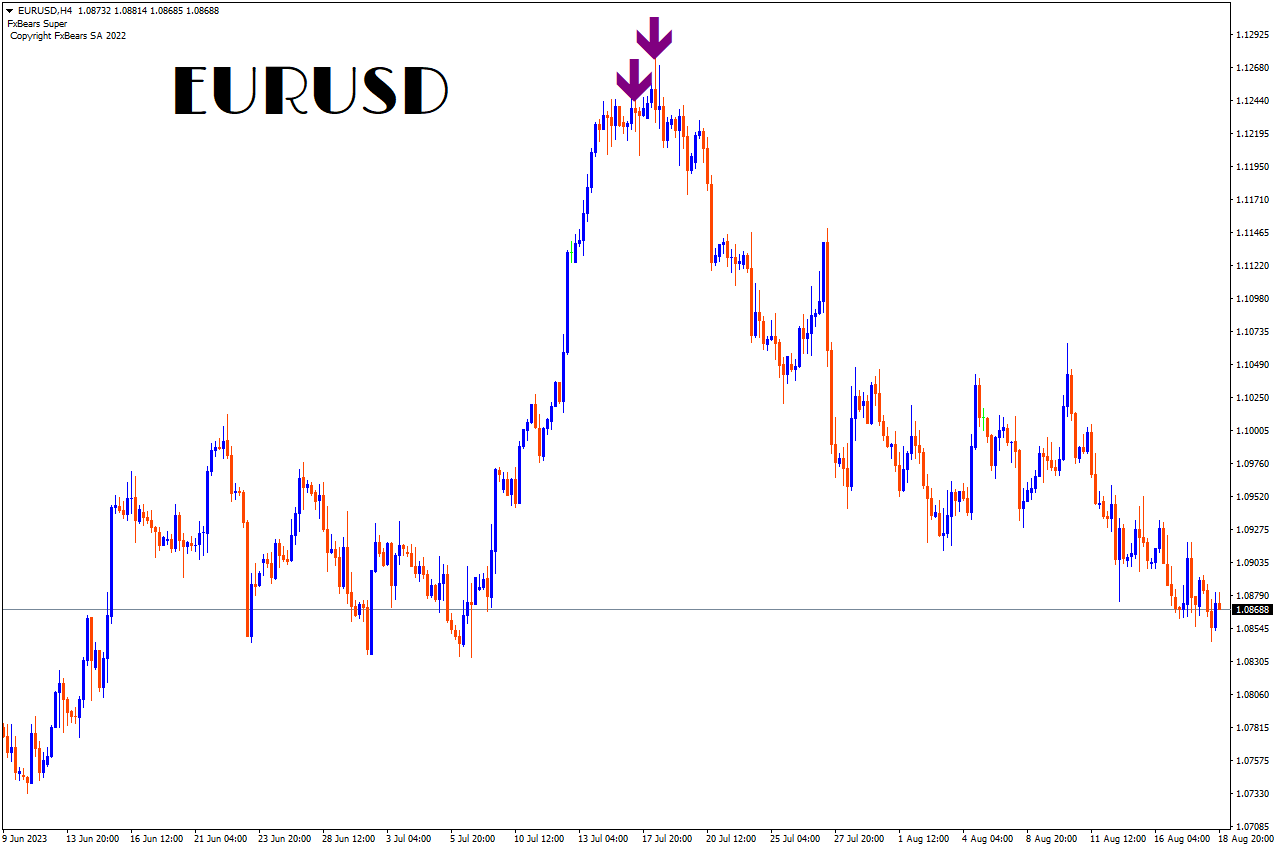
欢迎来到使用 FxBears 超级交易指标的高级交易世界。 这一创新工具专为 MT4 平台设计,结合了艾略特波浪、供需区域和内部指标的强大功能,为交易者提供高质量的信号,以做出明智的交易决策。 FxBears Super 拥有超过 90% 的成功率记录,为您的交易策略带来了新的精确度和盈利水平。 科西嘉岛没有重画,也没有重画。
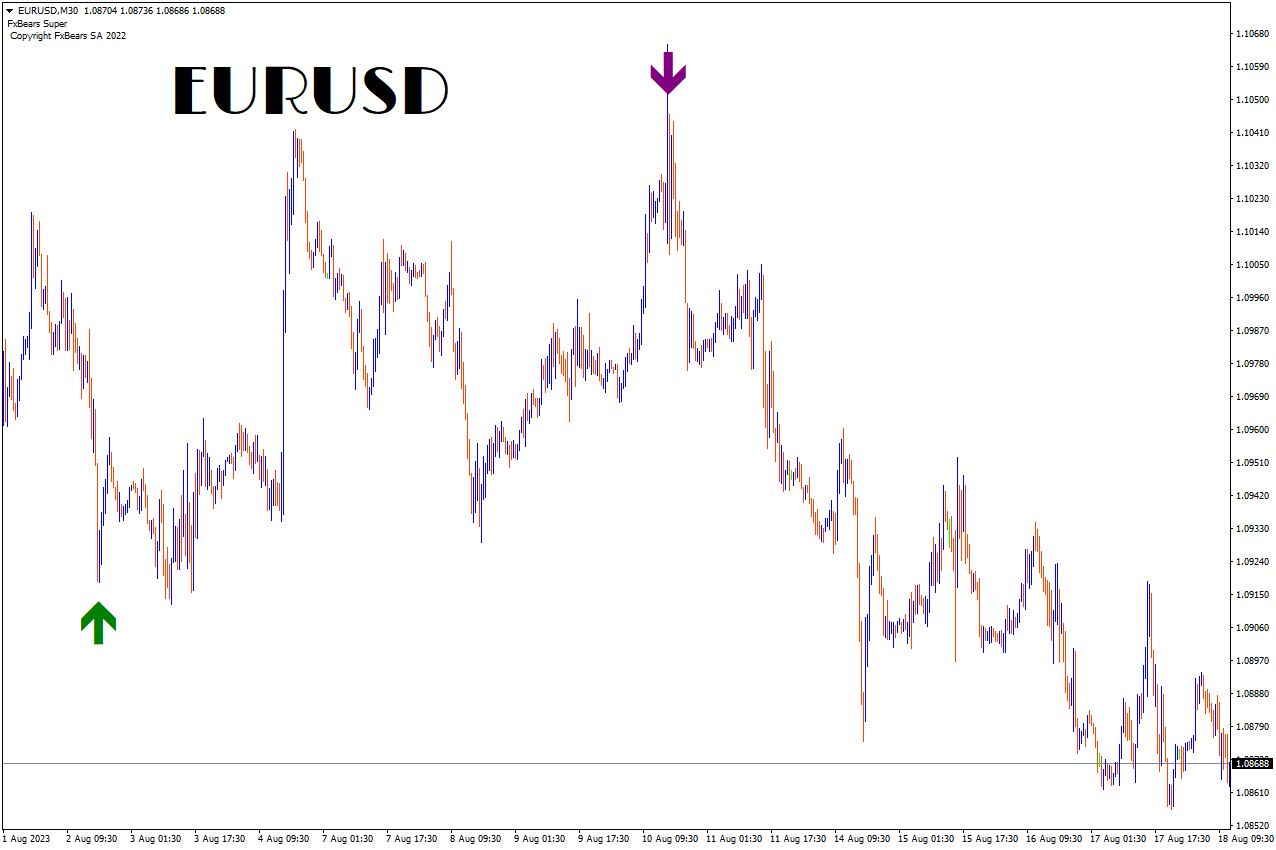

艾略特波浪分析:
     FxBears Super 利用艾略特波浪的预测潜力,识别市场周期和趋势。 通过分析特征五浪脉冲和三浪调整形态,准确提取潜在的转折点和延续形态。
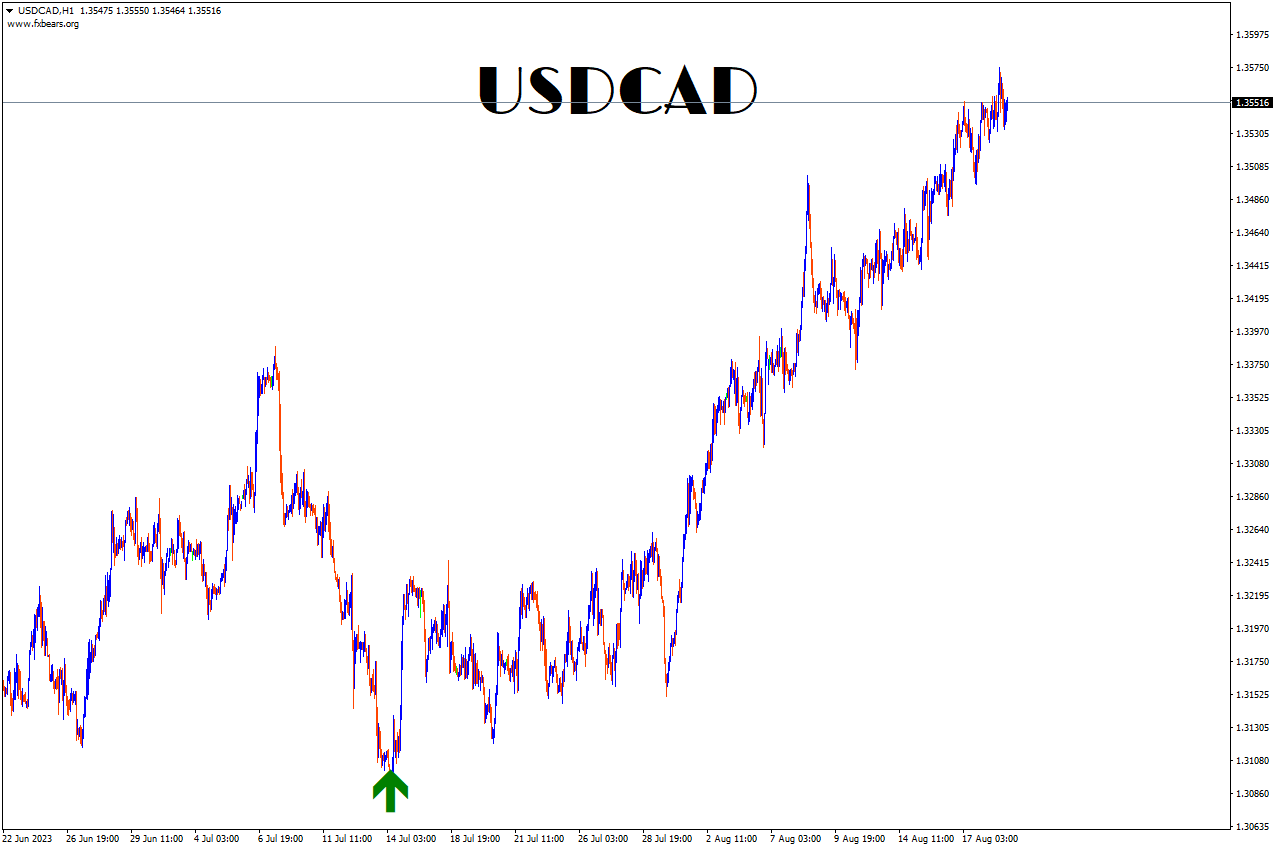
供需区:
     认识到供需区域的重要性,FxBears Super 在图表上精确指出了关键支撑位和阻力位。 这些市场情绪发生变化的区域为潜在的价格逆转和突破提供了宝贵的见解。

内部指标:
        FxBears Super 集成了一套内部指标,进一步提高其准确性:

   **RSI(相对强弱指数):衡量超买和超卖状况,有助于发现潜在的趋势逆转。

   **移动平均线:识别短期和长期趋势,而交叉线则提供潜在进入和退出点的信号。

   **MACD(移动平均收敛分歧):突出动量变化,与艾略特波浪分析保持一致,以获得更可靠的信号。

   **成交量分析:评估价格变动的强度,确认信号并增强您的决策过程。
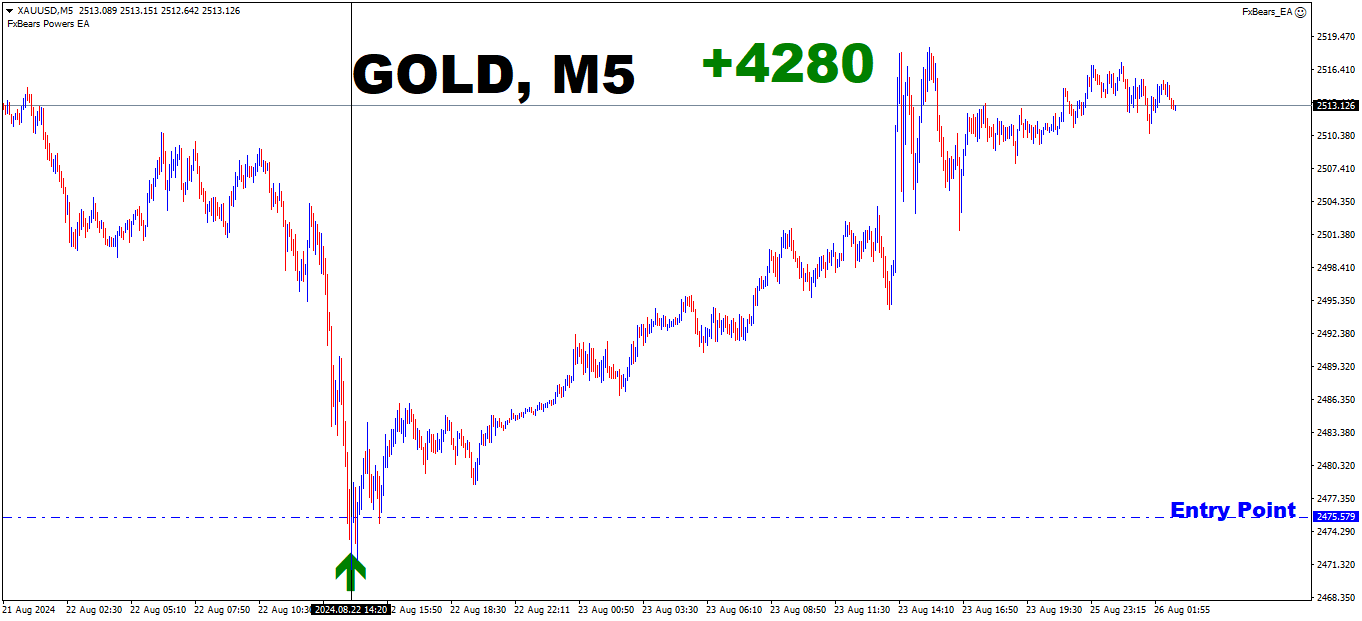
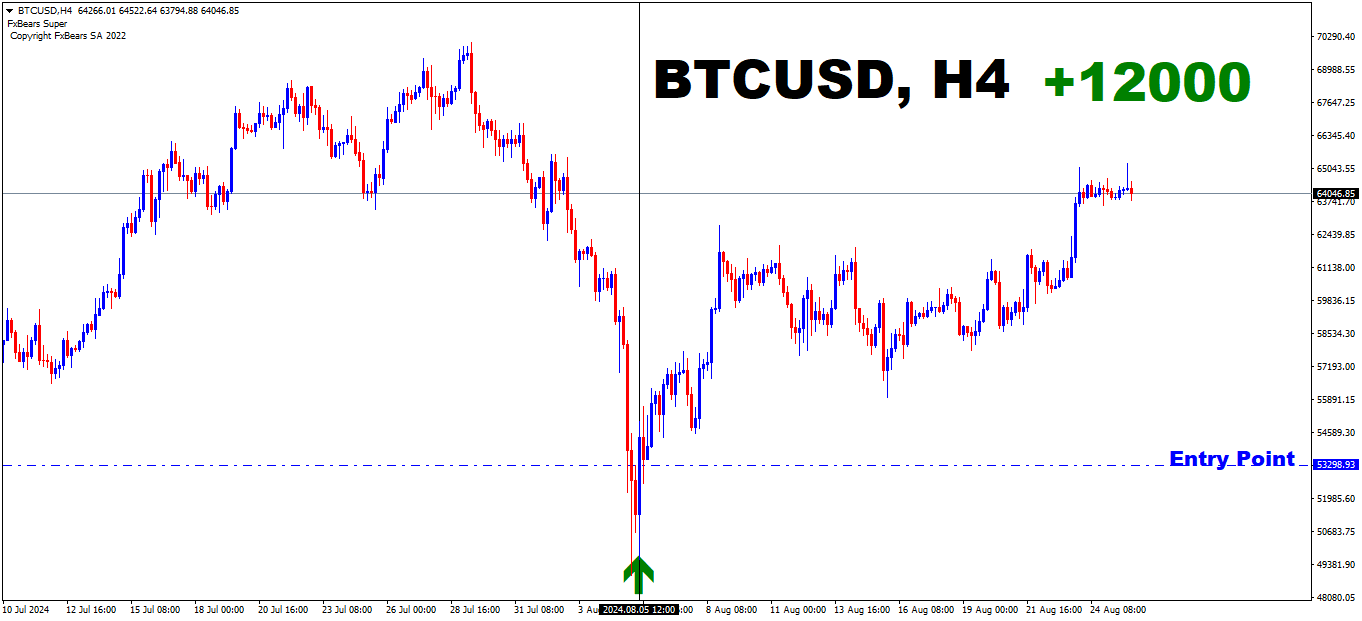
信号生成:

     FxBears Super 每天生成超过 10 个信号,为您提供充足的交易机会。 这些信号是对艾略特波浪、供需区域以及综合内部指标进行细致分析的结果。 通过采用整体方法,该指标为您提供具有经过验证的成功历史的信号。

成功率:

     FxBears Super 的成功率高达 90% 以上,展示了其持续引导交易者实现盈利交易的能力。 这种无与伦比的准确性源于多个指标和分析方法的协同组合,确保您接收到成功概率很高的信号。

     无论您身在何处,FxBears Super都会立即在手机平台上向您发送信号,这样您就无需一直坐在电脑前,也能舒适地执行日常任务并同时进行交易

结论:

     FxBears 超级交易指标通过提供艾略特波浪理论、供需区域和内部指标支持的精确信号来重新定义您的交易体验。 凭借其卓越的成功率和全面的方法,FxBears Super 为交易者提供了做出自信且有利可图的交易决策所需的工具。 拥抱这一前沿指标并释放持续交易成功的潜力。
推荐产品
Perfect for one minutes high trading and scalping. This indicator is very effective for trading on one minutes, in the hour. A combination of moving averages and STOCHASTICS calculation to produce a very convincing signal every hour. Blue colour signals a buy opportunity. Follow the X signs for possible buy points. The Blue average line serves as possible trend direction and support. Red colour signals a sell opportunity. Follow the X signs for possible sell points. The Red average line serves a
Indicator is based on cycles and moving averages and scans different periods. Better on timeframes started from 15 minutes. The parameters are clear: maximum bars to scan in history and alert settings (sound, email and notifications). Any question please answer in comments. Later MT5 version will be posted. And optimized version to use in the Expert advisors.
Credible Cross System
Muhammed Emin Ugur
Credible Cross System   indicator is designed for signal trading. This indicator generates trend signals. It uses many algorithms and indicators to generate this signal. It tries to generate a signal from the points with the highest trend potential. The indicator works based on instant price movements. This indicator is a complete trading product. This indicator does not need any additional indicators. The indicator certainly does not repaint. The point at which the signal is given does not c
EARLY REMINDER: The Starting price is 65 price will rise soon up to 365$ and then 750$ after first 10 copies of sales. Grab this offer now! Introduction Hello, traders! Welcome to the demonstration of the Forex Beast Indicator , a comprehensive tool designed to assist aspiring traders in navigating the complexities of the forex market. This indicator incorporates seven essential components to provide a well-rounded trading experience: Moving Averages Colored Zones Support and Resistance Levels
Advanced Stochastic Scalper
Evgeny Belyaev
4.56 (16)
Advanced Stochastic Scalper - is a professional indicator based on the popular Stochastic Oscillator. Advanced Stochastic Scalper is an oscillator with dynamic overbought and oversold levels, while in the standard Stochastic Oscillator, these levels are static and do not change. This allows Advanced Stochastic Scalper to adapt to the ever-changing market. When a buy or a sell signal appears, an arrow is drawn on the chart and an alert is triggered allowing you to open a position in a timely mann
Shark Deal Book
Philip Pankaj Suthagar
4 (3)
Term  "shark"  in the business world denotes a high volume investor who just made a good investment in a highly Potential business deal.So, sharks are the ones who make the market move. In our case, if an American shark bought a Japanese company, he/she has to convert American dollars into Japanese yen to make the deal. So, the demand for the Japanese yen will increase sharply. Thus USD/JPY will go short rapidly if the deal was from the shark. Another example, In the case of forex, if fed increa
Supernova Trading Indicator – See the Market Like Never Before Supernova isn’t just an indicator — it’s your secret weapon. Powered by advanced algorithms and real-time analysis, Supernova cuts through the noise and reveals high-probability entry and exit points with stunning clarity. No more guesswork. No more hesitation. Whether you're trading forex, crypto, or stocks, Supernova adapts to any strategy and any timeframe — delivering clean, confident signals that help you trade faster, smarter,
“动态剥头皮震荡指标”是一款高级自定义加密货币外汇指标,适用于 MT4 平台,高效交易! - 新一代震荡指标 - 参见图片了解如何使用。 - 动态剥头皮震荡指标具有自适应超卖/超买区域。 - 震荡指标是一款辅助工具,可从动态超卖/超买区域找到准确的入场点。 - 超卖值:低于绿线,超买值:高于橙线。 - 该指标也非常适合与价格行为模式结合使用。 - 它比标准震荡指标更精准。适用时间范围:30 分钟、1 小时、4 小时、1 天、1 周。 - 提供 PC 和移动端警报。 ................................................................................................................. 点击这里查看高质量的交易机器人和指标! 本产品为原创,仅在 MQL5 网站上提供。
Professional Level
Yaroslav Varankin
indicator for trading binary options and forex trading. The indicator does not redraw the readings. when trading binary options, testing was performed. This indicator showed the good results correct predictions. Under these conditions, the eur / usd m1 chart, when a signal appears, the transaction opens in the direction indicated by the indicator for 5 candles, then the truth is (5 minutes since in us the 1-minute chart of a candlestick is 1 minute) the result was. When trading in the forex m
Signal From Level
Yaroslav Varankin
Binary Options Support Resistance Indicator This indicator is designed for binary options trading and effectively shows retracements from support and resistance levels. Signals appear on the current candle. A red arrow pointing downwards indicates a potential selling opportunity, while a blue arrow pointing upwards suggests buying opportunities. All that needs adjustment is the color of the signal arrows. It is recommended to use it on the M1-M5 timeframes as signals are frequent on these timef
Rira Renko
Vitor Palmeira Abbehusen
RENKO on Time Chart This indicator is an enhanced Renko, so you can watch the Renko bricks on the chart to understand price movement more clearly the other improvement is automated box size according to ATR (Average True Range) period you can set the ATR number as you want and the box size of Renko changes automatically based on price movement Inputs Mode: Box size is the input to specify the size of the Renko box you want to print on the chart. This input lets you choose the fixed box siz
Super Reversal Pattern
Parfait Mujinga Ndalika
Super Reversal Pattern Indicator Unlock the power of advanced pattern recognition with our Super Reversal Pattern Indicator. Designed for traders seeking precision and reliability, this indicator identifies one of the most effective reversal patterns in technical analysis, offering a significant edge in your trading strategy. Key Features: Non-Repainting Accuracy: Enjoy the confidence of non-repainting technology. Once a Super Reversal Pattern is detected, it remains static, providing consiste
Swing Master Indicator
Elias Mtwenge
5 (1)
Dear Traders this is my another tool called " Swing Master Indicator ". As the name above the indicator is designed to help you in swing trading by capturing the low and highs of the price. You may us this tool with any trading strategy and style from scalping to position trading. It is made for level of traders including newbies and advanced traders even prop-firms, hedge funds and banks to help them make sold market analysis. I create tools for serious traders who want to make a difference in
VR Cub
Vladimir Pastushak
VR Cub 这是获得高质量切入点的指标。该指标的开发是为了促进数学计算并简化对仓位入场点的搜索。多年来,该指标所针对的交易策略已被证明其有效性。交易策略的简单性是其巨大的优势,即使是新手交易者也能成功进行交易。 VR Cub 计算开仓点以及获利和止损目标水平,这显着提高了效率和易用性。查看使用以下策略进行交易的屏幕截图,了解简单的交易规则。 设置、设置文件、演示版本、说明、问题解决,可以从以下位置获取 [博客] 您可以在以下位置阅读或撰写评论 [关联] 版本为 [MetaTrader 5] 计算入场点的规则 开仓 要计算入场点,您需要将 VR Cub 工具从最后一个高点拉伸到最后一个低点。 如果第一个点在时间上早于第二个点,交易者等待柱线收于中线上方。 如果第一个点在时间上晚于第二个点,交易者等待柱线收于中线下方。 根据上述条件,严格在 柱线收盘 后建仓。 换句话说,如果我们在小时图上进行交易,那么从最高点到最低点的时间距离必须超过24小时,最高点和最低点之间的点数必须大于或等于平均价格变动每天。 维持和改变市场地位 可以有多个未平仓头寸;每个头寸都可以单独修改。 VR Cub
“可调分形” - 是分形指标的高级版本,非常有用的交易工具! .......................................................................................... - 众所周知,标准分形 MT4   指标根本没有设置 - 这对交易者来说非常不方便。 - 可调分形解决了这个问题 - 它具有所有必要的设置: - 指标的可调周期(建议值 - 高于 7)。 - 价格高点/低点的距离可调。 - 可调分形箭头设计。 - 指标内置移动和 PC 警报。 点击这里查看高质量的交易机器人和指标! 这是仅在此 MQL5 网站上提供的原创产品。 ....................................................
Magic EA MT4
Kyra Nickaline Watson-gordon
3 (1)
Magic EA is an Expert Advisor based on Scalping, Elliot Waves and with filters such as RSI, Stochastic and 3 other strategies managed and decided with the robot smartly. Large number of inputs and settings are tested and optimized and embedded in the program thus inputs are limited and very simple. Using EA doesn't need any professional information or Forex Trading Knowledge. EA can trade on all symbols and all time frames, using special and unique strategies developed by the author. The EA wo
Binary Option Signal
Yaroslav Varankin
Indicator for binary options arrow is easy to use and does not require configuration works on all currency pairs, cryptocurrencies buy signal blue up arrow sell signal red down arrow tips do not trade during news and 15-30 minutes before their release, as the market is too volatile and there is a lot of noise it is worth entering trades one or two candles from the current period (recommended for 1 candle) timeframe up to m 15 recommended money management fixed lot or fixed percentage of the depo
MACD Color for GOLD
Chitipat Changsamrit
黄金的 MACD 颜色 用于查看图表的走势和检查将要买入或卖出 看 trand 的颜色很容易看。 红色向下/蓝色向上。 可以在很短的时间内使用它 1. 多头交易:与时间框架 H1 / H4 / 每日一起使用 2.Short Trade : 使用时间框架 M5 / M15 / M 30 / H1 您可以通过查看此指标来了解何时打开或关闭订单 ---------------------------- 黄金的 MACD 颜色 用于查看图表的走势和检查将要买入或卖出 看 trand 的颜色很容易看。 红色向下/蓝色向上。 可以在很短的时间内使用它 1. 多头交易:与时间框架 H1 / H4 / 每日一起使用 2.Short Trade : 使用时间框架 M5 / M15 / M 30 / H1 您可以通过查看此指标来了解何时打开或关闭订单
OtmScalpHedge
Otmane Achandir
OtmScalp EA V1 - 专为欧元、黄金和比特币设计的人工智能剥头皮交易机器人 OtmScalp EA V1 - 专为欧元、黄金和比特币设计的人工智能剥头皮交易机器人 限时优惠: 仅售499美元(原价1200美元 - 即将涨价!) 为什么OtmScalp EA V1是专业交易者的最佳选择? 稳定的每日盈利 - 专为激进但可控的剥头皮交易设计,捕捉小而频繁的盈利机会 3个专业版本 - 针对欧元货币对、黄金(XAU/USD)和比特币(BTC/USD)优化 全自动AI交易 - 无需人工干预,24/5全天候运行 智能风险管理 - 自动止损、止盈和动态手数调整 OtmScalp EA V1如何为您创造收益 高胜率策略 - AI检测微趋势并在毫秒内执行交易 低回撤 - 先进的风险管理保护您的资金 兼容任何经纪商 - 已在IC Markets、Pepperstone、RoboForex等平台测试 简单设置 - 2分钟完成安装,无需编程知识 实际表现(回测和实盘结果) 欧元/美元版本:月均15-25%(5分钟和15分钟图表) 黄金(XAU/USD)版本:月均20-35%(波动率优化) 比特币(
Martingale Scanner: Smart Trade Analysis for Martingale Strategies The Martingale strategy is a high-risk, high-reward approach that requires precise execution and careful risk management. Without the right tools, traders may struggle to analyze market conditions and adjust trade sizes effectively. Martingale Scanner is designed to simplify and optimize this process, providing traders with a structured way to apply the strategy efficiently across different currency pairs. Why Use Martingale Scan
FREE
Auto Fibo Pro m
DMITRII GRIDASOV
“Auto FIBO Pro” Crypto_Forex 指标 - 是交易中的绝佳辅助工具! - 指标自动计算并放置在图表斐波那契水平和局部趋势线(红色)上。 - 斐波那契水平指示价格可能反转的关键区域。 - 最重要的水平是 23.6%、38.2%、50% 和 61.8%。 - 您可以将其用于反转剥头皮或区域网格交易。 - 还有很多机会可以使用 Auto FIBO Pro 指标来改进您当前的系统。 - 它具有信息价差掉期显示 - 它显示所连接的外汇对的当前价差和掉期。 - 显示屏还显示账户余额、净值和保证金。 - 可以将信息价差掉期显示定位在图表的任何角落: 0 - 左上角,1 - 右上角,2 - 左下角,3 - 右下角。 点击这里查看高质量的交易机器人和指标! 这是仅在此 MQL5 网站上提供的原创产品。
True Magic Oscillator
Muhammed Emin Ugur
The   True Magic Oscillator   indicator is designed for signal trading. This indicator generates trend signals. It uses many algorithms and indicators to generate this signal. It tries to generate signals from the points with the highest trend potential. This indicator is a complete trading product. This indicator does not need any additional indicators. The indicator is never repainted. The point at which the signal is given does not change.         Features and Recommendations Works wit
The Serpent Rider Binary Options
Ellan Dirgantara Tholkhah
Embark on the pinnacle of Binary Options evolution. Our indicator isn't just adaptive—it's relentless. Picture a ninja riding a serpent, shadowing its every move; that's how this tool trails the market trend, unwavering till the end. Built upon the foundational prowess of the Ichimoku indicator and honed with an array of fine-tuned oscillators, it epitomizes accuracy and precision. Dive deep without getting lost in the Ichimoku's intricacies—our indicator simplifies the process for you. Perhaps
WanaScalper MT4
Isaac Wanasolo
1 (1)
A scalping indicator based on mathematical patterns, which on average gives signals with relatively small SL, and also occasionally helps to catch big moves in the markets (more information in the video) This indicator has three main types of notifications: The first type warns of a possible/upcoming signal on the next bar The second type indicates the presence of a ready signal to enter the market/open a position The third type is for SL and TP levels - you will be notified every time price re
The Arrow Scalper
Fawwaz Abdulmantaser Salim Albaker
1 (2)
Dear Friend..  I share with you this simple Expert Adviser .. it is full automatic  this Expert Adviser following the trend of the pair you install on or any stocks or indices , it is works like that: - when the trend on H4 chart show a start of up trend the expert will wait till the 15M & 1H charts show an up trend the EA will open a buy order directly , and do the same for down trend and open a sell order the buy or sell  order lot size and take profit and stop loss will measured manually  by
FREE
SMC Venom 模型 BPR 指標是針對在智慧貨幣 (SMC) 概念內工作的交易者的專業工具。它會自動辨識價格圖表上的兩種關鍵模式: FVG (公平價值缺口)是三根蠟燭的組合,其中第一根和第三根蠟燭之間存在缺口。它在水平之間形成一個沒有成交量支撐的區域,這通常會導致價格調整。 BPR (平衡價格區間)是兩種 FVG 模式的組合,形成一個「橋樑」 - 當價格以低成交量活動移動時,突破並返回到水平的區域,從而在蠟燭之間產生間隙。 這些模式可協助交易者透過分析圖表上的交易量和價格動態(大型市場參與者和普通參與者之間的互動)來識別關鍵的支撐/阻力位、突破區域和切入點。 此指標以矩形和箭頭的形式可視化模式,也支援靈活的警報設定。 主要特點: 模式顯示模式:選擇顯示 BPR 模式(看漲和看跌)或 FVG 模式(看漲和看跌)。 可以隱藏所有圖表分析模式。 以條數過濾:BPR 結構中 FVG 之間的最小/最大距離。 訊號的附加視覺化: 箭頭有 9 種類型可供選擇(標準、細、分形等)或手動輸入 Wingdings 代碼,其表格可以選擇性地顯示在圖表上。 使用 ATR 配置顏色、尺寸及其相對於價格
Crypto_Forex 指标“晨星模式”适用于 MT4。 - 指标“晨星模式”是价格行为交易的非常强大的指标:无需重绘,无延迟。 - 指标检测图表上的看涨晨星模式:图表上的蓝色箭头信号(见图片)。 - 带有 PC、手机和电子邮件警报。 - 还有它的兄弟 - 看跌“黄昏之星模式”指标可用(点击以下链接)。 - 指标“晨星模式”非常适合与支撑/阻力位结合使用。 ................................................................................................................. 点击这里查看高质量的交易机器人和指标! 这是仅在此 MQL5 网站上提供的原创产品。
Limitless MT4
Dmitriy Kashevich
Limitless MT4 is a universal indicator suitable for every beginner and experienced trader. works on all currency pairs, cryptocurrencies, raw stocks Limitless MT4 - already configured and does not require additional configuration And now the main thing Why Limitless MT4? 1 complete lack of redrawing 2 two years of testing by the best specialists in trading 3 the accuracy of correct signals exceeds 80% 4 performed well in trading during news releases Trading rules 1 buy signal - the ap
Mk R
Can Pei Pu
MK_R It is based on contrary patterns for EURUSD.  Basically, it will entry using the condition of 1 buy wave and 6 sell wave of Granville's law. The EA does not use indicators, grid, martingale, arbitrage.  The EA has been proven to be profitable in the six months of 2020 and is particularly suitable for the current EURUSD market since mid-December 2020. Monitoring: https://www.mql5.com/en/signals/789229 Timeframe is M5. EA needs M1 chart,M5 chart,M15 Chart,H1 chart,H4 chart. Maxium Spread
he expert works on the Zigzag levels on the previous candle With some digital way to enter the deal On the five minute frame Work on currency pairs only Do not use TakeProfit or Stop Loss How the expert works It is placed on the three currency pairs GBPUSD GBPJPY GBP AUD Same settings without changing anything When he works, he will work on only one currency of them until it closes on a profit Profit is only seven points Please watch the video Explains how the expert works. Max Spread = 0.3 Bro
该产品的买家也购买
Miraculous 指标 – 100% 不重绘的外汇和二元期权工具,基于江恩九方图 这个视频介绍的 Miraculous 指标 是一款专为外汇和二元期权交易者开发的高精度、强大交易工具。该指标的独特之处在于它建立在传奇的 江恩九方图 和 江恩振动法则 之上,使其成为现代交易中可用的最精确预测工具之一。 Miraculous 指标 完全不重绘 ,这意味着它的信号在 K 线收盘后不会改变或消失——你看到的就是你得到的。这为交易者提供了可靠且一致的基础,让他们能够自信地进出场交易。 主要特点: 基于江恩九方图和江恩理论构建 100% 不重绘的信号系统 适用于所有时间周期(M1、M5、H1、H4、日线、周线) 适用于外汇和二元期权交易 清晰的买卖信号,准确率高 可用于剥头皮、日内交易或波段交易 兼容大多数 MT4 平台 这款工具旨在帮助初学者和专业交易者做出更好、更明智的决策。无论您是交易货币、指数还是二元期权,Miraculous 指标都将为您在市场中提供所需的优势。
訂閱指標注意事項 此信號只支援電腦版MT4 不支援MT5、手機、平板 指標只顯示當日進場箭頭 非直播指標顯示歷史箭頭 (直播為展示用) 指標為交易輔助性質 非EA自動交易 無跟單功能 指標只標示進場位置 無出場(止盈)指示 進場止損點位設定30-50 PIPS 或是前高前低做為防守 止損不需拉太遠 紅色箭頭為多方進場訊號 綠色箭頭為空方進場訊號 撐阻力強度用箭頭大小表示 此指標適用於波段策略 不適合當沖策略盤整 多空反轉時不適用 指標載入後 右下角都會預設顯示盤整 載入指標一小時後 才會顯示多空 加入Youtube頻道會員 可參加每個月一次實體抽獎活動(台灣以外地區,獎品折現金用Paypal匯出) 每月抽獎時間為非農數據公布當週的週末盤勢分析(2100) 得獎者必須抽獎時在線上,逾期不候
Pulse Scalping Line - an indicator for identifying potential pivot points. Based on this indicator, you can build an effective Martingale system. According to our statistics, the indicator gives a maximum of 4 erroneous pivot points in a series. On average, these are 2 pivot points. That is, the indicator shows a reversal, it is erroneous. This means that the second signal of the indicator will be highly accurate. Based on this information, you can build a trading system based on the Martingale
El indicador "MR BEAST ALERTAS DE LIQUIDEZ" es una herramienta avanzada diseñada para proporcionar señales y alertas sobre la liquidez del mercado basándose en una serie de indicadores técnicos y análisis de tendencias. Ideal para traders que buscan oportunidades de trading en función de la dinámica de precios y los niveles de volatilidad, este indicador ofrece una visualización clara y detallada en la ventana del gráfico de MetaTrader. Características Principales: Canal ATR Adaptativo: Calcula
Fxland Price Reversal Zones (MT4) FXLAND Smart Reversal Indicator is a professional technical analysis tool designed to help traders identify potential price reversal zones and key market turning points with clarity and precision. The best reversal indicator and price return by choosing only one ceiling or floor in each time frame A masterpiece of combining mathematics and Gann, fractal matrix, Fibonacci, movement angle and time. Completely intelligent Key Features Detects potential pr
PairMaster Buy Sell Arrow Indicator for MT4 Trade Reversals Like a Pro — Catch Every Swing Point with Precision The PairMaster Buy Sell Arrow Indicator is a powerful MetaTrader 4 tool built to identify high-probability swing trading opportunities . Designed for traders who value accuracy, clarity, and simplicity, PairMaster detects key market turning points and plots intuitive buy and sell arrows directly on your chart. Key Features Accurate Swing Point Detection – Automatically identifies ma
VTrende Pro mt4
Andrii Diachenko
3 (2)
VTrende Pro MT4 - MTF indicator for trend trading with a display panel for MT5 *** Videos can be translated into any language using subtitles (video language - Russian) Although the signals of the VTrende Pro indicator can be used as signals of a full-fledged trading system, it is recommended to use them in conjunction with the Bill Williams TS. VTrende Pro  MT4 is an extended version of the VTrende indicator. Difference between Pro version and VTrende: - Time zones - Signal V - signal 1-2 wave
Bomb Bank Signal
Igor Pereira Calil
5 (1)
炸彈銀行訊號:您對 MetaTrader 4 的信心指標 Bomb Bank Signal 是 MetaTrader 4 的一個強大指標,旨在識別金融市場中最相關的趨勢。如果您正在尋找一種能夠準確預測運動的工具,那麼炸彈庫就是您需要的盟友。 運作原理: 該指標結合了三種不同的方法——成交量分析、蠟燭收盤價和對稱趨勢——來偵測和發出買賣機會訊號。當炸彈銀行識別出買入機會時,它就像一顆「炸彈」;當它偵測到賣出訊號時,它就像一個「頭骨」。 為什麼炸彈銀行不一樣? 完全可靠性:炸彈庫訊號不會刪除訊號。訊號一旦發出,就會一直存在,確保您不會錯過任何機會。 極為準確:炸彈庫不會發出錯誤訊號。它會即時更新您的訊息,隨著市場的變化進行調整,但保持先前訊號的透明度。 即時更新:訊號被即時識別並在必要時更新,使您能夠快速響應市場變化。 最大化您的結果: 炸彈銀行訊號是識別趨勢持續走勢的理想選擇。例如,如果您已經做空並且指標在 M15 發出買入訊號,那麼現在就是平倉或部分下單的最佳時機,反之亦然。 此外,經過仔細分析,我們建議您遵循M30、H1和H4上的訊號,停損僅50點。這使得價格朝著有利
Rtc ML Ai Predictor MT4
Muhammad Faisal Sagala
Rtc ML Ai | Predictor CORE MACHINE LEARNING ENGINE Adaptive ML Market Predictor – Multi-Bar Trend & Candle Forecast What This Indicator Does This indicator is a  real-time market prediction engine  designed to analyze price behavior and estimate  future market tendencies . Unlike conventional indicators, this system  does not rely on static parameters or historical curve-fitting , but adapts its internal state dynamically during live market operation. Instead of using static rules, the indic
The Hurricane Indicator
Paul Nicholas Clevett
5 (1)
Currently switched to the 4 hour chart - but use other time frames for confirmation. :-)  I change my main time frame based on the market movement at the time. The Hurricane Forex Indicator is a multi time frame indicator that includes such things as Trade Notifications, Trade Calculator, Momentum Indicator, risk reward and much more. We have a free Trade room for our users as well. Please check out the video for full details of how this indicator works as it has over 15 years worth of developme
FFx Engulfing Setup Alerter gives trade suggestions with Entry, Target 1, Target 2 and StopLoss. Below are the different options available: Entry suggestion - pips to be added over the break for the entry 3 different options to calculate the SL - by pips, by ATR multiplier or at the pattern High/Low 3 different options to calculate the 2 TPs - by pips, by ATR multiplier or at Risk/Reward Offset the dashboard - any place on the chart Remove the suggestion once the price reached the SL line Lines
FFx InsideBar Setup Alerter gives trade suggestions with Entry, Target 1, Target 2 and StopLoss. Below are the different options available: Entry suggestion - pips to be added over the break for the entry Minimum candle size - to avoid too close buy/sell entry suggestions 3 different options to calculate the SL - by pips, by ATR multiplier or at the pattern High/Low 3 different options to calculate the 2 TPs - by pips, by ATR multiplier or at Risk/Reward Offset the dashboard - any place on the c
FFx OutsideBar Setup Alerter gives trade suggestions with Entry, Target 1, Target 2 and StopLoss. Below are the different options available: Entry suggestion - pips to be added over the break for the entry. 3 different options to calculate the SL - by pips, by ATR multiplier or at the pattern High/Low. 3 different options to calculate the 2 TPs - by pips, by ATR multiplier or at Risk/Reward. Offset the dashboard - any place on the chart. Remove the suggestion once the price reached the SL line.
FFx PinBar Setup Alerter gives trade suggestions with Entry, Target 1, Target 2 and StopLoss. Below are the different options available: Entry suggestion - pips to be added over the break for the entry Minimum candle size - to avoid too small candles 3 different options to calculate the SL - by pips, by ATR multiplier or at the pattern High/Low 3 different options to calculate the 2 TPs - by pips, by ATR multiplier or at Risk/Reward Offset the dashboard - any place on the chart Remove the sugges
Lineverse Trendlines
Arkady Segal
5 (1)
Automatic, live & interactive picture of all trendlines. Assign push, email and sound alerts to the lines of your choice and be informed about price rollback, breakout, rollback after breakout, number of rollbacks, line expiration by double breakout. Correct, drag or delete the lines and interactively tune the line system. https://youtu.be/EJUo9pYiHFA . Chart examples https: //www.mql5.com/en/users/efficientforex Price Interaction Events All events are effective immediately and only after one
FFx MACD Divergences
Eric Venturi-Bloxs
The purpose of this new version of the MT4 standard indicator provided in your platform is to display in a sub-window multiple timeframes of the same indicator with its divergences. See the example shown in the picture below. But the display isn't like a simple MTF indicator. This is the real display of the indicator on its timeframe. Here's the options available in the FFx divergences indicator: Select the timeframes to be displayed (M1 to Monthly) Define the width (number of bars) for each tim
FFx RSI Divergences
Eric Venturi-Bloxs
The purpose of this new version of the MT4 standard indicator provided in your platform is to display in a sub-window multiple timeframes of the same indicator with its divergences. See the example shown in the picture below. But the display isn't like a simple MTF indicator. This is the real display of the indicator on its timeframe. Here's the options available in the FFx divergences indicator: Select the timeframes to be displayed (M1 to Monthly) Define the width (number of bars) for each tim
FFx CCI Divergences
Eric Venturi-Bloxs
The purpose of this new version of the MT4 standard indicator provided in your platform is to display in a sub-window multiple timeframes of the same indicator with its divergences. See the example shown in the picture below. But the display isn't like a simple MTF indicator. This is the real display of the indicator on its timeframe. Here's the options available in the FFx divergences indicator: Select the timeframes to be displayed (M1 to Monthly). Define the width (number of bars) for each ti
The FFx Dashboard MTF alerter will show you on a single chart all the timeframes (M1 to Monthly) with their own status for the indicator. 2 Alert Options: Single timeframe: each selected timeframe alert separately when a signal occurs Multi timeframes: all selected timeframes must agree for an alert to be triggered Both options have an input to select the timeframes to be used for the alert(s). How to Understand the Status: Green/Red square: histogram above/below 0 line Green square + Red bord
The FFx Dashboard MTF alerter will show you on a single chart all the timeframes (M1 to Monthly) with their own status for the indicator. 2 Alert Options: Single timeframe: each selected timeframe alert separately when a signal occurs Multi timeframes: all selected timeframes must agree for an alert to be triggered Both options have an input to select the timeframes to be used for the alert(s). How to understand the status: Green/Red square: RSI above/below 50 line Green square + Red border: R
The FFx Dashboard MTF alerter will show you on a single chart all the timeframes (M1 to Monthly) with their own status for the indicator. 2 Alert Options: Single timeframe: each selected timeframe alert separately when a signal occurs Multi timeframes: all selected timeframes must agree for an alert to be triggered Both options have an input to select the timeframes to be used for the alert(s). How to understand the status: Green/Red square: Stoch above/below 50 line Green square + Red border:
The FFx Dashboard MTF alerter will show you on a single chart all the timeframes (M1 to Monthly) with their own status for the indicator. 2 Alert Options: Single timeframe: each selected timeframe alert separately when a signal occurs Multi timeframes: all selected timeframes must agree for an alert to be triggered Both options have an input to select the timeframes to be used for the alert(s). How to understand the status: Green/Red square: Price above/below Cloud (Kumo) Green square + Red bo
The FFx Dashboard MTF alerter will show you on a single chart all the timeframes (M1 to Monthly) with their own status for the indicator. 2 Alert Options: Single timeframe: each selected timeframe alert separately when a signal occurs Multi timeframes: all selected timeframes must agree for an alert to be triggered Both options have an input to select the timeframes to be used for the alert(s). How to understand the status: Green/Red square: MA pointing Up/Down Green square + Red border: MA po
The FFx Dashboard MTF alerter will show you on a single chart all the timeframes (M1 to Monthly) with their own status for the indicator. 2 Alert Options: Single timeframe: each selected timeframe alert separately when a signal occurs. Multi timeframes: all selected timeframes must agree for an alert to be triggered. Both options have an input to select the timeframes to be used for the alert(s). How to understand the status: Green square: Price above PSAR Red square: Price below PSAR Options
The FFx Dashboard MTF alerter will show you on a single chart all the timeframes (M1 to Monthly) with their own status for the indicator. 2 Alert Options: Single timeframe: each selected timeframe alert separately when a signal occurs Multi timeframes: all selected timeframes must agree for an alert to be triggered Both options have an input to select the timeframes to be used for the alert(s). How to understand the status: Green/Red square: CCI above/below levels (ie. 100/-100) Grey square: C
The FFx Dashboard MTF alerter will show you on a single chart all the timeframes (M1 to Monthly) with their own status for the indicator. 2 Alert Options: Single timeframe: each selected timeframe alert separately when a signal occurs Multi timeframes: all selected timeframes must agree for an alert to be triggered Both options have an input to select the timeframes to be used for the alert(s). How to understand the status: Green/Red square: ADX above level Grey square: ADX below level Red bor
The FFx Dashboard MTF alerter will show you on a single chart all the timeframes (M1 to Monthly) with their own status. 2 Alert Options: Single timeframe: each selected timeframe alert separately when a signal occurs Multi timeframes: all selected timeframes must agree for an alert to be triggered Both options have an input to select the timeframes to be used for the alert(s). How to understand the status: Green/Red square: bullish/bearish candle Options available in the FFx Dashboard Alerter
THE GRAFF III
Antonin Skaryd
The [GRAFF] III manual trading system is based on multiple MetaTrader (MT4) indicators. Together, the entire PACK of GRAFF III indicators makes an advanced trading tool. The system consists of over 20 different custom-built indicators which have been carefully selected and tested in the long term to produce strong and efficient trading signals. The particular indicators are based on different mathematical formulas, so the entire system is calibrated to remove false signals from its own indicator
作者的更多信息
FxBears Powers
Rachid Lafhil
3 (2)
FxBears Powers 致力于所有外汇对、金属、商品、期货、指数、能源、加密货币以及所有……以及从 M1 到 MN 的所有时间范围.........。 它基于供需和一些内部指标,它为您提供了一个非常强大的切入点,大部分时间为 0,您可以在测试中验证这一点..............。 它会立即在您的手机平台上向您发送信号,包括货币对名称、时间、时间范围、买入或卖出,   入场点、SL 和 TP....。 它在图表上为您提供卖出或买入箭头和 3 条线:TP、SL、入场点。 带有声音的即时通知。 输入没有复杂性,对于初学者和专业人士来说非常简单。 不重绘,不重绘。 使用此指标不再有损失,多年前对其进行测试,看看某一天的结果是否有损失......。
筛选:
无评论
回复评论