 MetaTrader 5
 专家
专家
 指标
指标
 程序库
程序库
 实用工具
实用工具
 窗口小部件
窗口小部件
 规则
规则
适用于MetaTrader 4的新EA交易和指标 - 158
 EA交易自动执行市场交易,而指标可使您更准确地分析报价并预测价格行为。
通过这些应用程序,您将能够更明智地在MetaTrader 4执行交易,抓住更多的交易机会。
EA交易自动执行市场交易,而指标可使您更准确地分析报价并预测价格行为。
通过这些应用程序,您将能够更明智地在MetaTrader 4执行交易,抓住更多的交易机会。 
Winshots Trade Assistant EA decides when to take the the first trade based on the H1 time frame and the Stochastic indicator. It is there to assist you in deciding in which direction you should trade as well as managing all the trades you open on the same chart (it's very useful in scalping on lower time frames). The first trade will always be 1 micro lot, and decision always based on the H1 time frame. Then your job is to open further trades in the same direction as top ups MANUALLY. However

Thanks to this indicator, you can easily see the new ABCD harmonic patterns in the chart.
If the two price action lengths are equal, the system will give you a signal when it reaches the specified level.
You can set the limits as you wish. For example, You can get the signal of the price, which occurs in the Fibonaci 38.2 and 88.6 retracements, and then moves for the same length, at the level you specify. For example, it will alarm you when the price reaches 80% as a percentage.
In vertical

Indicator show best signals for buy and sell orders. Indicator uses only 2 inputs: DEMA Fast Period - fast double exponential moving average period DEMA Slow Period - slow double exponential moving average period Crossings of fast and slow double double exponential moving averages shows buy and sell signals, which are drawn as green and magenta arrows respectively.

Indicator show best signals for buy and sell orders. Indicator uses only 3 inputs: DEMA Fast Period - fast double exponential moving average period DEMA Slow Period - slow double exponential moving average period DEMA Trend Period - trend double exponential moving average period
Position of price according to trend double double exponential moving average and crossings of fast and slow double double exponential moving averages shows buy and sell signals, which are drawn as green

Indicator show best signals for buy and sell orders. Indicator uses only 2 inputs: PEMA Bounce Period - bounce percentage exponential moving average period PEMA Confirm Period - confirm percentage exponential moving average period Positions of price according to bounce and confirm percentage exponential moving averages and directions of bounce and confirm percentage exponential moving average shows buy and sell signals, which are drawn as green and magenta arrows respectively.
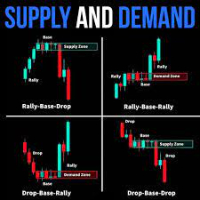
indicators included supply and demand indicator Specification Buy trade A SUPPORT zone (or immediately forms above the support zone) if the candle sticks are below either the middle or the lower band NO BUY TRADE IN THE RESISTANCE ZONE (RED HIGHLIGHTED ZONE), Sell trade A RESISTANCE zone (or immediately forms below the resistance zone) if the candle sticks are above either the middle or the upper band NO SELL TRADE IN THE SUPPORT ZONE (GREEN HIGHLIGHTED ZONE), In the supply zone, the prices are

The Change Chart Timeframe EA is a powerful tool that provides users with the ability to effortlessly modify and customize chart timeframes according to their trading strategies and personal preferences. You can select individual charts to modify or apply changes to all charts simultaneously, saving valuable time and effort. This EA is just a tool to help with your auto trading. It doesn't open any trades, so nothing happens if you backtest it. Any setting marked with "(pro)" will use its
FREE

操作技术,资金管理,风险管理是交易系统三大要素,其中风险管理是交易中可以说是最重要的一部分,想要在市场上赚钱,首先要先活下来,要先活下来就要先做好风险管控。 相信做交易的朋友都会遇到风险管理的问题: 1. 不设置止损,亏了继续硬抗,如遇到单边行情,亏损便会大幅扩大,甚至爆仓。 2. 亏了一定资金后,开始着急想快点赚回来,开始重仓 或者频繁操作 ,结果亏得更多。 3. 赚了一定资金后,信心开始膨胀, 忘记做单规则 ,开始加仓操作,结果回吐利润。
这也是作者曾经经历的,所以把这些痛点总结出来做成工具,希望能帮助到大家。如果你是超级自律的人,能按照既定的系统规则交易,也能严格做好风控,也许不适合你,但 如果你正在经受这样的痛苦和懊恼,不妨试试这款工具,也许能帮助到你。
该工具具备以下功能: 1. 控制总资金回撤,当达到设定回撤时,会关闭所有持仓,并禁止开仓交易。 2. 当日资金回撤比例控制,对于日内交易者,可以帮助做好当天的资金回撤控制。 3. 当日资金盈利达到一定比例后可限制进行交易,以免头脑过热,回吐利润。 4. 下单仓位控制,可按照设置值来控制总的持仓大小。 5. 交易品种限制
The Change Chart Timeframe EA is a powerful tool that provides users with the ability to effortlessly modify and customize chart timeframes according to their trading strategies and personal preferences. You can select individual charts to modify or apply changes to all charts simultaneously, saving valuable time and effort. This EA is just a tool to help with your auto trading. It doesn't open any trades, so nothing happens if you backtest it.
Parameters Working hour setting Start hour:

Discover PM - Your Ultimate Precision Forex Indicator for Informed Trading Decisions! In the fast-paced and ever-changing world of Forex trading, having a reliable and accurate indicator can make all the difference between success and missed opportunities. Say hello to PM, the revolutionary Precision Momentum indicator, engineered to empower traders with unparalleled insights into market dynamics, volatility, and trends. At the heart of PM's power lies its ability to precisely identify moments

Super Night Scalper is the advanced scalping system which utilizes smart entry/exit algorithms with sophisticated filtering methods to identify only the safest entry points during calm periods of the market. This system is focused on a long-term stable growth. It is a professional tool developed by me years ago that is constantly updated, incorporating all the latest innovations in the trading area. Nothing fancy here, no testing Holy Grails, no "risk-free martingale", only strict rule-b

介绍 Quantum Breakout PRO ,突破性的 MQL5 指标,正在改变您交易突破区域的方式! Quantum Breakout PRO 由拥有超过 13 年交易经验的经验丰富的交易者团队开发,旨在通过其创新和动态的突破区域策略将您的交易之旅推向新的高度。
量子突破指标将为您提供带有 5 个利润目标区域的突破区域的信号箭头,以及基于突破框的止损建议。
它既适合新手交易者,也适合专业交易者。
量子 EA 通道: 点击这里 MT5版本: 点击这里 重要的!购买后请私信我领取安装手册。 建议:
时间范围:M15 货币对:GBPJPY、EURJPY、USDJPY、NZDUSD、XAUUSD 账户类型:ECN、Raw 或 Razor,点差极低 经纪商时间:GMT +3 经纪商:IC Markets、Pepperstone with Raw 和 Razor 的点差最低
规格:
不重漆! 最多 5 个建议利润目标区域 建议止损水平 可定制的盒子。您可以设置自己的 Box Time Start 和 Box Time End。
接触
如果您

趋势捕捉器(The Trend Catcher): 带有警报指标的趋势捕捉策略是一种多功能技术分析工具,帮助交易者识别市场趋势以及潜在的进出场点。它采用动态趋势捕捉策略,可根据市场状况进行调整,为交易者提供清晰的趋势方向视觉展示。交易者可以根据个人偏好和风险承受能力自定义参数。该指标有助于趋势识别、提示潜在反转、并提供实时警报以便快速应对市场变化。 功能特点: 趋势识别:发出多头趋势和空头趋势信号。
趋势反转:当蜡烛颜色从多头变为空头或相反时,提示潜在反转。
实时警报:在识别到新趋势时生成警报。 推荐: 货币对:EURUSD、AUDUSD、XAUUSD…
时间周期:MetaTrader 4: M5, M15、M30、H1。
账户类型:任何ECN账户或低点差账户。
FREE

介绍我们的创新交易机器人,旨在帮助您在外汇市场上实现最大盈利。 我们的交易机器人使用先进的算法将挂单置于当前价格之上或之下,并能够设置止盈和止损参数。 这允许进行精确的风险管理,确保您可以限制损失并最大化收益。
我们的交易机器人还配备了盈亏平衡功能,使您能够确保利润并将风险降至最低。 此功能在波动的市场条件下特别有用,可让您锁定收益并保护您的投资。
此外,我们的交易机器人包括一个时间过滤器,使您能够设置符合您的日程安排和偏好的特定交易时间。 此功能对于那些喜欢在特定市场时间进行交易的人特别有用。
对于那些喜欢高风险设置的人,我们的交易机器人包括安全止损功能,允许您在特定水平设置止损以防止突然的市场波动。 我们的交易机器人默认设置为 GBP/USD 对,时间框架为 M15,还包括其他主要外汇对的安全和高风险设置。
总体而言,我们的交易机器人旨在通过其先进的算法和风险管理功能帮助您最大限度地提高盈利能力,同时最大限度地降低风险。 凭借其精确性、灵活性和易用性,我们的交易机器人是任何希望在当今快节奏市场中取得成功的外汇交易者的完美工具。
其他外汇主要货币对的替代设置可以在“评论”

使用 Schaff Trend Cycle Alert MT4 提升您的交易策略,这是一个强大的振荡器,融合MACD和Stochastic元素,以最小延迟提供平滑、可靠的趋势信号。由Doug Schaff于1990年代末开发,并在TradingView和MQL5等平台上流行以来,这一指标自2010年代以来已成为交易者的首选,因为它比传统振荡器更早识别周期顶部和底部. 非重绘且可定制,它擅长发现过买/过卖条件和趋势反转,使其成为外汇和加密等波动市场的理想选择. 交易者青睐Schaff Trend Cycle,因为它在确认趋势强度并在穿越关键水平(如25/75)时生成买入/卖出警报方面具有精确性,在横盘市场中减少常见虚假信号. 通过将Stochastic应用于MACD值,它创建一个限定振荡器 (0-100),预见周期转折,帮助识别新兴趋势中的早期入场或耗尽点附近的出场. 优势包括改进的决策,用于剥头皮、波段或持仓交易,通过及时警报提高胜率,以及跨资产的多功能性—警报确保您捕捉机会,而无需持续监控,在趋势和周期条件下潜在提升盈利能力. MQL 产品安装指南 | 在 MT4/MT5 上更新购买

Lucky Beauty mt4 是一款会给您带来惊喜的智能交易系统。顾问的工作是完全自动化的,不需要人工干预。下载免费的演示版并尝试根据历史数据测试 Expert Advisor 并亲眼看看它的有效性。 Lucky Beauty mt4 Expert Advisor 分析过去一段时间的市场,并根据我们公司专家嵌入到 Expert Advisor 中的算法确定可能进入市场的数学预期。打开交易订单后,顾问会监控市场状态,只有在交易有利可图时才会关闭订单。顾问使用的市场技术分析使他能够进行有利可图的交易。 顾问的工作不受世界新闻的影响。 EA 在操作期间不会产生错误,并且对其操作没有故意限制。 通过打开顾问,您可以选择风险级别 - 中等、高和非常高。随着风险的增加,利润也会增加。通过下载免费的试用版,您将能够自行测试所有级别的风险。 注意 - 顾问的最低存款为 100 美元。 使用幸运美女 mt4 顾问的建议: - 使用欧元/美元对; - 使用小时间隔 H1。 在屏幕截图中显示了测试历史数据和不同风险级别时的测试结果和图表。
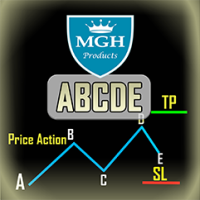
ABCDE指标:
这个指标基于价格行为的主要ABC模式(即突破、回撤、运动)。这些模式类似于上涨基础上涨模式,需要进行趋势分析和背离分析等一系列分析来检查并发出准确的信号。它将提供相当准确的交易信号,并告诉您什么时候开仓和平仓最为合适。它可以应用于任何金融资产:外汇、加密货币、贵金属、股票和指数。
主要特点:
• 非常易于使用
• 多时间框架警报
• 固定价格的止损和获利订单。
• 可以与任何交易工具一起使用(外汇、差价合约、期货等)
• 电子邮件提醒
• 电话通知
• 它将提供相当准确的交易信号,并告诉您何时最好开启和关闭交易。
• 在图表上显示开仓线、止损、获利。
• 有免费演示版本。
推荐设置:
• EURUSD,M15(15分钟图表)
• 显示趋势验证:True
• 显示增量蜡烛图:True
什么是理想的入场点?
进入交易的最佳点是由星形和钻石形态所代表的E点。这些模式将在设置中启用“显示趋势验证”和“显示增量蜡烛图”时显示出来。
我该如何使用ABCD指标进行交易?
在交易终端中安装该指标。 在设置中调整

“Scalping Monster EA”智能交易系統基於掛單策略和高效跟踪的智能算法。 機器人正在使用 iSAR、iBullsPower、iBearsPower 指標尋找最有效的開單點。 機器人還分析支撐和阻力水平。 根據這些數據,機器人決定何時以及在什麼方向放置掛單。 掛單放置在支撐位,如果它們被觸發,機器人將開始通過修改其止損來伴隨未結訂單。 機器人試圖使每筆交易至少達到盈虧平衡水平。 這種策略在真實交易中被證明是最有效的。
交易設置。 下載這些設置並測試它們的工作: https://www.mql5.com/en/blogs/post/752897
檢測結果: 利潤係數:2.12 相對回撤:23% 盈利交易:96% 虧損交易:4% 初始餘額:1000$ 最終餘額 2060$ 測試期為2021年至2023年。
機器人優勢: 使用交易者在設置中指定的固定手數。 不使用鞅 不使用網格。 不使用對沖。
交易建議: 貨幣對 GBPUSD。 M5 時間表 最低餘額 1000; ECN 賬戶類型(五位數)。 GBPUSD 貨幣對的價差不超過 3 個點。
機器人設置: BP - i

1. TrendLine Monitoring : The EA can detect immediate breaks above or below any specified trend line drawn on the chart. It can monitor up to 25 trend lines simultaneously.
2. Automatic Take Profit and Stop Loss : The EA includes functionality for setting predetermined levels of take profit and stop loss. This feature helps to establish and maintain favorable risk-to-reward ratios.
3. Trailing Stop : A trailing stop mechanism is implemented, allowing you to secure profits by automatically adj

Hello. I'm a Japanese engineer and have been trading since 2016.
I have developed automatic trading software many times so far, but I did not sell because of poor performance.
Finally, an automatic trading software that seems good has been completed.
* What I present here is past performance based on backtesting, and does not guarantee future profits.
Live Trading: see My signal page
The back test results in MT4 are as follows ↓ period: 2016/01/01-2023/04/30
Final profit: 478.46%(fun

The Breaker Blocks with Signals indicator aims to highlight a complete methodology based on breaker blocks. Breakout signals between the price and breaker blocks are highlighted and premium/discount swing levels are included to provide potential take profit/stop loss levels.
This script also includes alerts for each signal highlighted.
SETTINGS
Breaker Blocks
Length: Sensitivity of the detected swings used to construct breaker blocks. Higher values will return longer term break

Urgent reminder> Only 13 copies remaining for the price to double on all renting options. Get your copy Today!
Introduction Dear Traders, I am always working to come up with tools that may help you to become a better trader and investor. Due to my experience in trading and market analysis and trading software design and development, I am glad to introduce to you my other tool called " Amazing Entries Indicator ". The Indicator is designed in a way that it combines different strategy to provide

INTRODUCTION There is so many trading strategies, but each pair have different characteristic. For example, EURUSD characteristic is zone to zone, break and retest, and so many sideways. GBPUSD seems like same with EURUSD, but have much spikes and larger range. XAUUSD also have same zone to zone, but with very long range between zone, breakout without retest, following trend strategies is much safe for XAUUSD. JPY pairs such as USDJPY, EURJPY, GBPJPY have much trend rather than sideways. And man

Everything is very simple here. I have never understood indicators without external parameters. And the Awesome Oscillator is no exception. Now you can customize this indicator to suit your needs and strategies.
Reference: The Awesome Oscillator indicator shows the distance in points between two moving averages (fast and slow).
The AO_Robex indicator has in its parameters a change in the period of moving averages. The default parameters are the same as in the standard indicator.
FREE

FOREX market is life itself. There is no such thing as a stable life. The same applies to FOREX. It's always about staying within a certain price range, but occasionally, there are significant deviations from that range.
Life is no different. During those times, it's important to wait patiently. Eventually, things will return to a stable range. When there is a major deviation from the range, it's an opportunity. You shouldn't miss out on this chance.
This robot uses the Envelope indicator to e
FREE

The standard RSI indicator is very helpful in identifying overbought or oversold areas during a flat, but gives a lot of false signals when the market is trending. For example: during an uptrend, the standard indicator often enters the "oversold" zone and extremely rarely (most often, when the trend has already ended) enters the "overbought" zone. This indicator takes into account the trend movement and, with the selected settings, can enter the zone opposite to the trend direction, giving a sig
FREE

This EA has been designed to achieve stable trades regardless of market fluctuations. The optimal time frame for this EA is M5. It calculates the price changes in higher time frames, such as H1 and H4, and looks for entry points after a significant trend has occurred and the price starts to retrace.
It is recommended to set wider take profit and stop loss levels. This setup works well for one trade per day. If a trade ends in a loss, the EA waits for an opportunity to re-enter with double the l
FREE

EA BUMAN may not have a high frequency of entries, but it can provide stable profits. The entry logic is quite simple. It only uses one moving average line.
It enters trades when the candlestick crosses the Exponential Moving Average (EMA) line. If the closing price of the candlestick is above the moving average line, a BUY entry is executed. If it is below the moving average line, a SELL entry is executed.
To increase the profit-taking win rate, it is important to effectively use the Break Ev
FREE

Have you ever lost your mind? Cause you open multiple positions try to revenge the market or sometime open double, triple position to maximize the profit? if you are win it is okay, but how about if you lose? So "MaxOrdersWarning" may remind your consciousness not to open too many orders in the same time.
How to use - Drag and drop Indicator on your chart. - Set the limitation number of your position ( per Chart Symbol that you open )
Then what's next?
If you reaches the limit, the background
FREE


The standard RSI indicator is very helpful in identifying overbought or oversold areas during a flat, but gives a lot of false signals when the market is trending. For example: during an uptrend, the standard indicator often enters the "oversold" zone and extremely rarely (most often, when the trend has already ended) enters the "overbought" zone. This indicator takes into account the trend movement and, with the selected settings, can enter the zone opposite to the trend direction, giving a sig

Any and all liability for risks resulting from investment transactions or other asset dispositions carried out by the customer based on information received or market analysis is expressly excluded by Tradeciety. All the information made available here is generally provided to serve as an example only, without obligation, and without specific recommendations for action. It does not constitute and cannot replace investment advice. We, therefore, recommend that you contact your personal financial

Introducing Ranger ADX Expert Advisor: The Ultimate RSI Trend-Following Solution
Are you in search of a reliable and robust Expert Advisor (EA) that harnesses the power of RSI trend-following indicators? Look no further! We are proud to present Ranger ADX, an advanced EA developed based on a winning combination of the Relative Strength Index (RSI) and Moving Average (MA) indicators. With its exceptional capabilities, Ranger ADX offers a powerful solution for identifying and capitalizing on tren

This Wonders Real Arrow indicator is designed for signal trading. This indicator generates trend signals.
It uses many algorithms and indicators to generate this signal. It tries to generate signals from the points with the highest trend potential.
This indicator is a complete trading product. This indicator does not need any additional indicators.
The indicator is never repainted. The point at which the signal is given does not change. When the signal comes the arrows are put back one c

The "AI Forecast" indicator is the result of a unique experiment in which I asked an AI how to create the best indicator to anticipate the market. The AI suggested measuring the past history of the price and its reactions to different levels, and then calculating the probabilities of the price reaction in the future.
With this idea, I designed with the help of another AI the "AI Forecast" indicator, which adapts to any MetaTrader chart and shows you three lines: one for entry and two for possi

LIUK EQUALIZER FREE for Limited Time! (until end of June 2023)
Averaging and Martingale strategy may cause LOSS ALL OF YOUR INVESTMENT. Use wisely at your own risk.
There are so many EA that can do averaging, because EA can instantly calculate and make decision. But at the end the Averaging and Martingale strategy will lose by the Market Trend.
With this LIUK EQUALIZER (this EA), I tried to minimize that risk with below detailed features. 1. This EA use H1 time frame . So you can do Back Test

GOLD H1 Simple Martingale that works on daily swing levels, medium DD, TP and SL defined on the basis of certain pre-set calculations in the algorithm, executes one trade at a time, weekly trading no overnight on weekends, possibility to establish customized exit times, possibility of customize money management. average return of 30.43% per year with the factory settings of the V1, it is always constantly updated, it is recommended to use it with a GMT +2 server TESTED SINCE 2008 It's recommend
This EA has no stop loss. All risks are at your discretion.
This is Free EA, It can make you profitable if you use it carefully. Please don't ask for the MQ4 file, I'm using it to develop other robots.
Gegenpressing EA is a fully automatic Expert Advisor for Scalping Trading on XAUUSD timeframe M1 but also in others. The basic strategy starts with Market order in Trend Following, so this EA Follow the Trend . M1 Trend…. very very fast.
If you like this EA and want to help me develop
FREE
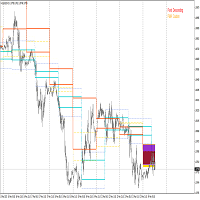
This indicator is based on Mr. Mark Fisher's ACD strategy, based on the book "The Logical Trader."
- OR lines - A lines - C lines - Daily pivot range - N days pivot range - Customizable trading session - Drawing OR with the desired time Drawing levels A and C based on daily ATR or constant number - Possibility to display daily and last day pivots in color zone - Displaying the status of daily PMAs (layer 4) in the corner of the chart - Show the order of daily pivot placement with multi-day pi
FREE

*This is TradingView indicator converted to mql4*
The SuperTrend V indicator is a popular technical analysis tool used to identify trends and potential trend reversals in financial markets. It is based on the concept of the SuperTrend indicator but incorporates additional features and variations. The SuperTrend V indicator uses a combination of price action and volatility to determine the trend direction and generate trading signals. Here are the key components and features of the indicator: Ca
FREE
This EA has no stop loss. All risks are at your discretion.
CHIQUITA EA is a fully automatic Expert Advisor for Scalping Trading on XAUUSD timeframe M1. The basic strategy starts with Market order in Trend Following, so this EA Follow the Trend . M1 Trend…. very very fast. MT5 version Recommendations The Expert is programmed to work on XAUUSD M1, but you can use all others timeframes with the appropriate settings. An ECN broker is always recommended A low latency VPS is always r
FREE

This EA has no stop loss. All risks are at your discretion.
Fed Chair Gringott EA is a fully automatic Expert Advisor for Scalping Trading on XAUUSD timeframe M1. The basic strategy starts with Market order in Trend Following, so this EA Follow the Trend .
Fed Chair Gringott EA is similar to a Plug And Play package, please test it yourself. hundreds of times before making a purchase. I choose how it works. You choose the capital to invest. If you like it, buy it. Investing is risky
FREE

*This is tradingview indicator converted to mql5*
The Trend Magic Indicator is a popular technical analysis tool used to identify the direction of a market trend and potential trend reversals. It is a versatile indicator that can be applied to various financial instruments and timeframes. The Trend Magic Indicator consists of a combination of moving averages and a volatility-based filter. It aims to smooth out price fluctuations and provide a clearer visualization of the underlying trend. Here
FREE
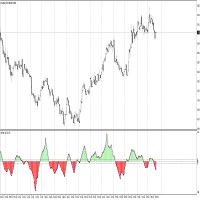
The Fisher Transform is a technical indicator created by John F. Ehlers that converts prices into a Gaussian normal distribution. The indicator highlights when prices have moved to an extreme, based on recent prices. This may help in spotting turning points in the price of an asset. It also helps show the trend and isolate the price waves within a trend. The Fisher Transform is a technical indicator that normalizes asset prices, thus making turning points in price clearer. Takeaways Turning poi
FREE
The JagzFX Gap Indicator acts as your vigilant companion, scanning the market with precision and alerting you to the presence of gaps as soon as a new candle is formed. Set your desired gap size, and the indicator will highlight both filled and unfilled gaps, on any symbol and on any timeframe. By analysing the presence of unfilled gaps, you gain valuable insights into market behaviour, allowing for more informed trading decisions. Combine JagzFX Gap Indicator with JagzFX OnePin to create a ma
FREE
El sistema IBT-R.BOLLINGER hace uso de tres indicadores, el RSI, las Bandas de Bollinger y el volumen para operar diversos activos en M5. El indicador Índice de Fuerza Relativa, RSI por sus siglas en inglés, es un oscilador de tipo momentum que nos permite distinguir cuando el precio se encuentra en zonas de sobrecompra o sobreventa. Para interpretar este indicador, establecemos dos zonas: 1. Zona de sobreventa. Cuando el RSI toma valores inferiores al nivel 20 indica una señal de compra. 2. Zon

Current Price: $349--> (1 more copy then Next price $449) Live signal: https://www.mql5.com/en/signals/1590997 Fish n Grid – an automatic trading robot that works on multiple currencies. It takes advantage of the market's mean reversion characteristic with a calculated, dynamic, multicurrency grid system. Main features: Fully automatic Easy one chart setup Multicurrency grid profolio Basically trading everyday Calculated parameters for each currency Dynamic stoploss occasionally during nig

Ranger EA is the advanced grid system which already works on demo accounts for months. Instead of fitting the system to reflect historical data (like most people do) it was designed to exploit existing market inefficiencies. Therefore it is not a simple "hit and miss" system which only survives by using grid. Instead it uses real market mechanics to its advantage to make a profit. Link to the Signals live results Link to the MT5 version Supported currency pairs: AUDCAD, AUDNZD, NZDCAD, C
El sistema IBT-D .BOLLINGER hace uso de tres indicadores, el Delta, las Bandas de Bollinger y el volumen para operar diversos activos en M5. El sistema Delta+Bollinger hace uso de dos indicadores técnicos, el indicador Delta y las Bandas de Bollinger. El indicador Delta mide la diferencia entre compradores y vendedores, dando un valor cuantitativo de la agresividad de los compradores y vendedores. En la plataforma MetaTrader4, el Instituto de Inversiones Bursátiles y Trading ha desarrollado el i

My Expert Advisor trade Gold (XAUUSD) on M5 time frame, Base on Greedy hedging strategy. stop loss 0.570 usd/0.01 lot take profit 0.770 usd/0.01 lot Live signal: coming soon.
Recommend broker: Exness (Pro account), 3 digit broker, stoploss = 570; takeprofit = 770; 125 <spread <260. Min deposit: from 70 usd - From 70 usd to 1800 usd after a week. (backtest but worthy to try) Input Setting to test my EA: - Stoploss: 0.570 usd/0.01 lot (adjust to the correct ratio and do not change) -
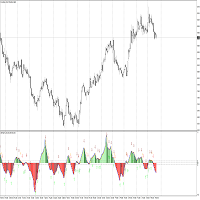
The Fisher Transform is a technical indicator created by John F. Ehlers that converts prices into a Gaussian normal distribution. The indicator highlights when prices have moved to an extreme, based on recent prices. This may help in spotting turning points in the price of an asset. It also helps show the trend and isolate the price waves within a trend. The Fisher Transform is a technical indicator that normalizes asset prices, thus making turning points in price clearer. Takeaways Turning poi
El sistema IBT-ATR.120 hace uso de dos indicadores, el ATR y el Ratio de Volatilidad para operar diversos activos en M5. El indicador Average True Range, conocido como ATR por sus siglas en inglés, fue desarrollado por Wilder (1978), junto con otros indicadores como el RSI o el sistema parabólico. Para definir el rango verdadero (True Range) el autor distingue entre tres situaciones distintas: - Primer Rango. Distancia entre el máximo de la vela actual y el mínimo de la vela actual. -

'Ride of the Day' is a Scalper EA which identifies breaking points in the price such as support/resistances and allocate a potential trigger to open a position in the same direction than the price... these are expected to open and close quickly, as part of a Scalper behavior. All potential positions not triggered, will expire themselves as per Market Schedule Parameters. Remind, it is a Scalper, so give it time to reach good Market conditions and it will grow exponentially with the appropriated

Trend expert with a large number of indicators and the digital method in determining the opening of deals with the opening of multipliers deals when the trend reverses Work on the five-minute timer Work as the settings or control it if you like Explains how the expert works. Max Spread = 0.3 Broker link from here
https://one.exness-track.com/a/lmeqq9b7
Lot1: Manual Lot Size Auto_Lot: Set true to automatically calculate optimal Lot Size based on risk preferences, Set False if you want to use

Panda Gold EA is a fully automated Expert Advisor is designed to execute fast and precise trades using scalping techniques such as trend following and capitalizing on short-term price fluctuations.Panda Goldis a very effective trading strategy, professionally developed especially for trading GOLD (XAUUSD).
Real account: https://www.mql5.com/en/signals/1772310
Panda Gold is built on a solid and well-designed trading strategy , runs best on the XAUUSD currency pair. However, thanks to its fle

MAYA is a smart trading system that uses a grid strategy and has been working well on real accounts for many years. Unlike other systems that are made to fit past data, Maya was built to take advantage of real, ongoing patterns in the market. So, it’s not just guessing and hoping to win. It actually understands how the market works and uses that to make money. It just needs a onetime setup and then you can relax and see its working. LIVE ACCOUNT STATS CAN BE CHECKED ON MYFXBOOK RUNNING FR

*This is tradingview indicator converted to mql4*
The CM Slingshot System Indicator is a trading tool that aims to identify potential trade setups based on market volatility and price action. It is designed to help traders spot entry and exit points in trending markets. The CM Slingshot System Indicator combines multiple indicators and techniques to generate trading signals. Here are the key features and components of the indicator: Bollinger Bands: The indicator incorporates Bollinger Bands, w

*This is tradingview indicator converted to mql4*
The Chandelier Exit Indicator is a popular technical analysis tool developed by Chuck LeBeau. It is designed to help traders identify potential exit points for their trades based on market volatility and the concept of trailing stops. The Chandelier Exit Indicator consists of three main components: Average True Range (ATR): The indicator utilizes the Average True Range, which measures market volatility. The ATR calculates the average range betwe

This indicator provides essential information in a simple table about market range and identify whether the market has touched important pivot levels and breakout previous high/low. This version is still in the testing phase and is being offered for free and can only be used for a period of 3 months. We value your feedback to help us improve this application.
FREE

Need help managing your risk? Use Risk Helper
Drag this script onto your pair, enter your desired pip target, and open a trade. Once your pip target has been reached the Risk Helper will take partials profits, move the stop loss then double the profit target so it can do this process again on the next hit. A notification will be sent for every action the Risk Helper takes. Once the trade has been reduced to 0.01 lot size, Risk Helper will proceed to only move your stop loss for every pip tar

Introducing the "KFX Trade Manager" expert advisor for MetaTrader 4 (MT4), a comprehensive solution for advanced trade management and risk control. This powerful tool is designed to enhance your trading experience by automating various aspects of order handling, profit optimization, and alert notifications. With the "KFX Trade Manager," you can take your trading to the next level and streamline your operations for improved efficiency and better risk management. Key Features: Trade Management Set
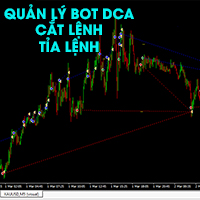
Bot chuyên quản lý và trị các thể loại DCA Kích hoạt bot theo level 1, level 2, level 3 Kích hoạt theo tiền hoặc theo % tài khoản tùy chọn Tất cả tự động Cắt tỉa lệnh theo cặp giúp hạ lot Đóng cắt lỗ thông minh Khóa lợi nhuận ngày Dùng lợi nhuận để đóng dần lệnh lỗ Giúp bot DCA về bờ sau 2-4 nhịp sideway Nhiều phương án đóng - cắt tỉa lệnh thông minh Phù hợp với tất cả các loại bot DCA, Martingel, Grid... Giúp không bay màu tài khoản Em chưa có thời gian viết kỹ tính năng. Mong mọi thông cảm. E
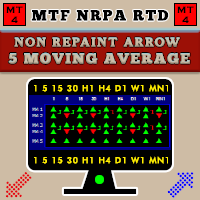
[V 1.00] MTF NRPA 5 移动平均 RTD 已发布!
非重绘箭头实时仪表板。
如果您正在寻找最好的移动平均线指标,那么您来对地方了。 通常人们会设置两条移动平均线,因为两条移动平均线的交点(交叉)将决定下一个价格趋势的方向。 如果快速移动平均线与慢速移动平均线相交且快 > 慢则趋势向上。 相反,如果快速移动平均线与慢速移动平均线相交且快 < 慢,则趋势向下。 两条均线的缺点是看不到长期趋势。 这就是我开发此交易工具的原因。
解释如下:
在这个交易工具中,我使用了五个移动平均线。 是的,五个! 默认情况下,我将 MA 1 和 MA 2 设置在较大的时间范围内,即 H1。 MA 1 和 MA 2 的交集意味着 H1 时间帧上有趋势变化。 然后 MA 3 和 MA 4 我在当前时间范围(小)上设置,例如,您在 M5 上打开图表。 MA 3 和 MA 4 的交叉点表示当前时间范围 (M5) 有趋势变化。 然后为了确认趋势运动,我在当前时间范围内设置了 MA 5。
这个交易工具有很多令人惊奇的东西:
您可以根据自己的喜好更改五个 MA 的时间范围。 您可以更改线条样式
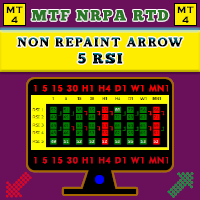
[V 1.00] MTF NRPA 5 RSI RTD 已发布!
非重绘箭头实时仪表板。
如果您厌倦了使用各种 RSI 指标但发现它们不准确,那么试试这个工具。 通常人们只设置 1 个 RSI 来确定一个时间范围内的 OBOS 水平。 坏消息是您无法同时看到不同时间范围内的 OBOS 水平和趋势。 这就是我开发此交易工具的原因。
解释如下:
在这个交易工具上,我使用了五个 RSI。 是的,五个! 默认情况下,我在较大的时间范围内设置 RSI 1 和 RSI 2,即 M30。 RSI 1 和 RSI 2 的交集意味着 M30 时间框架上有趋势变化。 然后我在当前(小)时间范围内设置 RSI 3 和 RSI 4,例如您在 M5 上打开图表。 RSI 3 和 RSI 4 的交集意味着当前时间帧 (M5) 有趋势变化。 然后为了确保趋势运动,我在更高的时间框架 (H1) 上设置了 RSI 5。 当 RSI 5 越过 50 水平(您可以设置时间范围和 OBOS 水平)时,箭头将出现。
这个交易工具有很多令人惊奇的东西:
您可以根据自己的意愿更改五个 RSI 时间范围。 您可以更改线

发现价格行动管理风险的力量,优化您的止损! 您是否遇到过这样的情况:您确切知道何时进入交易,但对于何时退出感到犹豫不决?别担心,您并不孤单!许多交易者每天都面临这个挑战。 好消息是,我们基于价格行动的风险管理工具正是为了解决这个问题而诞生。当您专注于识别最佳的入场点时,我们的工具会接管并帮助您管理交易的退出。 我们基于价格行动的风险管理工具不仅仅将初始止损设置在最近的顶点/底点上,它还会跟随市场趋势,随着新的顶点和底点有利于趋势的形成,自动调整止损位置,确保您获得尽可能多的利润。 借助这种可靠的方法,您消除了确定退出时机的不确定性,并充分利用市场提供的利润机会。 向伟大的交易者们(如 Jesse Livermore, Richard Dennis, Paul Tudor Jones和Larry Williams )看齐,他们在交易中使用顶点和底点来设置止损。现在,您也可以通过我们的工具获得这种强大的策略。 立即尝试我们的MetaTrader价格行动工具,摆脱对退出位置的担忧。专注于您交易的入场,让我们负责追踪止损,根据市场的新顶点和底点有利于趋势的形成进行自动调整。安全高效地将您的交易

Choppines 機器人作為指標載入到 MT4 指標資料夾中
建議使用5分鐘的蠟燭計時,建議的機器人到期時間為5分鐘。
機器人可設定為向 MT2、MX2、PRICEPRO 平台發送訊號。要發送訊號,您必須使用我們要使用的平台的連接器程式。
若要在連接器上安裝,請執行下列程序(隨附映像描述 MT2 平台連接器的配置):
1.- 在 MT4 平台上載入任何貨幣對
2.- 將蠟燭放在 M5 時間上
3.- 載入或拖曳 Robot-Chopiness.ex4 檔案到螢幕上開啟的貨幣對。
4.- 將MT2 連接器(MX2,或PRICEPRO,一次一個)載入到螢幕上,設定檔名稱、訊號名稱、買入緩衝區(0)、賣出緩衝區(1),設定機器人到期時間= 5 分鐘。
5.- 將此配置保存在模板中,以便模板將其自動加載到您要使用的所有貨幣對中。
波動機器人也可以在場外交易市場工作,您現在可以使用我們的指標來操作綜合指數

福克斯人工智能是一个完全自动化的系统,在夜间进行货币交易,使用机器学习和智能算法,在滚动期间打开交易并在12小时内关闭。它基于一个名为Kras的深度学习应用,该应用在Tens平台上运行。Kras被包括NASA、YouTube和CORN在内的组织广泛使用。自2003年以来,福克斯人工智能系统一直都很成功,并且不使用马丁格尔或网格策略等风险资金管理技术。在你购买后,你将收到算法的优化。您还将收到关于风险调整的建议,并能够开设风险较高或保守的交易账户,优化分配您的交易保证金。作为奖励,我们将建议与哪些经纪公司合作更有利可图。即使没有额外的知识,该交易系统也很容易运行;我们将就所有问题向您提供建议。在未来,这个顾问的价格将被提高,以保持其独占性并限制用户数量。 实时信号 https://ec5a.short.gy/ndjQXJ 一般设置: 多货币专家顾问,目前的工作对是M1时间框架: AUDCAD, EURAUD, EURCAD, EURCHF, EURGBP, EURUSD, GBPAUD, GBPCAD, GBPCHF, GBPUSD, USDCHF,可以通过设置开关为false来禁用。
下载该指标、测试其功能并发表意见的每个人都将收到一个免费机器人作为礼物,该机器人可以根据该指标的信号进行交易。
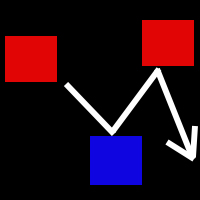
“Scalping squares pro”指标是一种旨在使用剥头皮策略寻找价格反转点的指标。 该指标在图表上以彩色方块的形式显示价格反转点。 掌握了这些信息后,交易者就有机会有效地为任何货币对的买卖开启交易操作。 该指标适用于所有货币对,包括金属和加密货币。 “Scalping squares pro”显示枢轴点甚至价格修正点。 使用该指标的整个交易策略基于在指标显示信号时及时开单。
该指标的好处: 不重绘其信号 显示枢轴点和价格修正 适用于所有货币对 为使用剥头皮策略进行交易而创建。
指标设置: Rsi_Short - 快速 RSI 周期。 Rsi_Long - 缓慢的 RSI 周期。 MA_Period - 标准 EMA 移动的周期。 MACD_FastEMA - 快速 MACD 周期。 MACD_SlowEMA - 缓慢的 MACD 周期。 MACD_SignalSMA - MACD 信号线周期。 type - RSI 指标的价格类型。 size_arrow

The Visual Volatility Clustering indicator clusters the market based on volatility. The indicator does not redraw and gives accurate data, does not use closing prices. Uses the opening prices or the highs or lows of the previous completed bar. Therefore, all information will be clear and unambiguous. The essence of the indicator is to divide the price market into certain areas according to a similar type of volatility. This can be done in any way. In this example, the indicator is configured fo

The Visual Volatility Clustering indicator clusters the market based on volatility. The indicator does not redraw and gives accurate data, does not use closing prices. Uses the opening prices or the highs or lows of the previous completed bar. Therefore, all information will be clear and unambiguous. The essence of the indicator is to divide the price market into certain areas according to a similar type of volatility. This can be done in any way. In this example, the indicator is configure
MetaTrader市场是一个简单方便的网站,在这里开发者可以出售自己的交易应用程序。
我们将帮助您发布您的产品,并向您解释如何为市场准备您的产品描述。市场上所有的应用程序都是加密保护并且只能在买家的电脑上运行。非法拷贝是不可能的。
