适用于MetaTrader 4的付费技术指标 - 121
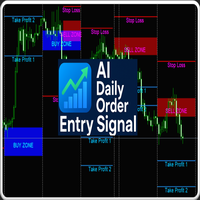
H1 indicator with daily BUY/SELL zones, Stop Loss, and two Take Profit levels. Includes HUD (spread, timeframe, countdown). No popups, no DLLs. AI Daily Order Entry Signal — H1 Only
This MT4 indicator draws clear daily BUY and SELL zones directly on your H1 chart. Each zone includes predefined Stop Loss, Take Profit 1, and Take Profit 2 levels, giving you a complete daily trade plan without extra setup.
How to Use - Attach to any H1 chart (works with forex, crypto, indices, metals). - Follow

Purpose :
This indicator displays real-time risk and target profit exposure of your open/pending trades directly on the chart, with optional multi-currency conversion (e.g., USD → INR or any currency pair you enter). Main Features Risk Tracking Calculates the total risk exposure if Stop Loss (SL) is hit. Expressed in Account Currency (e.g., USD) plus optional conversions. Target Profit Tracking Sums up potential profit to Take Profit (TP) (only for orders where TP is set). Useful for comparin
## RSI Divergence Printer Indicator This MetaTrader 4 (MT4) non repainting indicator automatically identifies and prints RSI divergences directly onto your price chart. This indicator can be used at any timeframes and is suitable for scalping, daytrading and swingtrading. In short, it looks for moments when the price is moving in one direction, but the underlying momentum is moving in the opposite direction, signaling a potential trend reversal. ## Explanation of the Indicator This tool, the
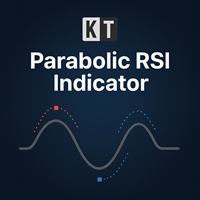
KT Parabolic RSI 将抛物线SAR直接叠加在RSI线上,用来突出可能的市场转折点。传统的RSI超买和超卖读数已经提示潜在的反转,但加入PSAR过滤器后,能有效去除大量噪音,使信号更加清晰和可靠,从而为交易者提供更稳健的入场和出场机会。 大方块信号: 当RSI处于超买或超卖区域时,Parabolic SAR翻转。这通常标志着高概率的市场转折。 小方块信号: 当RSI位于中性区间时出现的SAR翻转。将其视为低概率提示,更适合用于部分止盈或顺势跟随。
功能特点 将RSI动能和Parabolic SAR趋势翻转整合在同一个窗口中,无需再使用两个分离的指标。 出现在RSI窗口中的方块标记会同步显示在主图表上,这样您可以在观察价格走势的同时捕捉到信号。 结合K线形态分析和RSI-SAR定量信号,帮助您在入场前确认图表形态的可靠性。 支持自定义RSI周期、Parabolic SAR步长与最大值,以及超买和超卖阈值,以便适应不同交易风格与市场环境。 提供弹窗、声音、邮件和移动推送提醒,让您即使不在电脑前也能及时掌握每一个信号。
为什么结合RSI和Parabolic SAR有效 RSI
Zeiierman 自适应移动平均线是一种技术分析工具,旨在通过自适应趋势分析来识别交易机会。这个 Metatrader 版本基于 Zeiierman 在 TradingView 上的原始指标,它结合了多种分析方法,以提供直观的市场评估。
技术特征 使用基于市场波动性的自适应平滑算法 计算效率比率 (ER) 以动态调整灵敏度 包含用于衡量波动性的 Sigma 通道 通过彩色移动平均线显示趋势方向 提供可配置的趋势变化和信号提醒选项
功能
该指标处理市场数据以: 根据波动性条件调整平滑系数 通过颜色变化显示趋势方向(看涨、看跌或中性) 使用基于 Sigma 的条件生成潜在的进场和出场信号 提供可选的 K 线着色以便更好地可视化趋势
预期使用场景 可用于趋势跟随和均值回归策略 适用于外汇、股票、大宗商品和加密货币 为市场趋势状况提供直观参考
免责声明
交易涉及重大风险。本指标仅供参考。用户需对其交易决策承担全部责任。
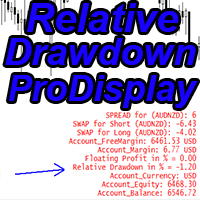
Crypto_Forex MT4 指标“相对回撤专业显示”,实用的交易工具。
对于使用网格交易系统的交易者来说,这绝对是必备指标!!!
- 相对回撤专业显示指标以百分比显示您账户当前的相对回撤或浮动盈利。 - 内置 PC 和移动端提醒,触发级别可调。 - 它显示与其关联的外汇对的当前点差和隔夜利息。 - 指标还显示账户余额、账户净值和保证金。 - 指标值可在图表任意位置显示: 0 - 左上角,1 - 右上角,2 - 左下角,3 - 右下角。 - 还可以设置颜色和字体大小。 - 使用相对回撤显示,交易者无需再使用计算器。
// 优秀的交易机器人和指标可在此处获取: https://www.mql5.com/en/users/def1380/seller 这是仅在 MQL5 网站上提供的原创产品。
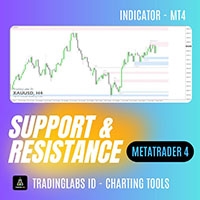
Classic Support & Resistance Tired of drawing support and resistance levels manually?
Now you can save time and trade with confidence using the Classic Support & Resistance Indicator . This tool automatically plots key support and resistance zones on your MT4 chart with high accuracy and clean visualization. Designed especially for traders who rely on Breakout – Retest Entry strategies and market structure analysis. Key Features: Auto Support & Resistance Zones
Automatically identifies and p

Magical Arrow Indicator – Clear & Reliable Signals The Magical Arrow Indicator is a non-repainting, trend-following tool that gives you crystal-clear Buy and Sell signals .
It high-probability reversals and entries . No more guesswork – just follow the arrows on your chart! The Magical Arrow Indicator is a powerful, easy-to-use trading tool that helps you catch the most profitable Buy and Sell opportunities in the Forex market.
It is designed for beginners and professional traders , giving y
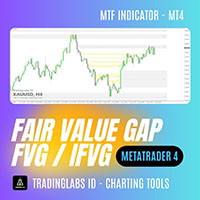
Fair Value Gap (FVG) & Inversion Fair Value Gap (iFVG) – TradingLabs ID In the ICT (Inner Circle Trader) concept , a Fair Value Gap (FVG), also known as Imbalance , occurs when price moves too quickly, leaving behind a gap without sufficient order balance. These areas are highly valuable for professional traders as they often signal potential retracement or entry zones with high probability. The FVG & iFVG Indicator is designed to automatically detect Fresh, Mitigated, and Inversion Fair Val
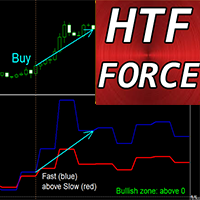
适用于 MT4 的 Crypto_Forex 指标 HTF 力度震荡指标。
- HTF 力度指标是一款强大的多时间框架交易指标。HTF 代表“更高时间框架”。 - 力度指数是将价格和交易量数据合并为一个数值的顶级指标之一。 - 更高时间框架的数值可以显示趋势方向(下行趋势 - 低于 0;上行趋势 - 高于 0)。 - 快速力度指标 - 蓝线,慢速力度指标 - 红线。 - 买入信号 - 快线向上穿过慢线,且两者均高于 0(见图)。 - 卖出信号 - 快线向下穿过慢线,且两者均低于 0(见图)。 - 指标内置移动端和 PC 端警报。
// 优秀的交易机器人和指标可在此处获取: https://www.mql5.com/en/users/def1380/seller 本产品为独家产品,仅在 MQL5 网站上提供。
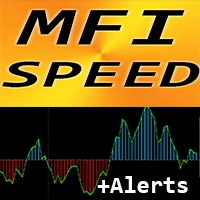
适用于 MT4 的 Crypto_Forex 指标“MFI 速度”,无需重绘。
- 该指标基于物理方程计算。MFI 速度是 MFI 本身的一阶导数。 - Money_Flow_Index (MFI) 是一个技术振荡指标,它利用价格和成交量数据来识别超卖和超买区域。 - MFI 速度非常适合利用动量入场点进行剥头皮操作,使其顺应主趋势方向。 - 建议结合合适的趋势指标使用,例如标准 EMA(如图所示)。 - MFI 速度指标显示 MFI 本身改变方向的速度,非常灵敏。 - 如果 MFI 速度指标的值小于 0:速度为负;如果 MFI 速度指标的值大于 0:速度为正。 - 指标内置移动端和 PC 端警报。
// 优秀的交易机器人和指标可在此处获取: https://www.mql5.com/en/users/def1380/seller 这是仅在 MQL5 网站上提供的原创产品。
Order Block + Fair Value Gap (FVG) Indicator Multi-Timeframe Order Block + FVG Tool In the ICT (Inner Circle Trader) concept , Order Blocks (OB) + Fair Value Gaps (FVG) are among the most critical areas used by professional traders to read market structure, identify supply & demand zones, and spot high-probability entry points. The Order Block + FVG Indicator automatically detects and displays both Order Block zones and Fair Value Gaps directly on your MT4 charts. With multi-timeframe support
ICT Market Time Cycle – Complete Session & Time Window ICT Market Time Cycle is a professional trading indicator designed to help traders follow the ICT (Inner Circle Trader) methodology with ease.
It automatically displays the main market sessions (Asia, London, and New York), along with Killzones, Silver Bullet windows, and Macro times directly on your chart. With this tool, you no longer need to calculate session times manually – everything is plotted automatically in a clean and professio

Trend Pulse One is a new generation indicator based on an improved version of Parabolic SAR, supplemented with arrow signals. Its purpose is to simplify the process of trend analysis and provide the trader with clear, visually understandable entry and exit points.
The main difference from the standard SAR is that Trend Pulse supplements the SAR lines with arrows that signal a change in trend direction. This makes the indicator convenient for visual analysis and application in real trading.
ICT Silver Bullet – Time Window Indicator The ICT Silver Bullet indicator automatically marks the ICT Silver Bullet time windows on your chart, helping you stay focused on the highest-probability setups defined by the ICT methodology. This tool is especially powerful when combined with a Fair Value Gap (FVG) indicator – simply wait for an FVG setup to form inside the Silver Bullet window, and you’ll have a precise time-based confirmation for your entries. Key Features: Automatic Silver Bul
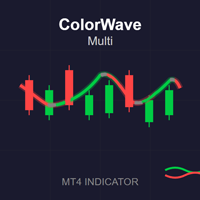
ColorWave Multi MA The ColorWave Multi MA is a highly configurable Moving Average (MA) indicator, with some advanced features: 1. Purpose of the indicator It draws a moving average line on the chart.
Instead of a single color, it splits the MA into three line segments :
Up (green) when the MA is rising,
Down (red) when the MA is falling,
Flat (gray, dotted) when the MA is flat within a threshold.
It supports many MA types , not just the standard SMA/EMA.
This is useful for traders b

Trend Catcher for MT4 – 您的高精度交易高级助手 Trend Catcher for MT4 是一款创新型指标,旨在为交易者提供先进的金融市场分析工具,结合精确性、可靠性和易用性。基于复杂算法,该指标能够解读价格走势和市场波动,生成清晰及时的信号,非常适合识别趋势的开始、潜在反转以及战略性的进出点。 Trend Catcher for MT4 的优势之一是其能够适应不同的市场环境:从盘整市场到强势趋势,指标都能提供一致的信号,最大限度地减少错误警报,提高交易者对决策的信心。可自定义的参数允许根据个人策略进行调整,使 Trend Catcher 成为灵活工具,支持新手交易者寻求明确指导,也帮助经验丰富的交易者优化绩效。 该指标结合基于波动性和价格动态的分析,整合了趋势动量、支撑阻力位及关键反转点等技术要素。这种方法提供了全面的市场视角,比传统分析工具更精准地识别机会。每个信号都配有趋势强度指标,帮助评估风险并更有意识地规划交易。 Trend Catcher for MT4 不仅是技术分析工具,更是操作助理,可持续监控市场并实时响应价格变化。其直观清晰的界面能够立即显
Donchian 时间同步分析器 为经典的 Donchian 通道分析带来了强大的 多时间 框架维度,使交易者能够同时监控五个不同图表周期的 趋势强度 和潜在 反转信号 。这款先进的指标能够计算您所选时间框架内的最高点和最低点,生成 清晰的视觉信号 ,帮助您识别跨多个时间范围的趋势方向的收敛。通过提供从分钟到小时的协同分析,它比单一时间框架工具提供更深入的市场洞察,帮助交易者 确认重大突破 ,并通过时间框架确认 避免错误信号 。 核心功能
这款先进的工具同时在多个时间范围内应用久经考验的 唐奇安通道策略 ,绘制同步信号,揭示短期价格走势是否与长期趋势一致。当价格突破您所选时间范围内的关键支撑位或阻力位时,系统会在单独的指标窗口中生成彩色箭头,从而以强大的视觉方式呈现市场动量。这种多时间范围方法通过汇聚不同时间视角的信号,更好地确认 趋势的起始点、延续点 和 潜在衰竭点 。 主要特点
多时间框架分析: 同时监控最多五个不同的时间范围(M1 至 MN),以获得全面的趋势视角 可定制的时间范围选择: 选择您喜欢的时间范围组合以匹配您的交易风格 视觉信号融合: 清晰

Williams' Market Dynamics Compass: Ваш навигатор в хаосе рынка! Устали от множества индикаторов и запутанных графиков? Williams' Market Dynamics Compass — это комплексный инструмент, который объединяет классические и проверенные временем стратегии Билла Уильямса в одном удобном решении. Индикатор поможет вам видеть рынок как единую, динамичную систему, а не набор случайных движений. Что внутри?
Мультитаймфреймовый анализ AO (Awesome Oscillator): Получайте информацию о трендах на разных таймфре
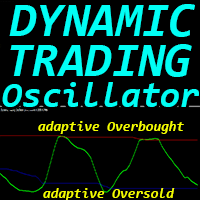
“动态交易震荡指标”是一款高级自定义加密货币外汇指标,适用于 MT4 平台,效率极高!
- 新一代震荡指标 - 参见图片了解如何使用。 - 动态交易震荡指标具有自适应超卖/超买区域。 - 震荡指标是一款辅助工具,可帮助您从动态超卖/超买区域找到准确的入场点。 - 超卖值:低于蓝线,超买值:高于红线。 - 该指标也非常适合与价格行为模式结合使用。 - 它比标准震荡指标更精准。适用时间范围:30 分钟、1 小时、4 小时、1 天、1 周。 - 提供 PC 和移动端提醒。 ................................................................................................................. // 优秀的交易机器人和指标可在此处获取: https://www.mql5.com/en/users/def1380/seller 本产品为原创产品,仅在 MQL5 网站上提供。
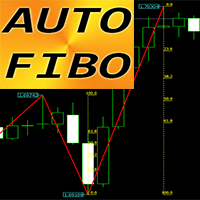
“Auto FIBO” Crypto_Forex 指标 - 是一款出色的交易辅助工具!
- 指标自动计算并绘制斐波那契水平线和局部趋势线(红色)。 - 斐波那契水平线指示价格可能反转的关键区域。 - 最重要的水平线是 23.6%、38.2%、50% 和 61.8%。 - 您可以将其用于反转剥头皮交易或区域网格交易。 - 您还可以使用 Auto FIBO 指标来改进您当前的系统。 ................................................................................................................. // 优秀的交易机器人和指标可在此处获取: https://www.mql5.com/en/users/def1380/seller 这是仅在 MQL5 网站上提供的原创产品。
High low Reversal concept by Naveen saroha to find out new tops and new bottoms through mathematical calculations also can get with own calculation inputs available to increase or decrease swing potential,also can use auto analysis function to calculate Parameters swing heights and swing percentages. Indicator can apply all time frame and all types of market symbols..... """High-Low Market Signals Overview High-low market signals are technical indicators that analyze the relationship between r
Custom Indictor Signal Scanner for scan your own any custom indicator and template its one click you can open your desire signals(given time frame alert). Also can open same template with particular input indicator just type name of template your created with given indicator and enjoy all time frame scan with your logical signals What is a Custom Indicator Scanner for MT4? A custom indicator scanner is an Indicator or script that automatically scans multiple currency pairs and timeframes for
A day high low scanner is a stock screening tool that helps traders and investors identify stocks based on their daily price movements, specifically focusing on stocks that are hitting new highs or lows within a trading day. Here's how it typically works: Day High Scanner: Identifies stocks that are trading at or near their highest price of the current trading day Shows stocks with strong upward momentum Helps traders spot potential breakout opportunities or stocks with bullish sentiment Day Low
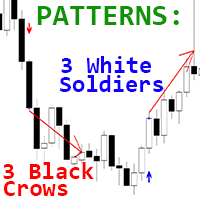
Crypto_Forex MT4 平台“三白三黑乌鸦形态”指标,无需重绘,无延迟。
- “三白三黑乌鸦”指标对于价格行为交易非常有效。 - 指标可检测图表上的三白三黑乌鸦形态。 - 看涨三白三黑乌鸦形态 - 图表上显示蓝色箭头信号(见图)。 - 看跌三黑乌鸦形态 - 图表上显示红色箭头信号(见图)。 - 提供 PC、手机和电子邮件提醒。 - “三白三黑乌鸦”指标非常适合与支撑/阻力位结合,并顺应主要趋势方向进行交易。 ................................................................................................................ // 优秀的交易机器人和指标可在此处获取: https://www.mql5.com/en/users/def1380/seller 这是仅在 MQL5 网站上提供的原创产品。
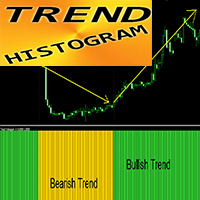
适用于 MT4 的 Crypto_Forex 指标“趋势柱状图”,无需重绘。
- 趋势柱状图指标比任何标准移动平均线交叉指标都更加灵敏高效。 - 指标支持两种颜色:黄色(金色)表示看跌趋势,绿色表示看涨趋势(可在设置中更改颜色)。 - 趋势柱状图内置移动端和 PC 端警报。 - 建议将此指标与其他交易方法结合使用:价格行为、VSA 和其他指标。 ................................................................................................................. // 优秀的交易机器人和指标可在此处获取: https://www.mql5.com/en/users/def1380/seller 本产品为独家产品,仅在 MQL5 网站上提供。
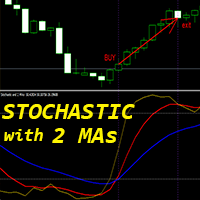
Crypto_Forex MT4 指标“随机指标和两条移动平均线”,无需重绘。
- 随机震荡指标是市场上最优秀的指标之一,是众多交易者的理想工具。 - “随机指标和两条移动平均线”指标可让您查看随机震荡指标的快速和慢速移动平均线。 - 超买区域 - 高于 80;超卖区域 - 低于 20。 - 建议在 80 以上区域卖出,低于 20 区域买入。 - 您可以在图片上查看买入和卖出的入场条件。 - 考虑买入信号条件: (1) - 快速移动平均线在超卖状态下向上穿过慢速移动平均线:开仓买入。 (2) - 随机指标值在超买状态下向下穿过快速移动平均线:退出买入。 (3) - 卖出交易时反之亦然(见图片)。
// 优秀的交易机器人和指标可在此处获取: https://www.mql5.com/en/users/def1380/seller 这是仅在 MQL5 网站上提供的原创产品。
Description in English Currency Strength Money PRO — The Ultimate Currency Strength Indicator The Currency Strength Money PRO was designed for traders who need clarity and accuracy when analyzing Forex and Metals markets. ️ Modern LiveCharts-style display — colored bars instantly show which currencies are strong and which are weak.
️ Fully customizable — select currencies, timeframes, weights, and colors to fit your strategy.
️ Smart alerts — get notifications when a true imbalance between
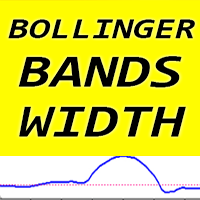
Crypto_Forex MT4 布林带宽度指标,无需重绘。
- 布林带宽度指标旨在与标准布林带指标配合使用。 - 此交易工具是所有布林带指标爱好者的必备工具,因为它们的组合对于突破交易非常有效。 - 布林带宽度指标显示布林带之间的距离(跨度)。
如何使用布林带宽度(参见图片中的示例): 1) 找到过去 6 个月布林带宽度的最低值,并将该值加上 25% 以获得突破水平。 2) 将突破水平附加到布林带宽度指标上。同时将布林带指标附加到图表上。 3) 等待价格在布林带指标边界之间持平,并且布林带宽度值低于突破水平。 4) 等待突破布林带指标边界(K线收盘价应在布林带边界外),检查布林带宽度 - 它应高于突破水平。 5) 按照突破方向开市价单,并在布林带边界的反方向设置止损位。 将止盈位设置为至少比止损位大3倍(取决于更高时间框架上的支撑/阻力区域)。
// 优秀的交易机器人和指标可在此处获取: https://www.mql5.com/en/users/def1380/seller 这是仅在本MQL5网站上提供的原创产品。
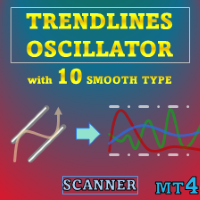
特別優惠 : ALL TOOLS ,每个仅 $35 ! 新工具 在 第一周 或 前3笔购买 期间为 $30 ! MQL5上的交易工具频道 :加入我的 MQL5 频道以获取我的最新消息 Trendlines Oscillator 通过使用当前价格与最近检测到的看涨(支撑)与看跌(阻力)趋势线之间的标准化距离来识别趋势与动能。
查看更多 MT5 版本: Trendlines Oscillator MT5 Scanner 查看更多 MT4 版本: Trendlines Oscillator MT4 Scanner 查看更多产品: All P roducts 关键特性 分别显示看涨与看跌的动能线 一条带有交叉标记的信号线 可选的数据和平滑信号线的平滑处理 用法 指标绘制三条线:两条动能线(看涨与看跌)以及一条信号线。当任一动能线与信号线发生交叉时,将以圆点标记交叉以指示哪一方力量增强。
一般而言,当看涨动能线(绿色)位于看跌动能线(红色)之上时,表示买盘压力;此时,价格距离支撑趋势线的距离大于距离阻力趋势线的距离。相反则表明卖盘压力。 看涨动能通过定位价格下方的支
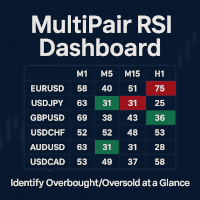
MultiPair RSI Dashboard MultiPair RSI Dashboard 是一款强大的指标,能够同时扫描 多个交易品种和多个时间周期 ,并以清晰的表格形式显示 RSI 数值。 无需再来回切换图表和周期 —— 一眼即可掌握全市场的 RSI 状态! 主要功能 多品种监控 – 支持外汇货币对、指数、黄金、白银以及加密货币。 多周期视图 – 从 M1 到 D1,即时查看不同周期的 RSI 状态。 超买/超卖提示 – 当 RSI 超过您设定的阈值时,单元格会自动高亮显示(例如 >70 红色,<30 绿色)。 闪烁提醒 – 极端 RSI 区域会闪烁,确保不会错过信号。 完全可定制 – 可自由设置 RSI 周期、超买/超卖区间、刷新间隔、表格位置和字体大小。 使用优势 快速识别全市场的 超买/超卖机会 。 节省时间 —— 无需频繁切换图表和时间周期。 适合 剥头皮、日内和波段交易者 。 支持您经纪商提供的 任何交易品种 。 使用 MultiPair RSI Dashboard,全市场的 RSI 状态尽在掌握!
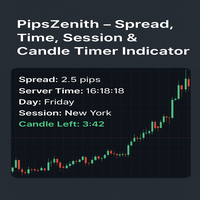
PipsZenith – Spread, Time, Session & Candle Timer Indicator (v3.2) Description:
Stay one step ahead in Forex trading with PipsZenith , the ultimate on-chart tool that gives you everything you need at a glance. Designed for precision traders, this indicator displays: Real-time Spread – Know the exact cost of your trades instantly. Server Time – Always stay synchronized with broker time. Day & Weekday Info – Track your trading week effortlessly. Active Trading Session – Instantly identify Tokyo,
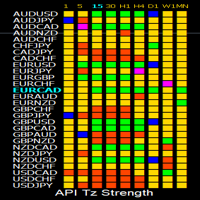
API Tz Strength Indicator MT4 – All-in-One Strength Dashboard for 28 Symbols and 9 Timeframes Take your Strength analysis to the next level with one powerful dashboard. The API Tz Strength Indicator MT4 is designed for traders who want to track market strength and reversals across multiple symbols and timeframes – all from a single chart. With advanced clickable controls, customizable watchlists, and smart alerts, this tool simplifies multi-symbol, multi-timeframe analysis like never before. ___

Candlestick Momentum is a professional-grade technical analysis indicator that identifies high-momentum candlesticks using advanced ATR (Average True Range) analysis. This indicator helps traders identify potential trend continuation or reversal points by detecting candles with strong directional movement and minimal wicks.
Trading Strategies
Strategy 1: Momentum Breakout - Setup : Wait for momentum candle signals - Entry : Enter on arrow signal - Stop Loss : Below/above the momentum candle -
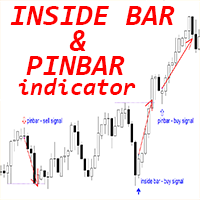
Crypto_Forex MT4 版“ Inside Bar & PinBar Patterns ”指标,无需重绘,无延迟。
- “Inside Bar & PinBar Patterns”指标对于价格行为交易非常强大。 - 指标可检测图表上的 Inside Bar 和 PinBar 模式: - 看涨模式 - 图表上显示蓝色箭头信号(见图)。 - 看跌模式 - 图表上显示红色箭头信号(见图)。 - Inside Bar 本身具有较高的 R/R 比率(回报/风险)。 - 支持 PC、移动端和电子邮件提醒。 - “Inside Bar & PinBar Patterns”指标非常适合与支撑/阻力位结合使用。
// 优秀的交易机器人和指标可在此处获取: https://www.mql5.com/en/users/def1380/seller 本产品为独家产品,仅在本 MQL5 网站上提供。
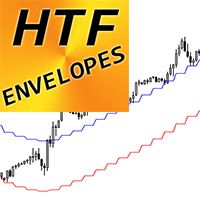
适用于 MT4 的 Crypto_Forex 指标“HTF 包络线”。
- 使用专业的 MT4 HTF 包络线升级您的交易方法。HTF 代表更高的时间框架。 - 包络线是市场上最好的趋势指标之一,是完美的交易工具。 - 它用于帮助交易者识别极端超买、超卖情况以及交易区间。 - HTF 包络线指标非常适合多时间框架交易系统,可与价格行为输入或与其他指标结合使用。 - 该指标允许您将更高时间框架的包络线附加到您当前的图表中。 ................................................................................................................. // 优秀的交易机器人和指标可在此处获取: https://www.mql5.com/en/users/def1380/seller 这是仅在 MQL5 网站上提供的原创产品。
거래 시간을 완벽하게 통제하고, 효율성을 극대화하세요. 데이 트레이딩에서 바(캔들)의 수를 정확하게 세는 것은 시간 소모적이고 오류가 발생하기 쉬운 일이었습니다. BarCounter가 이 문제를 해결해 드립니다. 이 스마트하고 가벼운 지표는 하루가 시작된 이후 생성된 모든 캔들을 자동으로 정확하게 계산하여, 세션 진행 상황을 완전히 확신하며 모니터링할 수 있게 해줍니다. 수동 계산의 번거로움을 자동화된 과정으로 바꾸고, 불확실성을 명확한 통찰력으로 전환해 줍니다. BarCounter는 엄격한 시간 관리가 필요한 모든 트레이더에게 필수적인 도구입니다. ..................................................................

Advanced SRP (Strong Retracement/Reversal Points) Tired of support and resistance indicators that constantly repaint, clutter your charts with irrelevant lines, and fail across different timeframes? It's time to stop guessing and start trading with institutional-grade clarity. Advanced SRP is not just another S/R tool; it's a definitive market structure indicator designed for the serious trader. It identifies and displays the most critical price levels where the market is statistically likely t
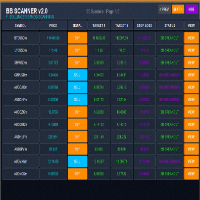
BB Scanner MT4 is a powerful, next-generation market scanner that detects Bollinger Bands breakouts across multiple symbols and timeframes.
It provides a modern, interactive dashboard that displays signals, entry price, target levels, stop loss, and real-time status — all in one place. Key Features Multi-Symbol & Multi-Timeframe Scanning (auto or custom list) Precise BB Breakout Detection (Buy/Sell with ATR-based targets) Automatic Target 1, Target 2, Stop Loss calculation ️ Modern

Core Concept: Naveen Saroha's Advanced time and price angles included percentages to find out right time and price equations are drawn from significant highs or lows at specific geometric ratios that represent the relationship between price movement and time. The Main Gann Angles and Percentage together Most Important: 1x1 Angle : One units of price for one unit of time 1x2 Angle : One unit of price for two units of time 1x3 Angle 1x4 Angle
1x5 Angle
1x6 Angle
1x7 Angle
1x8 Angle: (45)
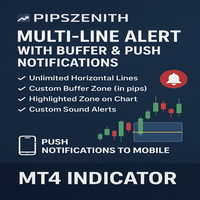
Multi-Line Alert with Buffer & Push Notifications (MT4 Indicator) Originally shared as a free community tool , this upgraded version is now available on the MQL Market for traders who want professional-grade alerts without sitting in front of the screen all day. With this indicator, simply place horizontal lines on your chart — the indicator will automatically track them, highlight your chosen buffer zone, and notify you the moment price approaches your level. Whether you’re trading support/r
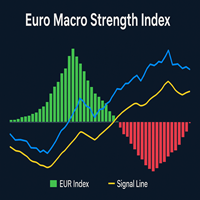
The Euro Macro Strength Index is a custom MT4 indicator designed to measure the relative strength or weakness of the Euro across its six major currency pairs (EURUSD, EURGBP, EURJPY, EURCHF, EURAUD, EURCAD).
By applying weighted calculations based on liquidity, the indicator builds a composite strength index that reflects Euro momentum in real time. A smoothed line and a signal line are plotted to help traders identify directional bias, potential reversals, and crossovers for trading signals. T

Technically, the indicator represents the difference between two fractal adaptive moving averages. Fractal Adaptive Moving Average (FraMA) is a smart adaptive moving average developed by John Ehlers. FraMA takes price changes into account and closely follows the price level, remaining straight during price fluctuations. FraMA takes advantage of the fact that markets are fractal and dynamically adjusts the lookback period based on this fractal geometry. The indicator has the ability to send notif
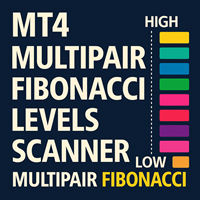
Multipair Range Percentage Levels Scanner - Technical Description Overview A Fibonacci levels scanner is a technical analysis tool that automatically identifies and plots key Fibonacci retracement and extension levels across multiple financial instruments or timeframes. It helps traders quickly locate potential support and resistance zones based on mathematical relationships derived from the Fibonacci sequence. Core Functionality Automatic Level Detection The scanner identifies significant pric

WD Gann Swing Trading & Market Calculation Mathematics: Decoding the Master's Geometric Approach to Market Prediction Introduction William Delbert Gann (1878-1955) stands as one of the most enigmatic and successful traders in financial history, developing a sophisticated mathematical framework that combined geometry, astronomy, and natural law to predict market movements. His theory was based upon natural geometric shapes and ancient mathematics. Gann theory states that the patterns and angles o

这 唐奇安突破扫描仪专业版 是一个全面的 多符号监控工具 自动跟踪 唐奇安通道突破 涵盖各种交易工具和时间框架。这款先进的扫描仪使用经典的 唐奇安通道方法 ,识别您所选投资组合中出现的重大突破形态。该系统通过直观的 颜色编码按钮界面 ,其中绿色按钮表示 看涨突破 和红色按钮信号 看跌突破 ,每个突破都清楚地标明各自的时间范围,以便快速评估。 这 多时间框架能力 允许交易者监控不同时间范围内的突破收敛,从短期 M1 走势到长期 D1 和 W1 趋势。扫描仪的 仪表板样式显示 提供当前市场状况的有组织的概述,重点突出哪些工具显示出最有前景 突破机会 涵盖多种时间视角。点击任意信号按钮,交易者即可立即访问相应的图表 唐奇安通道已经绘制出来 ,简化了分析过程,并在快速变化的市场条件下节省了宝贵的时间。
主要特点
多符号扫描: 同时监控多达无限的交易工具,寻找突破机会 多时间框架分析: 跟踪从 M1 到月度图表的 9 个不同时间框架 视觉信号仪表板: 颜色编码按钮(绿色/红色)显示突破方向和时间范围 一键图表访问: 通过

The Molly Arrows indicator is a unique MT4 tool that blends moving average crossovers, volatility measurement, and a proprietary detrended sine wave cycle filter to deliver buy and sell arrow signals directly on the chart.
Best to filter arrows with other indicators.
Designed for traders who seek clarity and accuracy, Molly Arrows avoids the common issue of false signals by confirming entries through its embedded detrended cycle detection, ensuring arrows only appear when market momentum align

Session Kill zones with panel for quick changes.
Asia Killzone London Killzone New York Killzone London Close Killzone In this indicator GMT+2 timings are used that are most common among many brokers. read the image attached in the screenshots to know more about sessions adjustments Session timings can be changed according to your broker timings and day light savings.
Thank you :) Always open to feedback and criticism if it helps me provide you more value. - Rahul My other indicators you may l
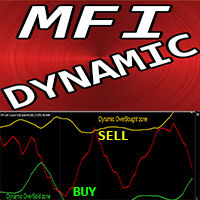
适用于 MT4 的 Crypto_Forex 指标“带动态超卖/超买区域的 MFI”,无需重绘。
- Money_Flow_Index (MFI) 是一款技术指标,利用价格和交易量数据来识别超卖和超买区域。 - 它非常适合在动态超买区域进行卖出交易,在动态超卖区域进行买入交易。 - MFI 非常适合背离检测,并且非常适合与价格行为结合使用。 - 动态超买区域 - 黄线上方。 - 动态超卖区域 - 绿线下方。 - MFI 指标提供有关看涨和看跌价格动量的信息。 - 提供 PC 和移动端警报。
// 优秀的交易机器人和指标可在此处获取: https://www.mql5.com/en/users/def1380/seller 这是仅在 MQL5 网站上提供的原创产品。

这个先进的RSI趋势线指标自动检测并绘制RSI振荡器峰值上的趋势线。它分析可配置的峰值模式,通过斜率陡度、最小高度和距离参数进行精确过滤。该算法处理多个峰值以识别有效的趋势线,通过可调整的峰值计数优化CPU性能表现。功能包括负斜率过滤、RSI水平约束以精确生成交易信号,以及适用于不同市场条件的可自定义参数设置。该指标能够智能识别RSI图表底部的做多机会和顶部的做空机会,为交易者提供精确的市场进入点位判断。支持设置最小峰值高度来过滤平缓波动噪音,确保只捕捉重要的价格转折点信号。算法采用高效的计算方法,减少系统资源占用,同时保持高精度的趋势线识别能力。完美适合寻求在RSI动量模式上进行自动化技术分析并具备可靠趋势线识别能力的专业交易者和量化投资者使用。

Crypto_Forex 指标随机平移检测器 - 是一款高效的交易辅助工具!无需重绘。 我推荐您使用这款适用于 MT4 的出色指标来升级您的交易方法。
- 指标在图表上显示价格平移区域。它具有“平移敏感度”参数,用于平移检测。 - 随机平移检测器可用于价格行动入场确认、背离或超卖/超买信号。 - 您可以将其用于趋势跟踪系统,以检测平移区域并避免在该区域交易。 - 您可以将其用于反转剥头皮交易 - 从平边进行反转交易。 - 有很多机会可以使用随机平移检测器替代标准随机指标。 - 随机指标本身是市场上最好的震荡指标之一 - 对许多交易者来说都是完美的工具。
// 优秀的交易机器人和指标可在此处获取: https://www.mql5.com/en/users/def1380/seller 这是仅在 MQL5 网站上提供的原创产品。
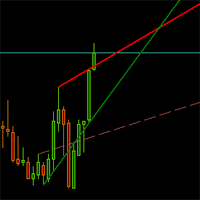
Dynamically draws trend lines, broken trend line. Auto delete after X minutes or Y hours. Enter the # of bars look back period. Lines re-draw at the close of each new bar ensuring the current trend is followed.Inputs include support line color, resistance line color, width, style (solid, dotted, dashed). Watch demo video here: https://www.youtube.com/watch?v=N1Bf82bsqws

Solarwind No Repaint是一个技术振荡器,将费舍尔变换应用于标准化价格数据,创建基于直方图的指标来识别潜在的市场转折点。该指标将价格变动转换为高斯正态分布,使周期性模式和动量变化对交易者更加可见。 工作原理 该指标通过几个计算步骤处理价格数据: 高低分析 :计算指定周期内的最高价和最低价 价格标准化 :取每根K线高低价范围的中点,并根据周期范围进行标准化,将数值缩放到-1和+1之间 费舍尔变换应用 :应用数学费舍尔变换公式 0.5 * ln((1+x)/(1-x)) 并进行平滑处理 趋势信号处理 :基于数值变化和动量阈值生成方向性信号 主要特征 直方图显示 :在单独的指标窗口中显示为彩色柱状图 基于趋势的着色 :绿色柱表示看涨动量,红色柱表示看跌动量 无重绘设计 :仅使用已完成的K线以防止当前K线上的信号变化 自适应敏感度 :可配置的阈值系统以过滤市场噪音 信号持续性 :保持趋势方向直到发生显著的动量变化 参数 周期 (Extperiod):用于高低计算的回望周期(默认:10) 信号敏感度 :新信号所需的变化阈值(默认:0.05) 使用完成K线 :通过仅使用完成的K线防
ChartFix – TradingView-Style Chart Controls for MT4 Have you ever wished MT4 charts were as smooth to navigate as TradingView?
We all love MT4 for trading, but one thing it’s always lacked is easy, intuitive chart control. Constantly clicking the zoom buttons, fighting with the auto-scale, or dragging the price axis gets frustrating fast. ChartFix solves that problem by giving you simple on-chart controls for zooming and panning — just like you’re used to on TradingView. Simply click the "Switch
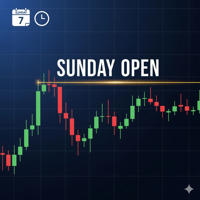
Версия на английском языке https://www.mql5.com/ru/market/product/148576?source=Site +Profile+Seller Это руководство создано, чтобы помочь начинающим трейдерам понять, как работает и настраивается индикатор "Sunday Open", а также как правильно интерпретировать его сигналы для принятия взвешенных торговых решений. Часть 1: Что такое индикатор Sunday Open и как его использовать? Основная идея В основе индикатора лежит простая, но мощная концепция: цена открытия недели является ключевым уровнем по

NEXT price Actions - Series One
1. Auto Mapping Projection Price Action XAUUSD to get the most accurate setup for each Entry Zone. 2. The tool used has been customized according to Swap Zones setup.
3. The setup that results after Mapping is all setups, namely Scalping, Intraday, and Swing.
4. This setup does not need a marking and depends on SNR & SND.
5. This setup only depends 100% on the tool used.
6. This setup is very suitable for getting an Entry in a shadow candle stick.
7. This s

NEXT price Actions - Series Two
1. Auto Mapping Projection Price Action XAUUSD to get the most accurate setup for each Entry Lines.
2. The tool used has been customized according to Swap Pivots setup.
3. The setup that results after Mapping is all setups, namely Scalping, Intraday, and Swing.
4. This setup does not need a marking and depends on SNR & SND.
5. This setup only depends 100% on the tool used.
6. This setup is very suitable for getting an Entry in a shadow candle stick.
7. This
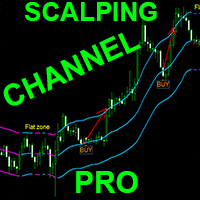
适用于 MT4 的 Crypto_Forex 指标“ Scalping Channel Pro ”。
- Scalping Channel Pro 具有基于 ATR 的波动率边界。 - 非常适合剥头皮交易: - 通过中线的限价挂单进行交易。 - 当蓝色稳定上行通道出现且至少有一根 K 线收盘价高于上边界时,考虑看涨入场(见图)。 - 当红色稳定下行通道出现且至少有一根 K 线收盘价低于下边界时,考虑看跌入场(见图)。 - 它具有价差掉期信息显示 - 显示与其关联的外汇对的当前价差和掉期。 - 显示屏还显示账户余额、净值和保证金。 - 可以在图表的任何角落找到价差掉期信息显示: 0 - 左上角,1 - 右上角,2 - 左下角,3 - 右下角。
// 优秀的交易机器人和指标可在此处获取: https://www.mql5.com/en/users/def1380/seller 这是仅在 MQL5 网站上提供的原创产品。
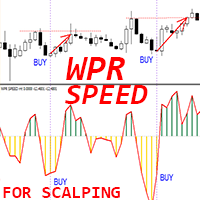
适用于 MT4 的 Crypto_Forex 指标“WPR SPEED”——卓越的预测工具,无需重绘。
- 该指标基于物理方程计算。WPR SPEED 是 WPR 振荡指标的一阶导数。 - WPR SPEED 非常适合在横盘和盘整市场中进行剥头皮交易。 - WPR SPEED 指标显示 WPR 自身方向的改变速度——它非常灵敏。 - 建议将 WPR SPEED 指标用于动量剥头皮交易策略:找到指标的峰值——在相反方向进行剥头皮交易(如图所示)。 - 指标内置移动端和 PC 端警报。 ................................................................................................................. // 优秀的交易机器人和指标可在此处获取: https://www.mql5.com/en/users/def1380/seller 这是仅在 MQL5 网站上提供的原创产品。
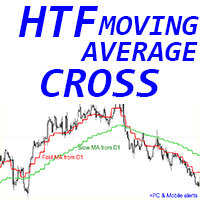
适用于 MT4 的 Crypto_Forex 指标“HTF 移动平均线交叉”。
- 使用强大的 MT4 HTF 移动平均线交叉指标升级您的交易方法。HTF 意味着更高的时间框架。 - 该指标非常适合趋势交易者,尤其适合价格行动入场。 - 它允许您将更高时间框架的快速和慢速移动平均线附加到您当前的图表中 --> 这是专业的方法。 - HTF 移动平均线交叉内置移动端和 PC 端警报。 - 该指标让您有机会以低风险获得可观的利润。 ................................................................................................................. // 优秀的交易机器人和指标可在此处获取: https://www.mql5.com/en/users/def1380/seller 这是仅在 MQL5 网站上提供的原创产品。
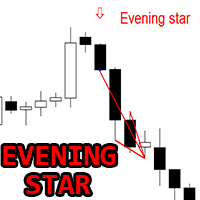
Crypto_Forex MT4 指标“黄昏之星形态”,无需重绘,无延迟。
- “黄昏之星形态”指标是一款非常强大的价格行为交易指标。 - 指标可检测图表上的看跌黄昏之星形态:图表上显示红色箭头信号(见图)。 - 支持 PC、手机和电子邮件提醒。 - 其兄弟——看涨“晨星形态”指标也已推出(点击下方链接)。 - “黄昏之星形态”指标非常适合与支撑/阻力位结合使用。 ................................................................................................................. // 优秀的交易机器人和指标可在此处获取: https://www.mql5.com/en/users/def1380/seller 这是仅在 MQL5 网站上提供的原创产品。
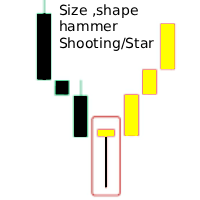
Hammer Shooting Star v1.1 – Advanced Candlestick Pattern Scanner Author: LIANG1990 Are you searching for a reliable tool to identify market reversals with precision?
Hammer Shooting Star v1.1 is a professional MT4 indicator designed to scan and detect high-quality Hammer and Shooting Star candlestick formations. Unlike basic pattern indicators, this tool applies multiple built-in filters (shape, size, trend alignment, and contextual conditions) to reduce false signals and highlight only the cle
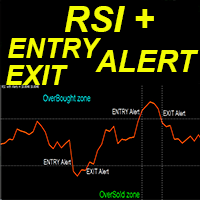
Crypto_Forex MT4 版“RSI 带警报”指标,无需重绘。
- RSI 是最受欢迎的交易震荡指标之一。 - 内置 PC 和移动端警报,适用于:进入超卖/超买区域以及退出超卖/超买区域。 - 警报触发级别可调。 - 该指标非常适合动量交易系统。 - 它非常适合在强超买区域(高于 70)进行卖出操作,以及在强超卖区域(低于 30)进行买入操作。 - RSI 本身对于背离检测非常有用。 - 指标适用于任何时间范围。 - 该指标也非常适合与价格行为技术结合使用。 ................................................................................................................. // 优秀的交易机器人和指标可在此处获取: https://www.mql5.com/en/users/def1380/seller 这是仅在 MQL5 网站上提供的原创产品。

With Dash TPX Supply Demand, you'll have a 360-degree view of the entire market to identify relevant supply and demand areas. Filters will make alerts even more accurate. You can set alerts for your chosen risk/reward ratio (2:1, 3:1, 4:1, and even 5:1). You can also filter alerts only in the direction of the macro trend using the Heiken Aish filter, avoiding false or countertrend signals. Regardless of your trading style, Dash TPX Supply Demand is a fundamental tool for understanding your posit
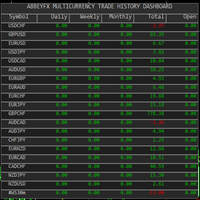
Abbeyfx Multicurrency Trade History Dashboard is an indicator that tracks and analyzes in a table format the trading performances across multiple forex pairs, stocks, crypto assets, or other instruments. This p ulls trades directly from MT4 trade history. The Multicurrency Comparison table shows s ide-by-side results for all pairs. With quick glance, you can see your best and worst performing pairs. This indicator is a t ime-based Analysis Daily, weekly, monthly performance.
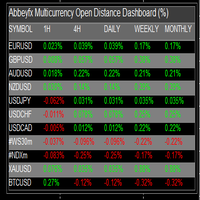
Unlock Market Insights with the AbbeyFX Multicurrency Open Distance Dashboard Take your trading to the next level with an advanced indicator that displays Price movement from 1H, 4H, Daily, Weekly, and Monthly Open across all trading instruments. With a single glance, you’ll see:
Precise pip or percentage movements for forex pairs, indices, metals, and crypto.
Multi-timeframe analysis (1H → Monthly) for stronger confirmations.
Clear visual dashboards that highlight bullish vs b
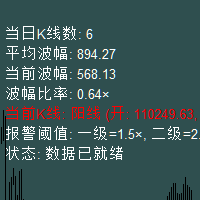
波幅报警指标功能介绍 一、核心功能:实时监测价格波动异常 波幅报警指标是一款适用于 MT4 交易平台的工具,核心功能是 实时追踪金融品种(如外汇、股票、期货)的价格波动幅度 ,通过对比当前 K 线波幅与当日平均波幅,识别异常波动并及时提醒交易者,帮助捕捉潜在交易机会或风险。 二、核心特性详解 1. 精准波幅计算 实时波幅监测 :自动计算当前 K 线的价格波动幅度(最高价 - 最低价)。 平均波幅统计 :动态统计当日所有 K 线的波幅,计算平均值作为基准。 波幅比率分析 :通过 “当前波幅 ÷ 平均波幅” 得出比率,直观反映波动强度。 2. 三级分级报警机制 根据波幅比率与预设阈值的对比,触发不同级别的报警,避免过度干扰同时确保关键信号不遗漏:
一级报警 :当波幅比率超过 1.5 倍平均波幅时触发,默认仅弹窗提醒(可自定义)。 二级报警 :当波幅比率超过 2.0 倍平均波幅时触发,默认弹窗 + 邮件提醒(可自定义)。 三级报警 :当波幅比率超过 3.0 倍平均波幅时触发,默认弹窗 + 邮件 + 声音提醒(可自定义)。
智能冷却机制 :每个级别可设置冷却时间(如一级 300 秒、二级

The TraderProfit7TopDown is a sophisticated multi-confirmation technical indicator for MetaTrader 4, designed to generate high-probability trading signals by synthesizing data from price action, momentum, and market volume. Its core philosophy is to filter out market noise and false breakouts by requiring a confluence of four distinct analytical factors before presenting a signal, making it a robust tool for trend-following strategies.
The indicator's logic is built upon a layered approach. F
Multi-TimeFrame Divergence Pro — Quick Start Guide
Thank you for purchasing Multi-TimeFrame Divergence Pro — a powerful, non-repainting divergence scanner designed for precision traders. This guide will help you set up and use the indicator effectively without overwhelming you with technical details.
️ Installation & Setup Apply to Chart
Drag and drop the indicator onto any MT4 chart (any symbol, any timeframe). Basic Settings (Inputs Tab)
Adjust these to match your trading style: Enable

ADVANCED TRADING INDICATOR WITH VWAP & SWING POINTS
Why is APEX Swing VWAP different? Unlike traditional VWAPs that reset daily, APEX Swing VWAP calculates VWAP from significant swing points, delivering much more accurate and market-relevant support and resistance levels.
KEY FEATURES Automatic Swing Point Detection Advanced algorithm that automatically identifies significant highs and lows Configurable swing length (recommended 8–15 for maximum accuracy) Clear visual mar
MetaTrader 市场 - 在您的交易程序端可以直接使用为交易者提供的自动交易和技术指标。
MQL5.community 支付系统 提供给MQL5.com 网站所有已注册用户用于MetaTrade服务方面的事务。您可以使用WebMoney,PayPal 或银行卡进行存取款。
您错过了交易机会:
- 免费交易应用程序
- 8,000+信号可供复制
- 探索金融市场的经济新闻
注册
登录