• Bilgiler
6+ yıl
deneyim
32
ürünler
135
demo sürümleri
0
işler
0
sinyaller
0
aboneler
👑 Teorik fizikçi, programcı.
On beş yıldır piyasanın matematiksel modellerini araştırmaya odaklanarak ticaret yapıyorum.
----------------------------------------------------------------------------------------------------------------------------------
💰 Sunulan ürünler:
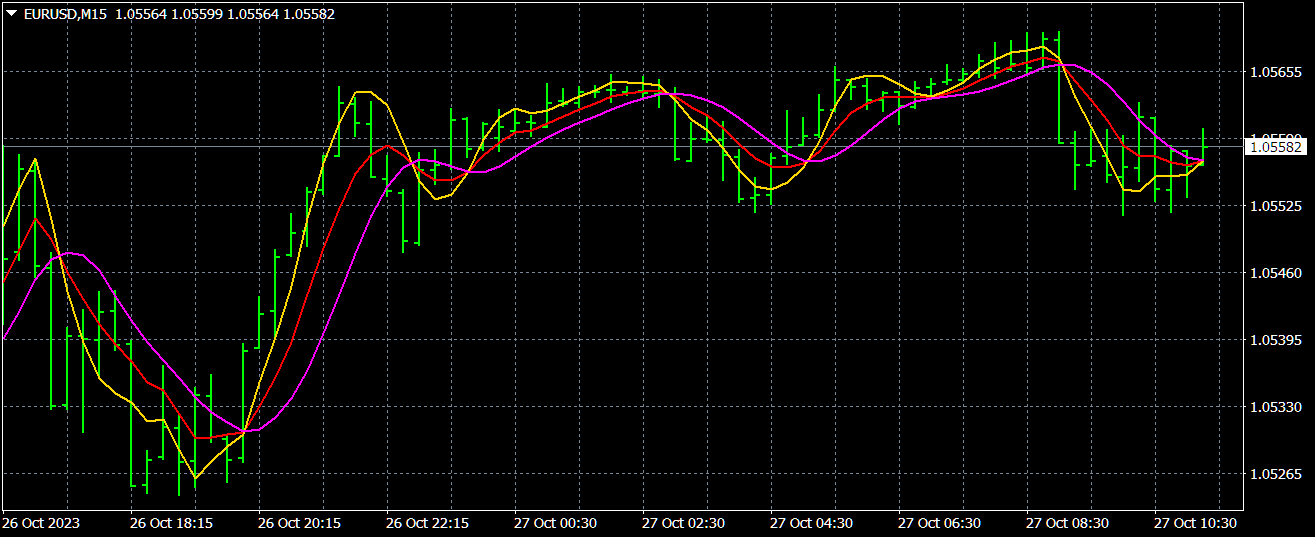
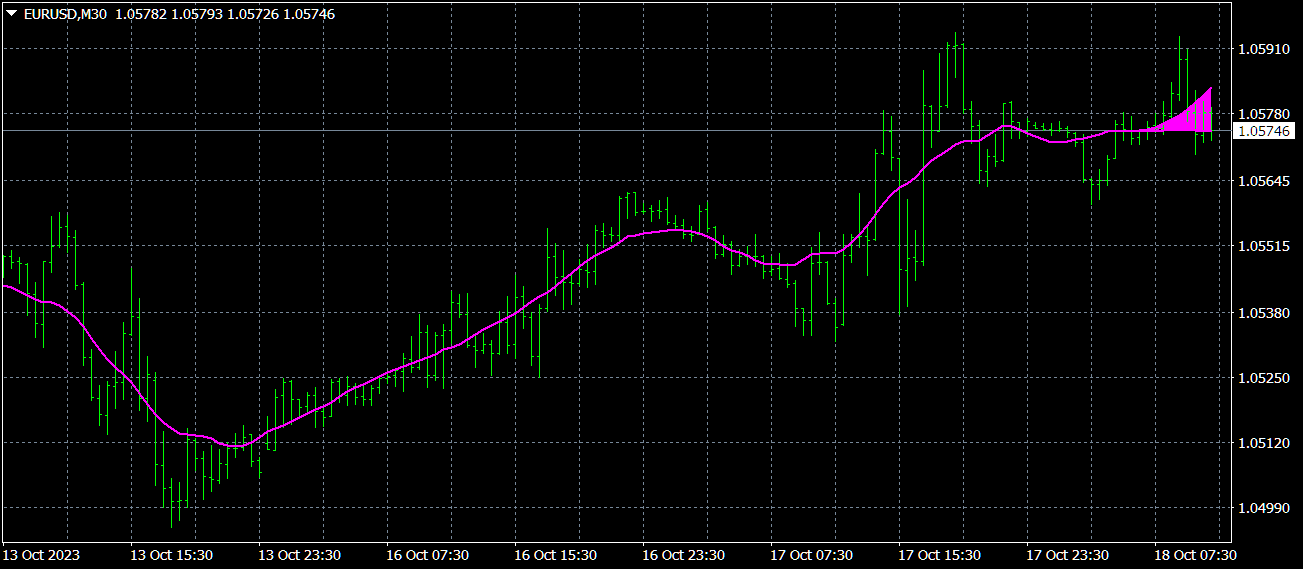
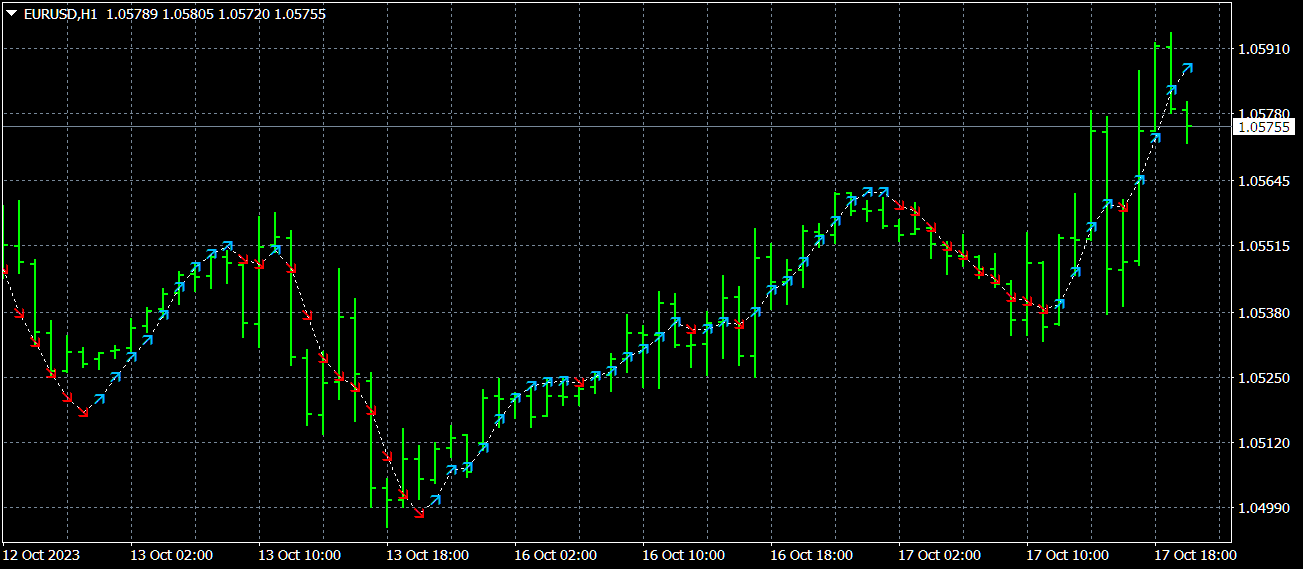
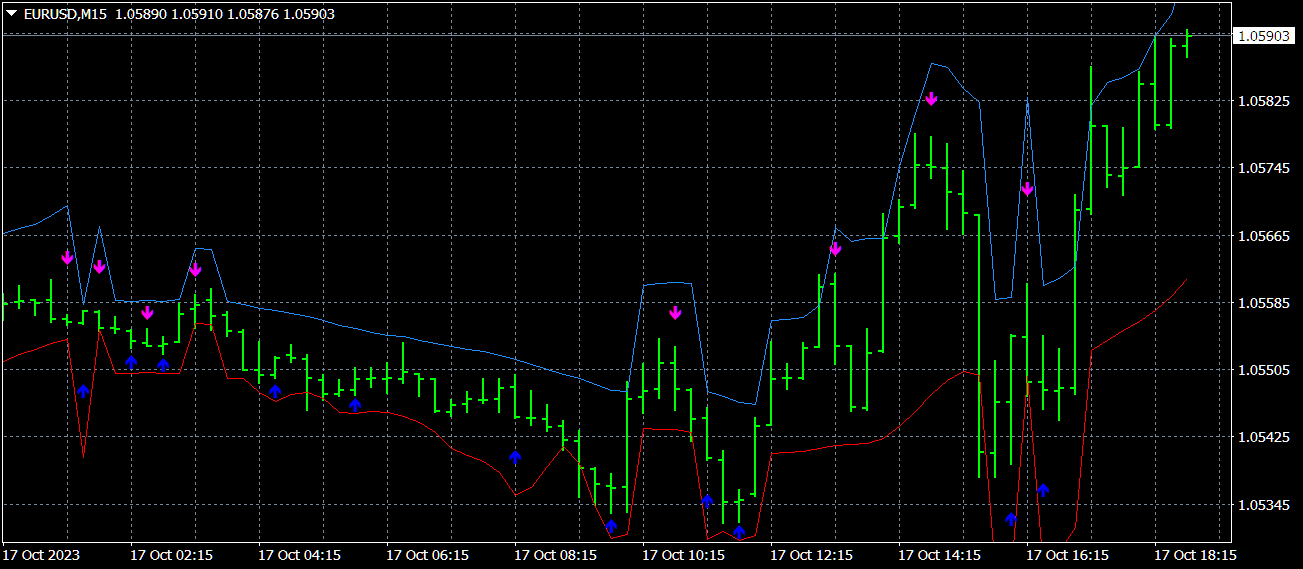
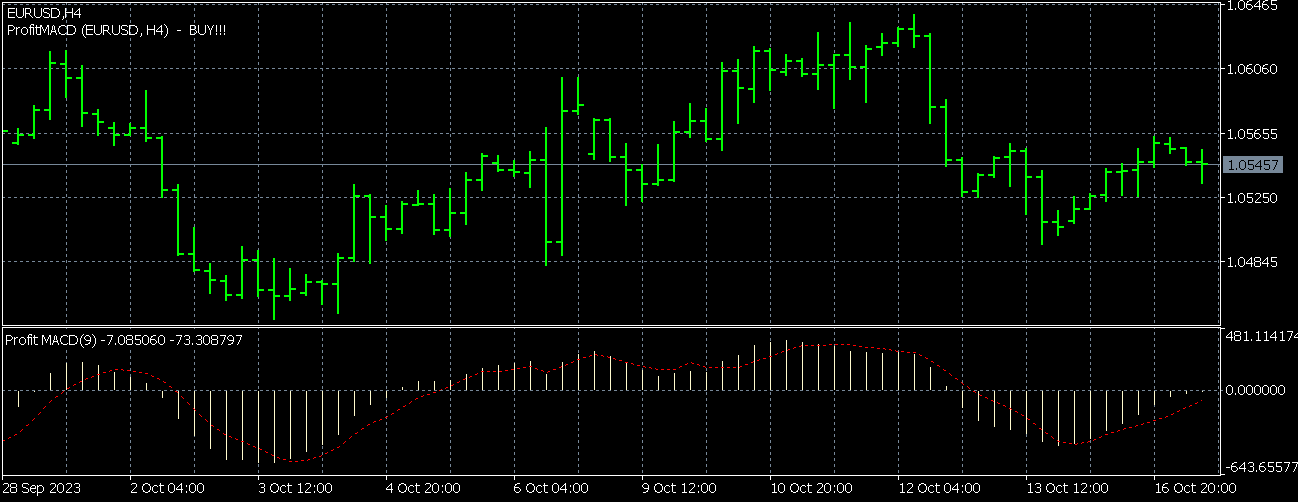
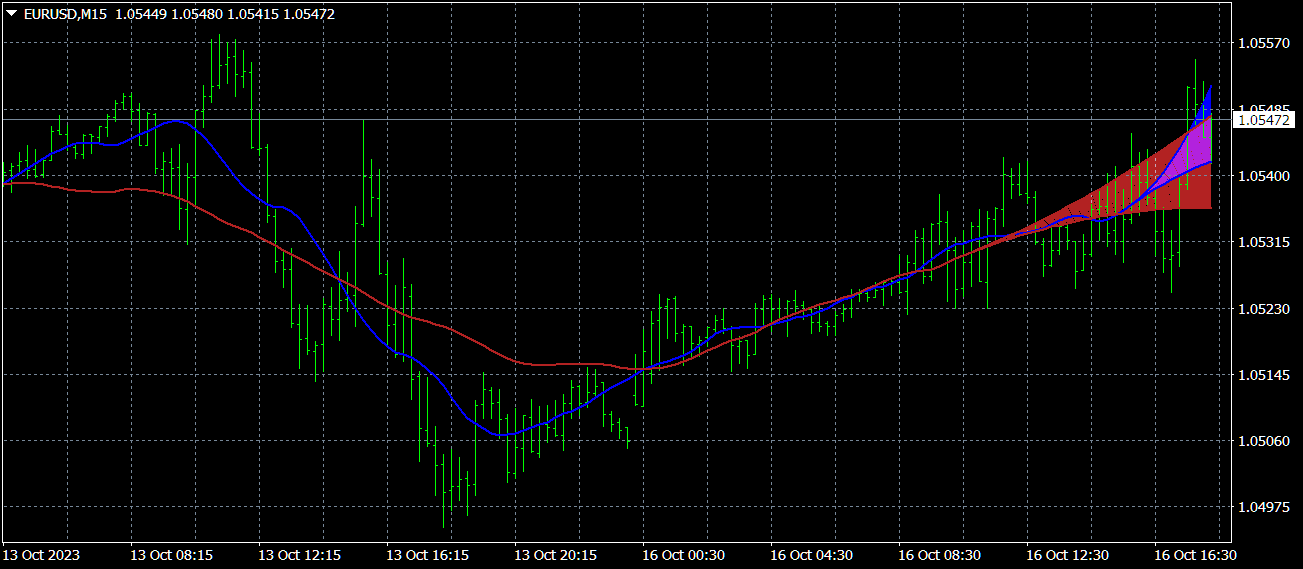
1) 🏆 Piyasa gürültüsünün optimal filtrelenmesine sahip göstergeler (açılış ve kapanış pozisyonları için noktaları seçmek için).
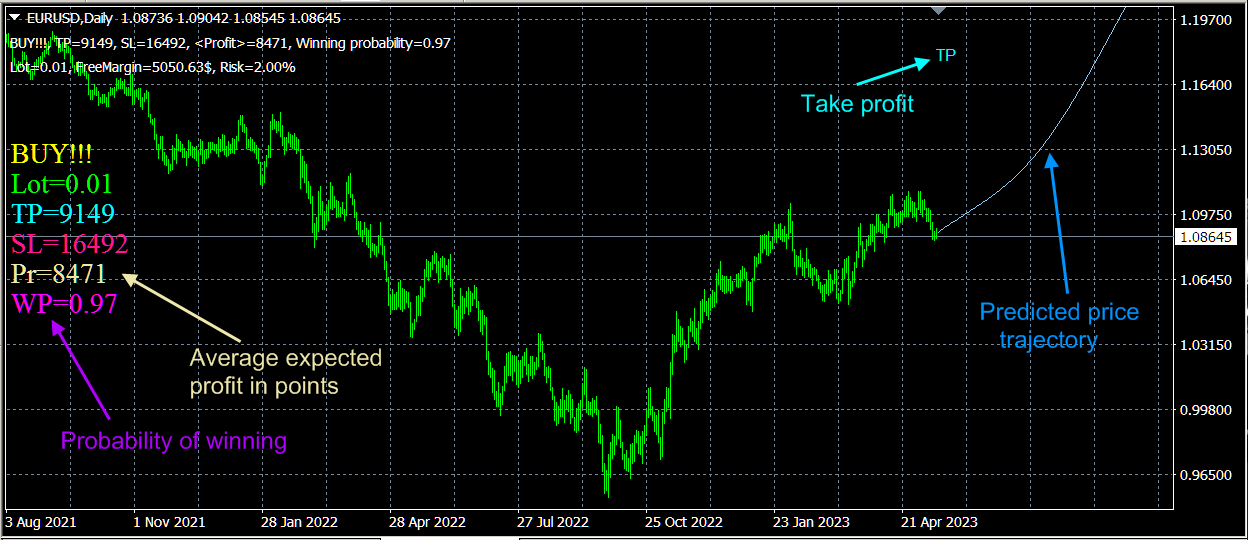
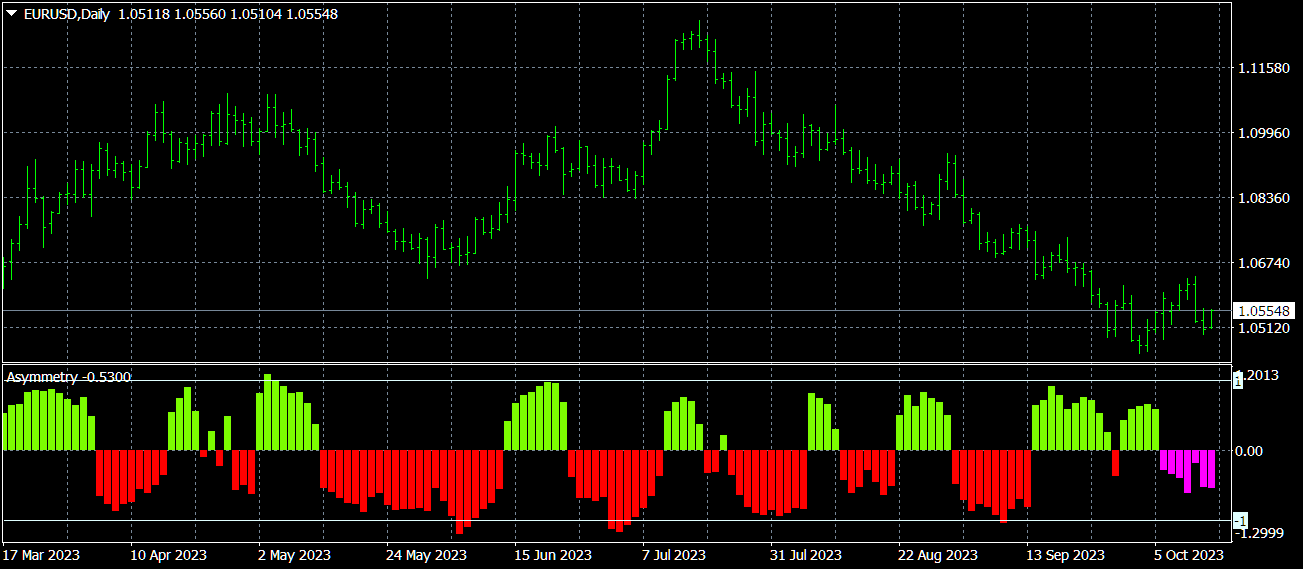
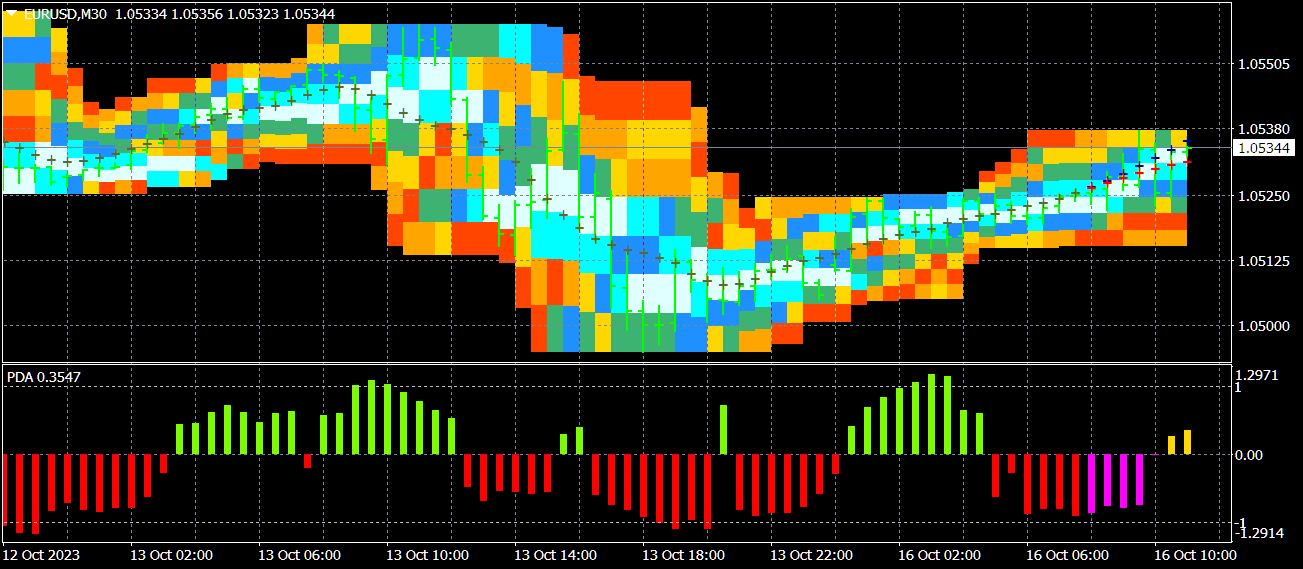
2) 🏆 İstatistiksel göstergeler (küresel eğilimi belirlemek için).
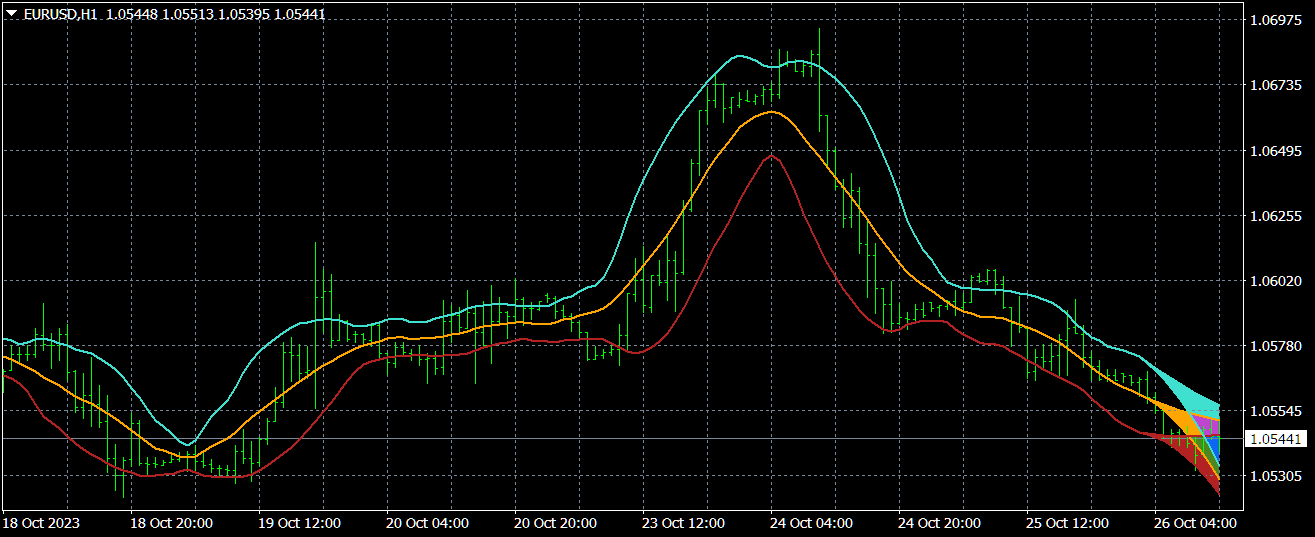
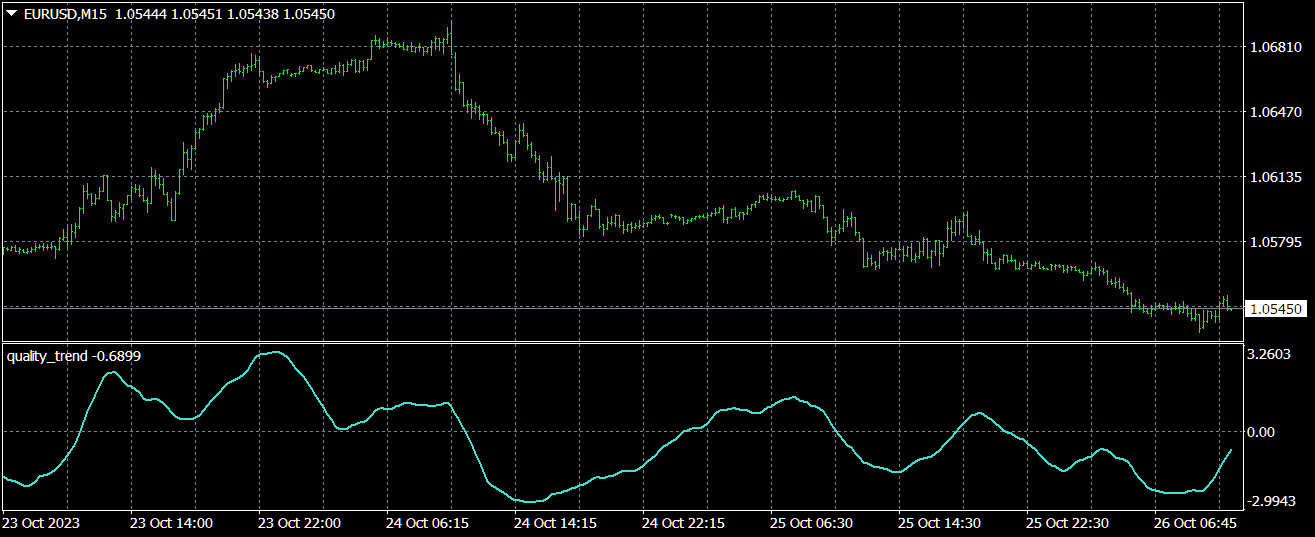
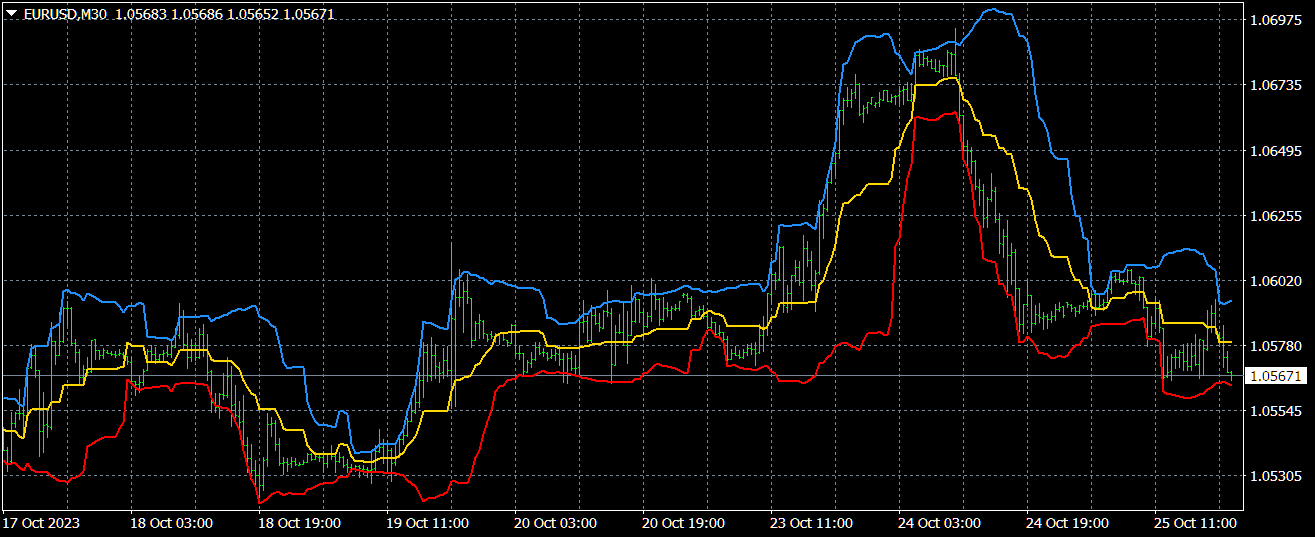
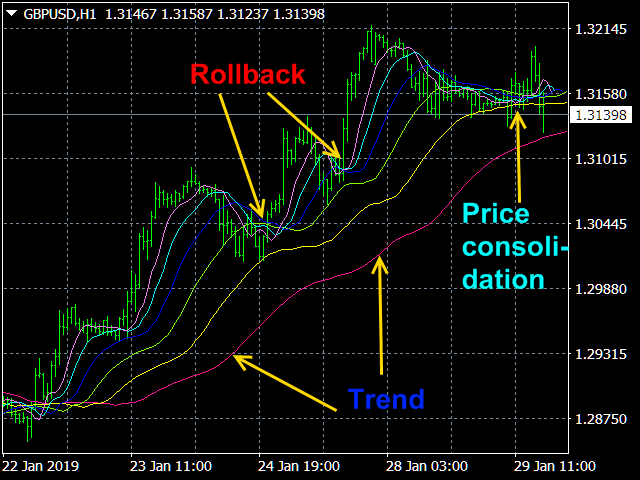
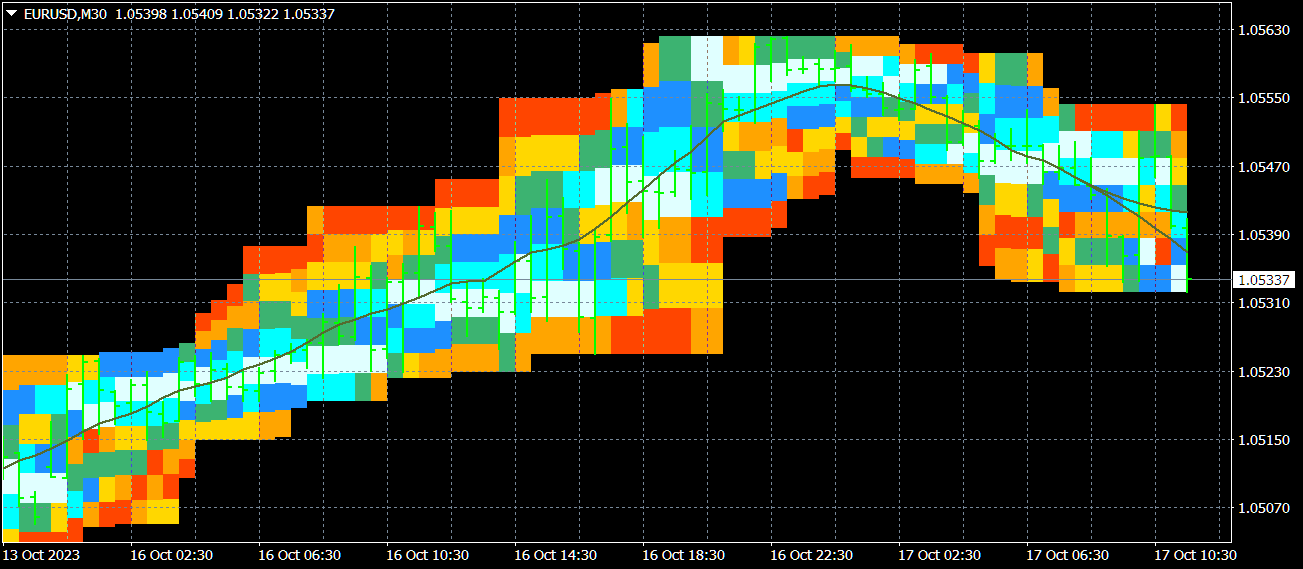
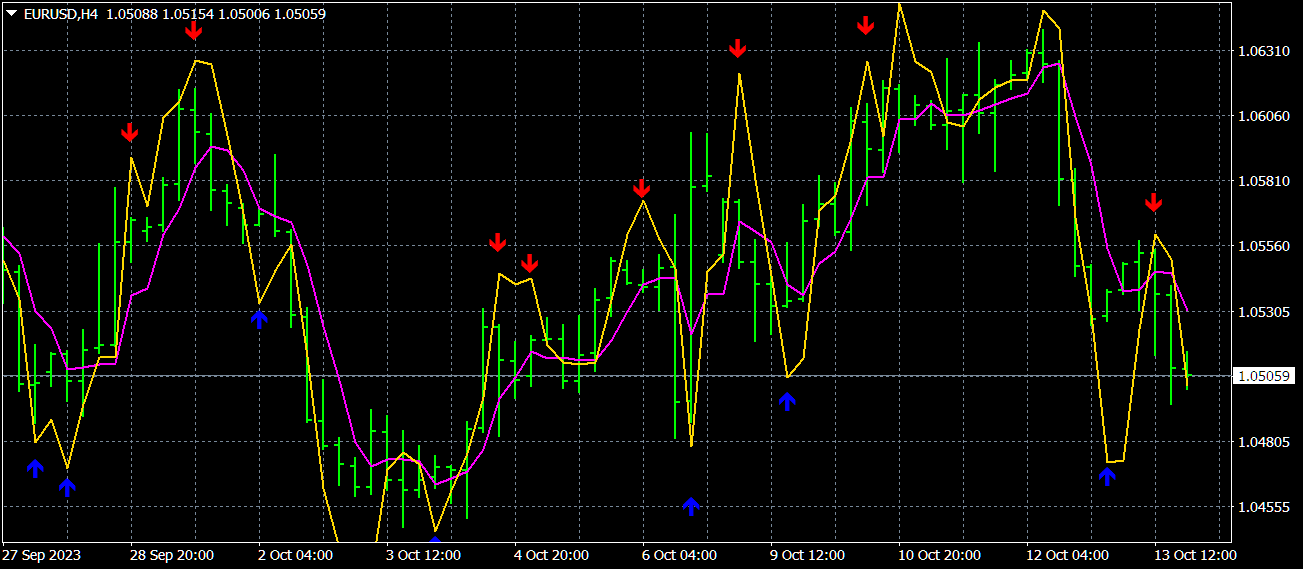
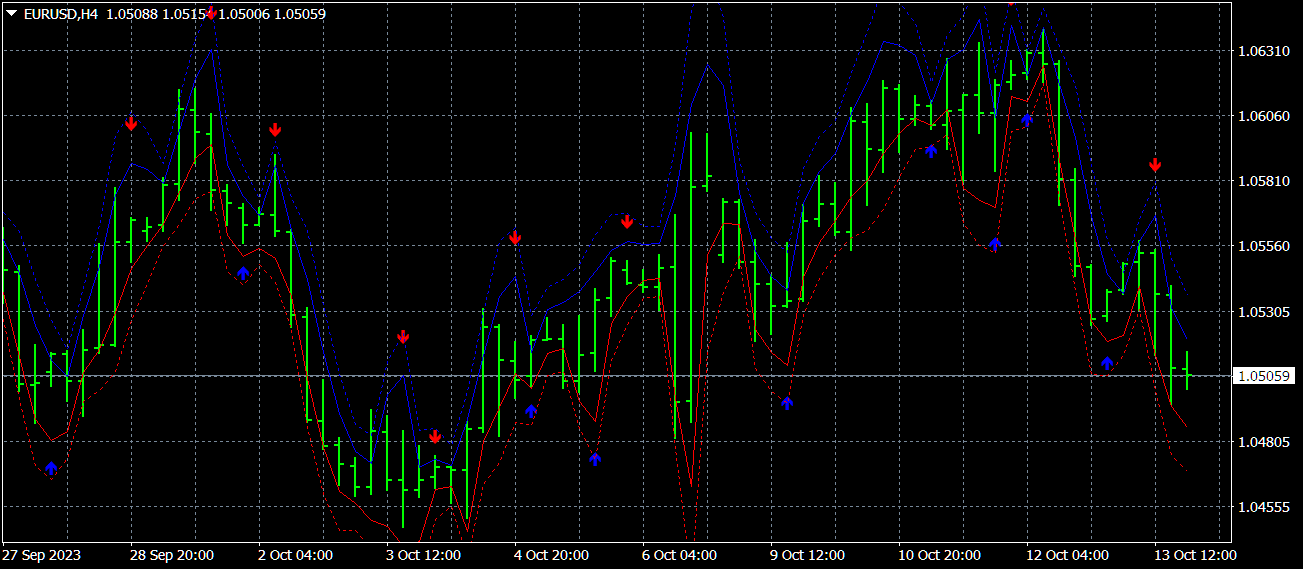
3) 🏆 Pazar araştırması göstergeleri (fiyat mikro yapısını netleştirmek, kanallar oluşturmak, trend dönüşleri ve geri çekilmeler arasındaki farkları belirlemek için).
----------------------------------------------------------------------------------------------------------------------------------
☛ Blogda daha fazla bilgi https://www.mql5.com/en/blogs/post/741637
Aleksey Ivanov
Aleksey Ivanov
Strong Trend Flat Signal https://www.mql5.com/en/market/product/37203
The Strong Trend Flat Signal indicator is the intersection of two, developed by the author, non-lagging moving averages with averaging periods 21 and 63.
✔️The algorithms of this indicator are unique and developed by their author
Aleksey Ivanov
Aleksey Ivanov
Friends! What we see on the price charts as a trend is often not a trend, but arises as a result of the imposition of a large number of unidirectional price jumps, i.e. is a purely random occurrence. Such pseudo-trends especially often occur on small timeframes, where the level of noise is very high against the background of a weak regular price movement. And you can win on such random false trends only by chance. Therefore, following such false trends, as a rule, leads to losses. My indicators were designed to filter out such noise, which is not an easy task. For more information about this phenomenon and how to identify it, see the blog «True and illusory currency market trends” https://www.mql5.com/en/blogs/post/740838
Aleksey Ivanov
Aleksey Ivanov
Probability distribution PRO https://www.mql5.com/en/market/product/41174
Indicator is used for:
1. defining price probability distributions. This allows for a detailed representation of the channel and its borders and forecast the probability of a price appearing at each segment of its fluctuations;
2. defining the channel change moment.
✔️The algorithms of this indicator are unique and developed by their autho
ürün paylaşıldı

              The Signal Envelopes   indicator uses the robust filtering method based on: (1) the moving median Buff0 = <Median> = (Max {x} + Min {x}) / 2 and (2) the averaging algorithm developed by the author Buff1 = <(<Median> ) ^ (- 3)> * (<Median>) ^ 4  based on the moving median. The Signal Envelopes   indicator allows you to most accurately and with the minimum possible delay set the

Aleksey Ivanov
Aleksey Ivanov
Signal Envelopes https://www.mql5.com/en/market/product/46593
The Signal Envelopes indicator uses the robust filtering method based on: (1) the moving median Buff0 = < Median> = (Max {x} + Min {x}) / 2 and (2) the averaging algorithm developed by the author Buff1 = <( ) ^ (- 3)> * ( ) ^ 4 based on the moving median. The Signal Envelopes indicator allows you to most accurately and with the minimum possible delay set the beginning of a new trend. The Signal Envelopes indicator can be used both for trading according to scalper strategies, and when using long-term trading strategies.
✔️The indicator has all kinds of alerts.
✔️ The indicator does not redraw
✔️The algorithms of this indicator are unique and developed by their author
Aleksey Ivanov
Aleksey Ivanov
Signal Channel https://www.mql5.com/en/market/product/50988
The Signal Channel indicator uses a robust filtering method based on two moving medians applicable to the High and Low prices, i.e. the lines and , where <..> is the sign of linear averaging, which are shifted by certain values in an uptrend and by opposite values in a downtrend, which allows you to get a narrow channel, approximately outlining each bar. Sharp kinks of the lines of such a channel allow the most accurate and minimal possible delay to establish the beginning of a new trend movement. The possible change in the direction of the trend is also indicated by sharp narrowing of the channel lines, which, in fact, is expressed by the fall in volatility. The indicator also has an additional filtering function, upon activation of which the signal is identified only after a decrease in volatility, which makes the indicator more reliable. In addition to the main channel, inside which the most probable price fluctuations occur, an auxiliary channel is built (in dashed lines), beyond the borders of which the price does not go anymore, which serves to set stoplosses on it.
✔️ The Signal Channel indicator can be used both for trading according to scalper strategies, and when using long-term trading strategies.
✔️ It has built-in management
✔️ The indicator has all types of alerts.
✔️ The indicator does not redraw.
✔️ One of the best indicators with optimal market noise filtering.
ürün paylaşıldı

The principle of constructing indicator lines and their meaning .               The Signal Channel   indicator uses a robust filtering method based on two moving medians applicable to the High and Low prices, i.e. the lines <High> and <Low>, where <..> is the sign of linear averaging, which are shifted by certain values ​​in an uptrend and by opposite values ​​in a downtrend, which allows you to get a narrow

ürün paylaşıldı
İncelemeler: 4
FREE

Principles of construction of the indicator.               The Absolute Bands (AB) indicator is reminiscent of the Bollinger Bands indicator with its appearance and functions, but only more effective for trading due to the significantly smaller number of false signals issued to them. This effectiveness of the Absolute Bands indicator is due to its robust nature

Aleksey Ivanov
Aleksey Ivanov
Absolute Bands FREE https://www.mql5.com/en/market/product/33826
The Absolute Bands indicator is reminiscent of the Bollinger Bands indicator with its appearance and functions, but only more effective for trading due to the significantly smaller number of false signals issued to them. This effectiveness of the Absolute Bands indicator is due to its robust nature.
✔️ One of the best indicators with optimal market noise filtering.Absolute Bands FREE https://www.mql5.com/en/market/product/33826 
The Absolute Bands indicator is reminiscent of the Bollinger Bands indicator with its appearance and functions, but only more effective for trading due to the significantly smaller number of false signals issued to them. This effectiveness of the Absolute Bands indicator is due to its robust nature.
✔️ One of the best indicators with optimal market noise filtering.
1
ürün paylaşıldı

49.00 USD

Introduction.             The indicator predicts the price in accordance with the prevailing trend  and its own small statistical price fluctuations around this trend. At the same time, in StatPredict , you need to set the time horizon of the forecasted events, which is set by the parameter settings of the “ Length of forecast in bars ” indicator and determined by the characteristic time scale of the current   trend, which is

Aleksey Ivanov
Aleksey Ivanov
StatPredict https://www.mql5.com/en/market/product/38721
✔️The indicator predicts the price in accordance with the prevailing trend and its own small statistical price fluctuations around this trend. Using mathematical methods for predicting random processes, StatPredict indicator predicts the most probable values of the future price and calculates the confidence interval for them.
✔️StatPredict also provides the option to calculate the lot, based on the positions of the last points of the calculated channel of confidence probability, as well as the size of the deposit and the allowable risk, which are specified in the indicator settings.
✔️The algorithms of this indicator are unique and developed by their authorStatPredict https://www.mql5.com/en/market/product/38721 
✔️The indicator predicts the price in accordance with the prevailing trend and its own small statistical price fluctuations around this trend. Using mathematical methods for predicting random processes, StatPredict indicator predicts the most probable values of the future price and calculates the confidence interval for them.
✔️StatPredict also provides the option to calculate the lot, based on the positions of the last points of the calculated channel of confidence probability, as well as the size of the deposit and the allowable risk, which are specified in the indicator settings. 
✔️The algorithms of this indicator are unique and developed by their author
1
ürün paylaşıldı

The principle of the indicator.               A simple moving average (SMA) with an averaging period (2n + 1) of bars is always obtained lagging by n bars. If SMA or other types of moving averages are the basis for making trading decisions, then their strong delay does not allow   to open positions in time and close positions, which leads to losses.             

Aleksey Ivanov
Aleksey Ivanov
Estimation moving average without lag https://www.mql5.com/en/market/product/36945
A simple moving average (SMA) with an averaging period (2n + 1) of bars is always obtained lagging by n bars. If SMA or other types of moving averages are the basis for making trading decisions, then their strong delay does not allow to open positions in time and close positions, which leads to losses.
The Estimation moving average without lag indicator calculates an estimate of a non-lagging moving average and displays the corresponding confidence interval.
✔️The algorithms of this indicator are unique and developed by their author
Author Aleksey Ivanov https://www.mql5.com/en/users/60000382Estimation moving average without lag https://www.mql5.com/en/market/product/36945 
A simple moving average (SMA) with an averaging period (2n + 1) of bars is always obtained lagging by n bars. If SMA or other types of moving averages are the basis for making trading decisions, then their strong delay does not allow to open positions in time and close positions, which leads to losses.
The Estimation moving average without lag indicator calculates an estimate of a non-lagging moving average and displays the corresponding confidence interval.
✔️The algorithms of this indicator are unique and developed by their author
Author Aleksey Ivanov https://www.mql5.com/en/users/60000382
1
Aleksey Ivanov
Aleksey Ivanov
Friends, I am a theoretical physicist and a trader, mathematically rigorously studying market processes, aspects of which I have already begun to present in my articles. https://www.mql5.com/en/articles/10955
https://www.mql5.com/en/articles/11158
Based on a rigorous theory, I have developed indicators with optimal market noise filtering for trading. https://www.mql5.com/en/blogs/post/741637
However, it should be emphasized that a trader (investor) should choose the direction of his positions on the basis of fundamental analysis, and correctly applied indicators of optimal filtering of market noise should be only its auxiliary tool. These indicators are used to determine:

(1) market entry points are determined,
(2) the positions of stop-loss and profit and their order (time and number of points) of movement are determined,
(3) determine the size of the opened lots (calculated through money management built into the work of many indicators presented here).

I emphasize that for today's highly volatile market, these (1-3) statistically calculated parameters of the game are also (like fundamental analysis) key, in the sense that without them it will be generally impossible to get a stable profit.

Subscribe to my channel and you will be aware of my latest developments in the field of trading
https://www.mql5.com/en/channels/statlab
Aleksey Ivanov
Aleksey Ivanov
Friends! The foreign exchange market in our time is an absolute chaos. If you play on the foreign exchange market, then you should treat it exactly like a game, i.e. it is the same as playing in a casino. Don't expect this game to be your main source of income. These are false hopes. Therefore, play for extra money. In no case do not play with borrowed money from someone (banks, friends, etc.). This will lead to disaster.

There is a little more order in the stock market than in the foreign exchange market. Here you can rely on fundamental data on the economic condition (financial statements, etc.) of the companies that issue the respective shares. But here, in our time, when the global crisis is approaching, the data provided by even reputable experts can be unreliable. However, the indicators I provide are better applied to the stock market, which is more orderly.

Modern profitable indicators https://www.mql5.com/en/blogs/post/741637
Aleksey Ivanov
Aleksey Ivanov
Channel Builder FREE https://www.mql5.com/en/market/product/34818
The Channel Builder (CB) or Ivanov Bands indicator is a broad generalization of the Bollinger Bands indicator. First, in CB, the mean line is calculated using various averaging algorithms. Secondly, the mean deviations calculated by Kolmogorov averaging are plotted on both sides of the middle line .
✔️The algorithms of this indicator are unique and developed by their author
ürün paylaşıldı
İncelemeler: 6
FREE

               The Channel Builder (CB) or Ivanov Bands indicator is a broad generalization of the Bollinger Bands indicator. First, in CB, the mean line <X> is calculated using various averaging algorithms. Secondly, the mean deviations calculated by Kolmogorov averaging are plotted on both sides of the middle line <X>.                The middle line

Aleksey Ivanov
Aleksey Ivanov
Alligator Analysis FREE https://www.mql5.com/en/market/product/35227
The “Alligator Analysis” (AA) indicator allows you to build various (by averaging types and by scales) “Alligators” and their combinations, i.e. allows you to analyze the state of the market based on the correlation of this state with a whole range of different "Alligators". The classic "Alligator" by Bill Williams is based on moving averages and Fibonacci numbers, which makes it one of the best indicators now. The classic "Alligator" is based on Fibonacci numbers and is a combination of three smoothed moving averages (SМMA) with periods 5, 8 and 13, which are part of the Fibonacci sequence. In this case, the moving averages are shifted forwards by 3, 5, and 8 bars, respectively, which are numbers from the same sequence (preceding the corresponding period values).
Alligators from the AA indicator is based, on the same principle as the classic “Alligator”, but on different parts of a number of Fibonacci numbers, as well as on different moving average averaging algorithms.
The indicator AA uses 6 types of averaging, where the classical averaging SMA, EMA, SMMA, LMA are supplemented by averaging the moving average by the median and averaging weighted by volume.
Line shifts can be removed. The colors of the AA indicator lines are set according to the type of color spectrum: from violet for a small smoothing period to red - for the largest period.
ürün paylaşıldı
İncelemeler: 4
FREE

Indicator description.            The “ Alligator Analysis ” ( AA ) indicator allows you to build various (by averaging types and by scales) “ Alligators ” and their combinations, i.e. allows you to analyze the state of the market based on the correlation of this state with a whole range of different " Alligators ".  The classic " Alligator " by Bill Williams is based on moving averages and Fibonacci numbers, which makes it one of the best

Aleksey Ivanov
Aleksey Ivanov
Friends! The foreign exchange market in our time is an absolute chaos. If you play on the foreign exchange market, then you should treat it exactly like a game, i.e. it is the same as playing in a casino. Don't expect this game to be your main source of income. These are false hopes. Therefore, play for extra money. In no case do not play with borrowed money from someone (banks, friends, etc.). This will lead to disaster.

There is a little more order in the stock market than in the foreign exchange market. Here you can rely on fundamental data on the economic condition (financial statements, etc.) of the companies that issue the respective shares. But here, in our time, when the global crisis is approaching, the data provided by even reputable experts can be unreliable. However, the indicators I provide are better applied to the stock market, which is more orderly.
(Modern profitable indicators https://www.mql5.com/en/blogs/post/741637 )