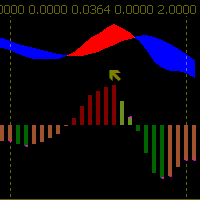
Tick Volume Pressure

Tick Volume Pressure

MetaTrader 5 Indicator | Release: F2.0

Tick Volume Pressure

Overview

Tick Volume Pressure is a separate-window oscillator designed to visualize estimated bullish and bearish market pressure using candle movement and tick-volume activity.

The indicator combines a color-coded directional histogram, relative-strength highlighting, automatic symmetric scaling, and a configurable Power Summary panel in one compact view.

Its default configuration uses Hybrid calculation mode, ATR-based normalization, and a 5-minute Power Summary.

Visual Elements

  • Lime histogram: Regular bullish directional pressure.

  • Dark green histogram: Bullish pressure with relatively high strength.

  • Salmon histogram: Regular bearish directional pressure.

  • Maroon histogram: Bearish pressure with relatively high strength.

  • Zero line: Separates bullish and bearish directional pressure.

  • Symmetric scaling: Automatically adjusts the upper and lower boundaries to keep zero centered.

  • Power Summary panel: Displays accumulated bullish and bearish pressure over a configurable time window.

  • Delta histogram: Optionally displays the net difference between accumulated bullish and bearish pressure.

The histogram represents estimated directional pressure, not actual buy or sell transaction volume.

Inputs

Histogram Settings

Input Default Description
CalculationMode Hybrid Selects the directional-pressure measurement mode.
StrengthPeriod 20 Historical comparison period for relative-strength detection.
StrengthMultiplier 1.50 Sensitivity threshold for highlighting stronger histogram bars.
NormalizationMode ATR Selects the normalization method used for histogram values.
ATRPeriod 14 ATR reference period when ATR normalization is selected.
HistogramWidth 3 Histogram bar width, from 1 to 5.

Power Summary Panel

Input Default Description
ShowPowerSummary true Shows or hides the Power Summary panel.
ShowText true Shows panel statistics and labels. When disabled, only the graphical display remains.
SummaryDelta false Switches between separate bullish/bearish totals and net directional pressure.
SummaryMinutes 5 Time window used to accumulate directional pressure, in minutes.
SummarySide Right Positions the panel on the left or right side of the indicator window.
SummaryIncludeLiveBar true Includes the currently forming candle in the summary.
SummaryX 12 Horizontal panel offset in pixels.
SummaryY 22 Vertical panel offset in pixels.
SummaryWidth 205 Panel width in pixels.
SummaryHeight 155 Panel height in pixels.

Power Summary Colors

Input Default Description
SummaryBackground Black Background color of the summary panel.
SummaryTextColor Silver Color of the panel text and reference line.
SummaryBullColor Lime Color representing bullish pressure.
SummaryBearColor Salmon Color representing bearish pressure.

Interpretation

  • Positive histogram values indicate estimated bullish directional pressure.

  • Negative histogram values indicate estimated bearish directional pressure.

  • Increasing histogram magnitude indicates stronger estimated directional pressure.

  • Decreasing magnitude indicates weakening directional pressure.

  • Darker histogram colors identify relatively stronger readings compared with recent activity.

  • Repeated alternation around zero may indicate changing directional pressure or less consistent market movement.

  • Sustained pressure on one side of zero may suggest directional dominance, but does not guarantee trend continuation.

Power Summary

The Power Summary panel provides an aggregated view of directional pressure over a selected time window.

Standard Mode (SummaryDelta = false)

  • Displays accumulated bullish and bearish pressure separately.

  • Allows comparison of directional dominance within the selected period.

  • Displays relative power shares when text is enabled.

Delta Mode (SummaryDelta = true)

  • Displays net bullish pressure minus bearish pressure.

  • Positive values indicate bullish dominance.

  • Negative values indicate bearish dominance.

  • Values near zero indicate relatively balanced accumulated pressure.

The percentages represent relative indicator power, not actual percentages of market buy and sell transactions.

Notes

  • The indicator operates in a separate window and does not modify the main price chart.

  • Automatic symmetric scaling keeps the zero line centered and adjusts to the visible histogram values.

  • The current candle may change direction, magnitude, and color until it closes.

  • The Power Summary includes candles according to their opening times within the selected window.

  • The summary panel can be positioned on either side of the indicator window.

  • The graphical summary remains available when text display is disabled.

  • The summary panel may be hidden automatically when the indicator window is too small.

  • Results depend on the instrument, timeframe, broker tick-volume data, and historical data availability.

  • Short custom timeframes require an external chart or data source. The indicator does not generate custom timeframes.

  • The indicator does not open, modify, or close trades.

  • The displayed pressure values are analytical estimates, not direct exchange order-flow measurements.

Version F2.0

  • Updated the product name to Tick Volume Pressure.

  • Standardized the source header, version information, and copyright attribution.

  • Organized input parameters into clearly defined groups.

  • Preserved the directional histogram and relative-strength highlighting.

  • Retained multiple calculation and normalization modes.

  • Maintained the configurable Power Summary panel.

  • Supported separate bullish/bearish summaries and net-delta visualization.

  • Retained optional text display and left/right panel placement.

  • Maintained automatic symmetric scaling with a centered zero line.

  • Updated the product documentation for MQL5 Showcase.

Disclaimer

Tick Volume Pressure is provided for analytical and educational purposes.

The indicator estimates directional pressure using available market data. It does not measure actual buyer-initiated or seller-initiated transactions, guarantee future price direction, or provide guaranteed trading signals.

Trading decisions should consider additional market context and appropriate risk management. Past market behavior does not guarantee future results.


Önerilen ürünler
Heiken Ashi Smoothed Strategy is a very simple but powerful system to get forex market trend direction. This indicator is actually 2 indicators in 1 pack, Heiken Ashi and Heiken Ashi Smoothed Moving Average both included. Because HA (Heiken Ashi) and HAS (Heiken Ashi Smoothed) are calculated in the same one system event with necessary buffers and loop only, so it is the FAST, OPTIMIZED and EFFICIENT HA having the combined indicator of MetaTrader 5. You can choose to display HA and HAS in the sam
Технический индикатор Universal Oscillator является комбинацией торговых сигналов самых популярных и широко используемых осцилляторов. Индикатор представлен гистограммами, а также линиями fast и slow MA, что позволяет расширить список получаемых торговых рекомендаций и работать как по тренду, так и в боковом движении рынка. Таким образом, гистограммы позволяют определить момент пробоя ценовых значений и движение в новой фазе рынка, а линии указывают на зоны перекупленности и перепроданности.  Ос
This indicator is the same as the popular Heiken Ashi Smoothed. The Heikin Ashi indicator for MetaTrader 5 already exists, but it has two disadvantages: It paints the candles not accurate. It's not possible to change the candle width. See also Heikin Ashi in MQL5 Code Base . In this version there are no such disadvantages.
The Accumulation / Distribution is an indicator which was essentially designed to measure underlying supply and demand. It accomplishes this by trying to determine whether traders are actually accumulating (buying) or distributing (selling). This indicator should be more accurate than other default MT5 AD indicator for measuring buy/sell pressure by volume, identifying trend change through divergence and calculating Accumulation/Distribution (A/D) level. Application: - Buy/sell pressure: above
Breakout Divergence RSI MultiFilter is a modular technical analysis indicator for MetaTrader 5 designed to identify Regular and Hidden RSI Divergences alongside confirmed trendline breakout continuation opportunities. Equipped with an algorithmic multi-layer filtering engine comprising 16 technical filter systems, this indicator provides an analytical bridge between momentum divergence recognition and structural price action confirmation. 1. TECHNICAL OVERVIEW AND ARCHITECTURE Breakout Diverge
MACD Advanced
Stanislav Korotky
This indicator provides you with MACD formula applied to volume-aware Accumulation/Distribution and OnBalance Volumes indicators. In addition to tick volumes it supports special pseudo-real volumes, synthesized for Forex symbols where real volumes are unknown. More details on the volume surrogates may be found in description of another indicators - TrueVolumeSurrogate and OnBalanceVolumeSurrogate (algorithm of the latter is used internally in MACDAD for AD and OBV calculation before they procee
TapeResilience — Volume Flow and Price Impact Analysis Volume Analysis | Order Flow | Price Impact | Market Response TapeResilience is a market activity analysis indicator for MetaTrader 5, designed to help traders study the relationship between trading volume, directional pressure, price impact, and subsequent market reactions. Instead of relying on traditional Buy/Sell signals alone, TapeResilience evaluates unusual market activity and observes how prices respond after significant directional
Rapid Pulse Scalper
Muhammad Mustajab Bajwa Muhammad Ri
Rapid Pulse Scalper Fast Signals. Precise Entries. Smart H1 Scalping Control. Rapid Pulse Scalper is a professional MT5 scalping indicator designed for traders who want clean, fast, and filtered Buy/Sell signals on major forex pairs using the H1 timeframe . It uses a multi-confirmation signal system to help reduce market noise and focus on higher-quality trading opportunities. This indicator is built for disciplined traders who want simple chart signals, structured trade levels, and smart trade
Buy Sell Smart
Syamsurizal Dimjati
BUY and SELL smart The BUY and SELL Smart Indicator is a next-generation trading tool engineered for precision scalpers, intraday strategists, and professional analysts who demand both speed and clarity in market visualization. It seamlessly integrates smart candle-based analytics, adaptive ATR logic, and real-time economic event awareness — giving you a fully synchronized view of market volatility and momentum. Through an elegant and optimized interface, FlashScalp delivers   instant signal fee
The Super Arrow Indicator provides non-repainting buy and sell signals with exceptional accuracy. Key Features No repainting – confirmed signals remain fixed Clear visual arrows: green for buy, red for sell Real-time alerts via pop-up, sound, and optional email Clean chart view with no unnecessary clutter Works on all markets: Forex, gold, oil, indices, crypto Adjustable Parameters TimeFrame Default:   "current time frame" Function:   Sets the time frame for indicator calculation Options:   Can
Type(1EMA,2DEMA,3TEMA) FastPeriod SlowPeriod SignalPeriod PriceApplied ( HIGH(H) LOW(L) OPEN(O) CLOSE(C) MEDIAN(HL) TYPICAL(HLC) WEIGHTED(HLCC) ) Deviate Up Deviate Down Deviate Bar What Is Moving Average Convergence/Divergence (MACD)? Moving average convergence/divergence (MACD, or MAC-D) is a   trend-following   momentum   indicator that shows the relationship between two   exponential moving averages (EMAs)   of a   security’s   price. The MACD line is calculated by subtracting the 26-peri
Smart Trend Trading System — MetaTrader 5 Satın aldıktan sonra Smart Universal Expert Advisor'ı ÜCRETSİZ edinmek ve beraberinde çevrimiçi kurs, PDF kılavuzu ve özel gruba erişim almak için MQL5 üzerinden bana mesaj gönderin. STTS; trend yönünü, giriş ve çıkış sinyallerini, dönüş bölgelerini ve önemli fiyat seviyelerini doğrudan grafiğinizde bir araya getirir. Sistemi manuel işlemler için kullanabilir veya ayrı bir uyumlu EA’yı bağlayarak seçtiğiniz ayarlarla otomatik işlem gerçekleştirebilirsini
Gfx Institutional Order Flow Pro MT5 v3.02   Live results:  https://www.mql5.com/en/ Advanced Institutional Order Flow Analytics — analyzes market structure, liquidity, order blocks, imbalances, and institutional trading conditions. Adaptive Institutional Intelligence — dynamically evaluates market conditions and setup quality using multi-factor institutional analytics. Multi-Timeframe Market Confirmation — combines structure and directional information across multiple timeframes for stronger
DAILY OH/OL SDEV QUANT MODEL - STATISTICAL TRADING WITH PRECISION RISK MANAGEMENT TRADE WITH MATHEMATICAL CERTAINTY - KNOW YOUR EXACT STOP-LOSS AND TAKE-PROFIT BEFORE YOU ENTER This indicator analyzes 5,000+ days of price history to give you: Exact entry levels (sigma bands locked at daily open) Exact stop-loss distance (from M
TRI Visualizer
Yoshimi Mon 三 Ura
TRI Visualizer MT5 – Thermodynamic Market Analysis Overview The TRI (Thermal Range Indicator) Visualizer Enhanced is a rare market analysis indicator that goes beyond conventional technical analysis, applying principles of thermodynamics from physics. It interprets market price fluctuations as “thermodynamic energy,” enabling the highly accurate detection of subtle market changes that are often overlooked. Innovative Mechanisms 1. Dual Calculation Engines Classic TRI Mode Formula: |Close
HMA Trend Professional MT5
Pavel Zamoshnikov
4.25 (4)
Improved version of the free HMA Trend indicator (for MetaTrader 4) with statistical analysis. HMA Trend is a trend indicator based on the Hull Moving Average (HMA) with two periods. HMA with a slow period identifies the trend, while HMA with a fast period determines the short-term movements and signals in the trend direction. The main differences from the free version: Ability to predict the probability of a trend reversal using analysis of history data. Plotting statistical charts for analyzi
Enhanced Elliott Wave Pro – Advanced Market Structure & Wave Analysis   Enhanced Elliott Wave Pro is a lightweight, institutional-grade MT5 indicator that eliminates chart clutter by detecting and displaying only the current, active market structure: the 1-2-3-4-5 Impulse wave and the subsequent A-B-C Correction.   Built with classic Prechter wave rules and ATR-adaptive pivot detection, it delivers clean, real-time wave counts without bogging down your terminal.   ――――――――――――――――――――――――――――
SafePair Manual Trader Pro MultiPairs SafePair Manual Trader Pro MultiPairs , MetaTrader 5 için geliştirilmiş gelişmiş bir Expert Advisor’dır. Profesyonel manuel trading, yarı otomatik işlem yönetimi, çoklu sembol takibi, risk planlaması ve akıllı piyasa analizini tek bir güçlü kontrol paneli üzerinden desteklemek için tasarlanmıştır. Bu EA, hızlı manuel emir yürütme, yapılandırılmış risk kontrolü, akıllı trading desteği ve grafik üzerinde net karar desteği isteyen trader’lar için geliştirilmişt
GoldPro Max
Taher Ahmed Mohamed Taha Elshafei
GOLDPRO MAX Advanced Multi-Timeframe and Smart Money Market Analysis for MetaTrader 5 GoldPro Max is a professional market analysis indicator for MetaTrader 5 designed to help traders study market direction, price structure, liquidity, market imbalance and potential trading areas from multiple perspectives. The indicator combines Multi-Timeframe Analysis, Smart Money Concepts, Market Structure, Liquidity Analysis, Order Blocks, Fair Value Gaps, Premium and Discount analysis, Smart Analytical Eng
MA Simulator – Fiyat Hedefinize Ulaşmadan Önce Hareketli Ortalama Değişimlerini Simüle Edin MA Simulator, mevcut bar belirli bir fiyata ulaştığında Hareketli Ortalamanın (MA) nasıl değişeceğini simüle eden MetaTrader 5 için analitik bir göstergedir. Fiyat belirtilen seviyeye gerçekten ulaşmadan önce tahmini MA seviyesini ve eğimini kontrol edebilirsiniz. Araç, yükseliş trendi içindeki geçici düşüşler sırasında potansiyel alım seviyelerini, düşüş trendi içindeki geçici yükselişler sırasında p
Passband Filter Pro Passband Filter Pro is a trend and cycle oscillator for MetaTrader 5. It is built on the Ehlers Super Passband Filter, a band pass filter that removes long term trend drift and short term noise so that only the dominant market cycle remains. The result is a clean oscillator with a color cloud that shows overbought and oversold conditions, cycle turns, and momentum on forex, gold, indices, stocks and crypto. Most traders enter too early or too late. Simple moving averages la
This indicator presents an alternative approach to identify Market Structure. The logic used is derived from learning material created by   DaveTeaches (on X) Upgrade v1.10: + add option to put protected high/low value to buffer (figure 11, 12) + add  Retracements  value to buffer when Show Retracements When quantifying Market Structure, it is common to use fractal highs and lows to identify "significant" swing pivots. When price closes through these pivots, we may identify a Market Structure S
Time and Sales, Time and Sales Indicator, Tape Reading, Pressure Book, Buy Sell Pressure, Tick Analysis, Market Pressure, Tick Data, Price Movement Analysis, Tick Strength, Momentum Analysis, Buy Sell Movement, Movement Sequences, Real-Time Tick Monitor, Trading Dashboard, Points Analysis, Customizable Alerts, MT5 Indicator Pressure Book - Tick Analysis and Buy/Sell Pressure Indicator for MT5 Pressure Book is a MetaTrader 5 indicator designed to monitor tick-based price movements and display es
Mini Chart (Canvas) is a lightweight, interactive sub-chart that overlays directly onto your main MetaTrader 5 chart. Designed for traders who want a compact, customizable view of another symbol or timeframe, this tool delivers real-time price action in a clean, resizable canvas — perfect for multi-symbol monitoring, scalping setups, or visual strategy overlays.  Key Features: • Multi-Symbol & Multi-Timeframe Support: Display any symbol and timeframe independently from the main chart. • Resizab
Order Flow Strength
Vincent Jose Proenca
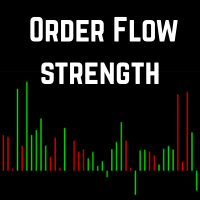
Order Flow Strength (OFS) Açıklama: Bu gösterge, her mumun kapanış fiyatının aralıkta nerede olduğunu analiz ederek, hacim ile ağırlıklandırılmış şekilde sipariş akışının gücünü ölçer. Ayrı bir panelde alım baskısı (yeşil) ve satım baskısı (kırmızı) gösterir. Formül Order Flow Strength = Close − Low High − Low × Volume \text{Order Flow Strength} = \frac{\text{Close} - \text{Low}}{\text{High} - \text{Low}} \times \text{Volume} Order Flow Strength = High − Low Close − Low ​ × Volume Close : mum k
Auto Trade Journal with Screenshots Her işlemi tam o anın ekran görüntüsüyle otomatik olarak kaydeder İşlem günlüğü tutmak her mentorun önerdiği ama neredeyse hiç kimsenin sürdüremediği bir alışkanlıktır, çünkü elle yapmak yavaştır ve kolayca atlanır. Yazılı bir günlük rakamları not edebilir, ama pozisyona girdiğiniz ya da çıktığınız anda grafiğin gerçekte nasıl göründüğünü asla gösteremez, oysa asıl ders tam da orada saklıdır. Auto Trade Journal with Screenshots bunu sizin için, tüm hesap genel
The Premier League indicator links the price in a cyclical-wave relationship. Crossing points can be used as potential market reversal points. Thus, all crossing points will be optimal points at which the movement changes taking into account the indicator period. But do not forget that the approach must be complex, the indicator signals require additional information to enter the market.
An indicator of pattern #31 ("Long Island") from Encyclopedia of Chart Patterns by Thomas N. Bulkowski. The second gap is in the opposite direction. Parameters: Alerts - show alert when an arrow appears   Push - send a push notification when an arrow appears (requires configuration in the terminal) GapSize - minimum gap size in points ArrowType - a symbol from 1 to 17 ArrowVShift - vertical shift of arrows in points   ShowLevels - show levels ColUp - color of an upward line ColDn - color of a d
**   All Symbols   x   All Timeframes   scan just by pressing scanner button ** Discount: The price is 100$, But now it is just 39$, Limited time offer is active. *** Contact me  to send you instruction and add you in "Trend Reversal group" for sharing or seeing experiences with other users. + FREE   Trading Utility MT5 - Big Update: 2026/10/22 Introduction: Trendlines are the most famous technical analysis in trading . Trendlines continually form on the charts of markets across all the differe
Renko + ATR Trend Envelope PRO+ (Non-Repainting) Renko + ATR Trend Envelope PRO+ is a clean trend-filter indicator that combines a Renko-style step histogram with an ATR-based trend envelope. It highlights trend direction, volatility expansion/contraction and trend reversals with arrows and optional alerts. This tool is ideal for: Trend following strategies Breakout confirmation Filtering false entries during choppy markets Visualizing volatility using ATR envelopes Key Features Renko-Style Hi
Bu ürünün alıcıları ayrıca şunları da satın alıyor
Trend Sniper X
Sarvarbek Abduvoxobov
4.86 (43)
Trend Sniper X , tüccarların trend yönünü ve olası dönüş noktalarını netlik ve hassasiyetle belirlemelerine yardımcı olan MetaTrader 5 için çoklu zaman dilimli bir trend takip göstergesidir. MT4 için: https://www.mql5.com/en/market/product/193245 Fiyat Bilgisi: Mevcut fiyat tanıtım amaçlıdır ve gelecek güncellemeler ile yeni özellikler yayınlandıkça değişebilir. Bonus Fırsatı: Bu indikatör için ÜCRETSİZ Oto-Trade Assistant EA'yı almak için lütfen satın aldıktan sonra yazara mesaj gönderin. Code
Şehre yeni bir Kral geldi - Gösterge + Emir Yönetimi göstergeleri (TP1 + TP2 + TP3) + Opsiyonel Telegram Sinyal Gönderici DAHİL (ÜCRETSİZ) (TAM TRADING ve SİNYAL SİSTEMİ) Altın için en iyi EA’mız: Gold Slayer Bu gösterge; gelişmiş bir strateji, özelleştirilebilir emir yönetimine sahip bir trading sistemi ve envelope uzantılarını birleştiren bir mean reversion sistemi içerir. Ayrıca RSI gibi birçok akıllı onay filtresiyle desteklenerek yüksek olasılıklı dönüş girişlerini AL ve SAT sinyalleriyle y
Zoryk Gold
Reda El Koutbane
4.78 (18)
ZORYK — MetaTrader 5 İçin Gelişmiş XAUUSD Sinyal Sistemi Bu hissi biliyorsunuz. Altını analiz etmek için uzun zaman harcarsınız. Doğru giriş noktasını beklersiniz. Sonunda işlemi açarsınız ve fiyat hemen aleyhinize hareket etmeye başlar. İşlemi çok erken kapatırsınız, Stop Loss seviyesini değiştirirsiniz veya birkaç saniye tereddüt edersiniz. Daha sonra piyasa, başlangıçta beklediğiniz hedefe tam olarak ulaşır; ancak siz artık işlemin içinde değilsinizdir. Sorun her zaman yön değildi. Asıl sorun
İşlem avantajınızı görüş alanınıza alın! M5 Sniper , MeanFX tarafından geliştirilen yeni bir indikatördür. Hassas işlem sinyallerini adaptif TP/SL seviyeleriyle birleştirir — bunun sonucunda mümkün olan en iyi istatistiksel işlemleri oluşturur! Fiyat her 5 satın alımda bir artar, bir sonraki fiyat 69$ olacaktır. Satın aldıktan sonra ipuçları/rehber ve bonus EA almak için bana mesaj gönderin. Onu öne çıkaran nedir? Kanıtlanmış istatistiksel performans Gold XAUUSD üzerinde ( neredeyse her varlıkta
SuperScalp Pro
Van Minh Nguyen
4.54 (37)
SuperScalp Pro - Professional Multi-Layer Confluence Scalping System SuperScalp Pro, klasik Supertrend sistemini birden fazla akıllı doğrulama filtresiyle geliştiren ileri düzey bir scalping göstergesidir. Yanlış sinyalleri önemli ölçüde azaltırken başarı olasılığı daha yüksek Buy/Sell işlem fırsatlarını belirlemenize yardımcı olur. Buy ve Sell okları doğrudan grafik üzerinde net bir şekilde görüntülenir. ATR tabanlı Stop Loss ve Take Profit seviyeleri de gerçek zamanlı olarak otomatik hesaplanı
Gold Trend Coach MT5
Cristhian Alexander Gaibor Cuasquer
4.2 (10)
Gold Trend Coach, MetaTrader 5 için altın (XAUUSD) trend göstergesidir: mum kapanışında onaylanan (repaint yok) alış ve satış sinyalleri, stop loss ve üç take profit, sizi girişten TP3'e kadar yönlendiren bir koç, çoklu zaman dilimi paneli ve telefonunuza ve Telegram'a uyarılar. Londra ve New York seanslarında M1 ve M5 scalping ve M15 gün içi işlem için yapıldı. BONUS: Gold Trend Coach için ÜCRETSİZ otomatik işlem EA. Satın aldıktan sonra bana yazın, göstergenin sinyallerini kendisi işleyen EA'y
Entry Points Pro, emri vermeden önce nereden gireceğinizi, stopu nereye koyacağınızı ve hangi lotla işlem yapacağınızı gösterir. FİYAT Şu anda 149 USD ve bu fiyattan satılan son kopya. Sonrasında fiyat 199 USD'ye çıkacak, nihai fiyat ise 349 USD. Paramı piyasalarda işlem yaparak kazanıyorum ve bunu gösteriyorum, bu yüzden bu indikatörü herkese satmak zorunda değilim. Bu, kendi kafasıyla düşünen traderlar için bir araç, sihirli bir düğme değil. Ok mum kapanışında belirir ve repaint olmaz. İki ay
GoldenX Entry MT5
VividMind Digital Solutions
5 (17)
GoldenX Entry, adaptif Smart Entry Trend algoritmasına, sinyal skorlaması sistemine, piyasa rejimi algılayıcısına ve volatilite filtresine sahip bir MT5 indikatörüdür. Her sinyal; hesaplanmış bir giriş seviyesi, üç adet Take-Profit seviyesi (TP1, TP2, TP3) ve bir Stop-Loss seviyesi içerir. Farklı piyasa koşullarına uyum sağlamak için tasarlanmış çok katmanlı analitik yapı üzerine kuruludur ve yerleşik optimizasyon aracı ile istatistik takip sistemini birleştirir. Risk-ödül (RR) metrikleri ve geç
SMC Intraday Formula
VividMind Digital Solutions
5 (26)
Önce dürüst olalım. Hiçbir gösterge tek başına sizi kârlı yapmaz. Eğer biri size aksini söylüyorsa, size bir hayal satıyordur. Mükemmel al/sat okları gösteren her gösterge, kusursuzmuş gibi görünecek şekilde yapılabilir — sadece geçmişin doğru bir bölümünü yakınlaştırıp kazanan işlemleri ekran görüntüsü almanız yeterlidir. Biz bunu yapmıyoruz.  SMC Intraday Formula bir araçtır. Piyasa yapısını sizin için okur, en yüksek olasılıklı fiyat bölgelerini belirler ve şu anda akıllı paranın izinin nası
Ultra Indicator
Ihor Otkydach
5 (1)
ULTRA, “hepsi bir arada” prensibiyle çalışan bir teknik göstergedir; piyasayı bağımsız olarak analiz eder, işlem sinyalleri üretir, stop-loss emirlerinin verileceği seviyeleri gösterir ve kârı garantilemek ya da zararı en aza indirmek için işlemlerin ne zaman kapatılması gerektiğini önerir. Başka bir deyişle, piyasayı nasıl analiz edeceğinizi bilmeseniz, seviyeleri (stop-loss'unuzu nereye koyacağınızı) belirleyemeseniz ya da para yönetimi konusunda zorluk yaşasanız da fark etmez. ULTRA tüm bunla
Gann Made Easy , bay teorisini kullanarak ticaretin en iyi ilkelerine dayanan, profesyonel ve kullanımı kolay bir Forex ticaret sistemidir. WD Gann. Gösterge, Zararı Durdur ve Kâr Al Seviyeleri dahil olmak üzere doğru SATIN AL ve SAT sinyalleri sağlar. PUSH bildirimlerini kullanarak hareket halindeyken bile işlem yapabilirsiniz. Satın alma işleminden sonra, alım satım talimatlarını ve harika ek göstergeleri ücretsiz olarak almak için lütfen benimle iletişime geçin! Muhtemelen Gann ticaret yöntem
M1 Sniper MT5
Oleg Rodin
5 (7)
M1 SNIPER   kullanımı kolay bir işlem göstergesi sistemidir. M1 zaman dilimi için tasarlanmış bir ok göstergesidir. Gösterge, M1 zaman diliminde scalping için bağımsız bir sistem olarak kullanılabilir ve mevcut işlem sisteminizin bir parçası olarak kullanılabilir. Bu işlem sistemi özellikle M1'de işlem yapmak için tasarlanmış olsa da, diğer zaman dilimleriyle de kullanılabilir. Başlangıçta bu yöntemi XAUUSD ve BTCUSD ticareti için tasarladım. Ancak bu yöntemi diğer piyasalarda işlem yaparken de
Sonraki Güncelleme — Sürüm 2.52 Çok Yakında! [YENİ] Piyasa Analizinizi ve İşlem Sürecinizi Geliştirmek İçin Tasarlanmış 4 Büyük Yeni Özelliğe Hazır Olun İşlem ihtiyaçlarınızı karşılamak üzere tasarlanmış 4 yeni özellikle piyasa analizini bir üst seviyeye taşıyoruz. İşte yeni özellikler: 1. TRADE OVERVIEW DASHBOARD 2. CONFLUENCE AT ZONE 3. STRONG & WEAK HIGH/LOW 4. OTE 1. TRADE OVERVIEW DASHBOARD Piyasanın genel görünümünü daha kolay anlamanıza yardımcı olan, işlem kararlarınızı desteklemek için
Adaptive Price Action Engine Göstergeyi al, EA'sı (Uzman Danışman) bedava gelsin Kendi Kendini Optimize Eden Multi-Timeframe Trend ve Mum Formasyonu Analizi Piyasalar sürekli değişir ve her Price Action formasyonu her piyasa koşulunda aynı değere sahip değildir. Adaptive Price Action Engine , değişen piyasa koşullarına uyum sağlamak amacıyla trend yapısını, Multi-Timeframe analizini, mum formasyonlarını ve istatistiksel optimizasyonu tek bir analiz sistemi içerisinde birleştirir. İki Adaptif Mod
FiboSniper Pro
Van Minh Nguyen
5 (4)
FiboSniper Pro – Multi-Filter Fibonacci System with Auto SL/TP and Control Panel FiboSniper Pro, seçilmiş Buy ve Sell sinyalleri üretmek için dinamik Fibonacci Envelopes ile birden fazla doğrulama filtresini birleştiren teknik bir göstergedir. Fibonacci seviyeleri Moving Average ve ATR temel alınarak hesaplanır ve ardından ADX, EMA, RSI, ATR, Volume, Time ve Candle yapısı ile filtrelenir. Gösterge, ATR tabanlı otomatik Stop Loss ve Take Profit seviyelerini doğrudan grafik üzerinde görüntüler ve
Auto Optimized SpeedAngle , sürekli İleriye Dönük Optimizasyon (Walk-Forward Optimization, WFO) yoluyla eğri uydurmayı (curve-fitting) ortadan kaldıran kurumsal düzeyde bir momentum vektörleme sistemidir. Piyasa rejimleri değiştiğinde etkinliğini yitiren statik girdilere güvenmek yerine, gösterge, örneklem dışı (Out-of-Sample, OOS) doğrulama kullanarak parametrelerini dinamik olarak yeniden kalibre eder ve böylece gösterilen sinyallerin geçmişteki rastgele anomalileri değil, gerçek bir istatisti
Boba Analysis Suite
Trade Ready Solutions LLC
5 (2)
Boba Analysis Suite Boba Analysis Suite, MetaTrader 5 için geliştirilmiş bir analiz göstergesidir. Piyasa yapısını, önemli fiyat bölgelerini ve genel piyasa bağlamını tek bir grafik görünümünde bir araya getirir. Trader ve trading eğitmeni olarak edinilen uygulamalı deneyimden yola çıkarak geliştirilmiştir. Piyasanın yönünü değerlendirme, önemli seviyeleri belirleme ve birden fazla zaman dilimini birlikte inceleme gibi adımlardan oluşan sistematik bir analiz sürecini destekler. Piyasa Bağlamını
ScalpPoint
Temirlan Kdyrkhan
ScalpPoint is a powerful trading companion designed to generate high-probability entry signals with dynamic TP/SL/DP levels based on volatility. Built-in performance tracking shows win/loss stats, PP1/PP2 hits, and success rates — all updated live. Key Features: Buy/Sell signals with adaptive volatility bands Real-time TP/SL/DP levels based on ATR Built-in MA Filter with optional ATR/StdDev volatility Performance stats panel (Success, Profit/Loss, PP1/PP2) Alerts via popup, sound, push, or emai
ARICoins
Temirlan Kdyrkhan
ARICoin is a powerful trading companion designed to generate high-probability entry signals with dynamic TP/SL/DP levels based on volatility. Built-in performance tracking shows win/loss stats, PP1/PP2 hits, and success rates all updated live. Key Features: Buy/Sell signals with adaptive volatility bands Real-time TP/SL/DP levels based on ATR Built-in MA Filter with optional ATR/StdDev volatility Performance stats panel (Success, Profit/Loss, PP1/PP2) Alerts via popup, sound, push, or email Cust
Crystal Heikin Ashi Signals
Muhammad Jawad Shabir
5 (5)
Crystal Heikin Ashi Signals—Professional Trend & Signal Detection Indicator Advanced Heikin Ashi Visualization with Intelligent Signal System for Manual & Automated Trading Final Price: $149 ---------> Price goes up $10 after every 10 sales . Limited slots available — act fast . Overview User Guide PDF Crystal Heikin Ashi Signals is a professional-grade MetaTrader 5 indicator that combines pure Heikin Ashi candle visualization with an advanced momentum-shift detection system. Designed for both m
Scalper Vault, gün içi işlemlerde istikrar yakalamak isteyen yatırımcılar için tasarlanmış, güçlü ve tam donanımlı bir alım satım sistemidir. Bu yüksek hassasiyetli gösterge; hem Forex hem de İkili Opsiyon yatırımcıları için kurumsal düzeyde analizler sunan, bağımsız ve eksiksiz bir alım satım sistemi işlevi görür. SATIN ALIM İŞLEMİNDEN SONRA BENİMLE İLETİŞİME GEÇİN; ALIM SATIM İPUÇLARIMI VE HARİKA BİR BONUSU ALIN! Tahmin yürütme zorunluluğunu ve karmaşık manuel analiz süreçlerini ortadan kaldı
Azimuth Pro
Ottaviano De Cicco
5 (7)
Azimuth Pro V2: Synthetic Fractal Structure and Confirmed Entries for MT5 Overview Azimuth Pro is a multi-level swing structure indicator by Merkava Labs . Four nested swing layers, swing-anchored VWAP, ABC pattern detection, three-timeframe structural filtering, and closed-bar confirmed entries — one chart, one workflow from micro-swings to macro-cycles. This is not a blind signal product. It is a structure-first workflow for traders who care about location, context, and timing. Halloween P
Trend Catcher ind mt5
Ramil Minniakhmetov
5 (18)
TREND YAKALAYICI GÖSTERGE Trend Yakalayıcı Gösterge, yazarın tescilli ve özelleştirilmiş uyarlanabilir trend analiz göstergelerinin bir kombinasyonunu kullanarak piyasa fiyat hareketlerini analiz eder. Kısa vadeli gürültüyü filtreleyerek ve temel momentum gücüne, volatilite genişlemesine ve fiyat yapısı davranışına odaklanarak gerçek piyasa yönünü belirler. Ayrıca, hareketli ortalamalar, RSI ve volatilite filtreleri gibi yumuşatma ve trend filtreleme özelleştirilmiş göstergelerinin bir kombina
Volatility Master for MetaTrader is a real-time dashboard tool that scans up to  50 symbols  to identify high-volatility , trending markets instantly. With bullish/bearish signals, customizable alerts, and a user-friendly interface, it helps you avoid range-bound conditions and focus on high-probability trades. Clarity leads to confidence. Trade confidently and protect your capital effectively with this powerful dashboard. We don't offer free or bonus indicators in exchange of reviews from you.
Apex Patterns PRO İndikatörü Satın Alın - Üzerine Kurulu Expert Advisor'a ÜCRETSİZ Sahip Olun. Kendini Optimize Eden Grafik Formasyonu ve Kırılım Zekası Geleneksel formasyon tarayıcıları sabit girdilere dayanır ve piyasa volatilitesi ile yapıları değiştiğinde genellikle düşük performans gösterir. Apex Patterns PRO, yapısal grafik formasyon tanımayı, momentum filtrelemeyi ve istatistiksel kendi kendini optimizasyonu tek bir analitik çerçevede birleştirerek değişen piyasa koşullarına uyum sağlama
Unix Scalper
Issam Kassas
4 (4)
Unix Scalper — MetaTrader 5 Satın aldıktan sonra Smart Universal Expert Advisor'ı ÜCRETSİZ edinmek ve beraberinde çevrimiçi kurs, PDF kılavuzu ve özel gruba erişim almak için MQL5 üzerinden bana mesaj gönderin. İşlem fırsatını belirleyin. Planı görün. Nasıl işlem yapacağınıza karar verin. UNIX Scalper; piyasa analizini, BUY/SELL/WAIT kararlarını ve Entry, Stop Loss, TP1 ve TP2 seviyelerini düzenli bir panelde bir araya getirir. SİNYALİ VE PLANI GÖRÜN • Net kararlar: BUY, SELL veya WAIT. • Belir
Neuro Poseidon MT5
Daria Rezueva
4.68 (53)
Neuro Poseidon is a new indicator by Daria Rezueva. It combines precise trading signals with adaptive TP/SL levels - creating best possible trades as a result! Message me and get  Neuro Poseidon Assistant  as a gift to automize your trading process! What makes it stand out? 1. Proven profitability on all assets and timeframes 2. Only confirmed BUY and SELL signals present on the chart 3. Adaptive TP & SL levels generated by the software for each trade 4. Easy to understand - suitable for al
SIO Oscillator: Kendi Kendini Optimize Eden Yarı Varyans Dengesizlik Osilatörü İndikatörü satın alın, ona dayalı Uzman Danışmanı (EA) ÜCRETSİZ edinin. Çoğu osilatör, tüm fiyat hareketlerini aynı şekilde değerlendirir. SIO ise yükseliş ve düşüş baskısını birbirinden ayırır ve aralarındaki dengesizliği ölçerek piyasayı gerçekte kimin kontrol ettiğini gösterir: alıcılar mı, satıcılar mı. Dengesizlik bir uç noktaya ulaştığında SIO, giriş, Stop Loss ve Take Profit seviyeleriyle birlikte net bir sinya
Atomic Analyst MT5
Issam Kassas
4.5 (64)
Atomic Analyst — MetaTrader 5 Satın aldıktan sonra Smart Universal Expert Advisor'ı ÜCRETSİZ edinmek ve beraberinde çevrimiçi kurs, PDF kılavuzu ve özel gruba erişim almak için MQL5 üzerinden bana mesaj gönderin. Atomic Analyst; fiyat hareketini, trend yönünü, giriş ve çıkış sinyallerini, Stop Loss ve birden fazla Take Profit seviyesini doğrudan grafiğinizde bir araya getirir. SİNYALİ GÖRÜN. İŞLEM KOŞULLARINI ANLAYIN. Atomic Analyst, analizini anlaşılır görsel bilgiler halinde sunar: • Olası gir
Smc Pro ToolKit
Talal N Z Aljarusha
5 (14)
SMC PRO TOOLKIT — SMART MONEY ANALYSIS & STRUCTURED TRADE PLANNING SMC Pro ToolKit is a professional Smart Money Concepts analysis workspace for MetaTrader 5. It combines market structure, multi-timeframe analysis, institutional price zones, setup evaluation, confirmation tools, volume context, alerts, and risk planning inside one organized chart environment. One workspace. Multiple layers of confirmation. One structured trading plan. OPEN COMPLETE USER GUIDE MULTI-CONDITION SETUP ENGINE At
Yazarın diğer ürünleri
Floating P/L Price Line A lightweight MT5 indicator that displays your current floating profit or loss directly on the chart, following the current price level. Features: Real-time floating P/L display Profit and loss color indicators Symbol and Magic Number filters Customizable font, colors, and position Optional swap and account currency display Adjustable refresh interval A simple way to monitor open-position performance without opening the Trade tab.
FREE
Price to EMA Mean Histogram Version 1.10 for MetaTrader 4 Overview Price to EMA Mean Histogram is a separate-window oscillator that expresses the distance between price and a configurable moving-average mean as a percentage. It combines a close-price histogram, candle-extreme shadows, dynamic reference levels, and an optional fast EMA line in one compact view. The default configuration uses EMA 50 as the mean and EMA 14 as the fast reference. Visual Elements Bright bullish histogram: candle clos
Filtrele:
Değerlendirme yok
Değerlendirmeye yanıt