Sweep Setup Lab
- Göstergeler
-
Irina Tarabrina
 ChartZenFX develops technical indicators for MetaTrader 5, focusing on liquidity analysis, trading sessions and market structure.
- Sürüm: 1.41
- Etkinleştirmeler: 20
Sweep Setup Lab measures what happens AFTER a liquidity sweep.
It is not a signal indicator and not a general strategy tester. It measures one configurable setup model and reports what happened to every occurrence of it in the history you load.
THE SETUP MODEL IT MEASURES
1. A candle takes out the pool - the highest high, or lowest low, of the previous N closed candles - and closes back inside that pool.
2. That candle must pass two quality filters: how far the sweep went beyond the pool, measured in ATR, and how much of the candle was rejected, that is how far its close sits from the extreme within its own range.
3. Confirmation is a separate event. Within the confirmation window, a later candle must close beyond the OPPOSITE side of the sweep candle: below its low after a high sweep, above its high after a low sweep. Until that close happens the setup is not ready and no plan is built. If price takes out the sweep extreme first, the setup is cancelled; if the window runs out without a confirming close, it is dropped.
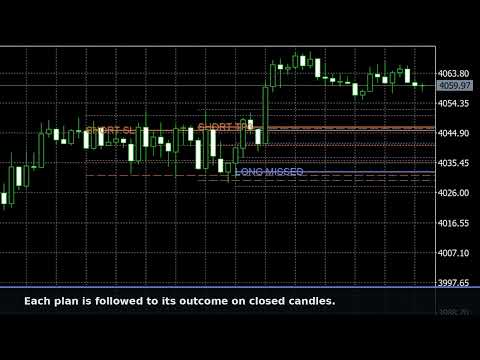
4. Only then is a plan built: stop beyond the sweep extreme plus an ATR buffer, and three targets, 1R, 2R and 3R by default - all three are inputs. The plan is then followed candle by candle, on closed candles only, with no look-ahead.
WHAT IT ANSWERS
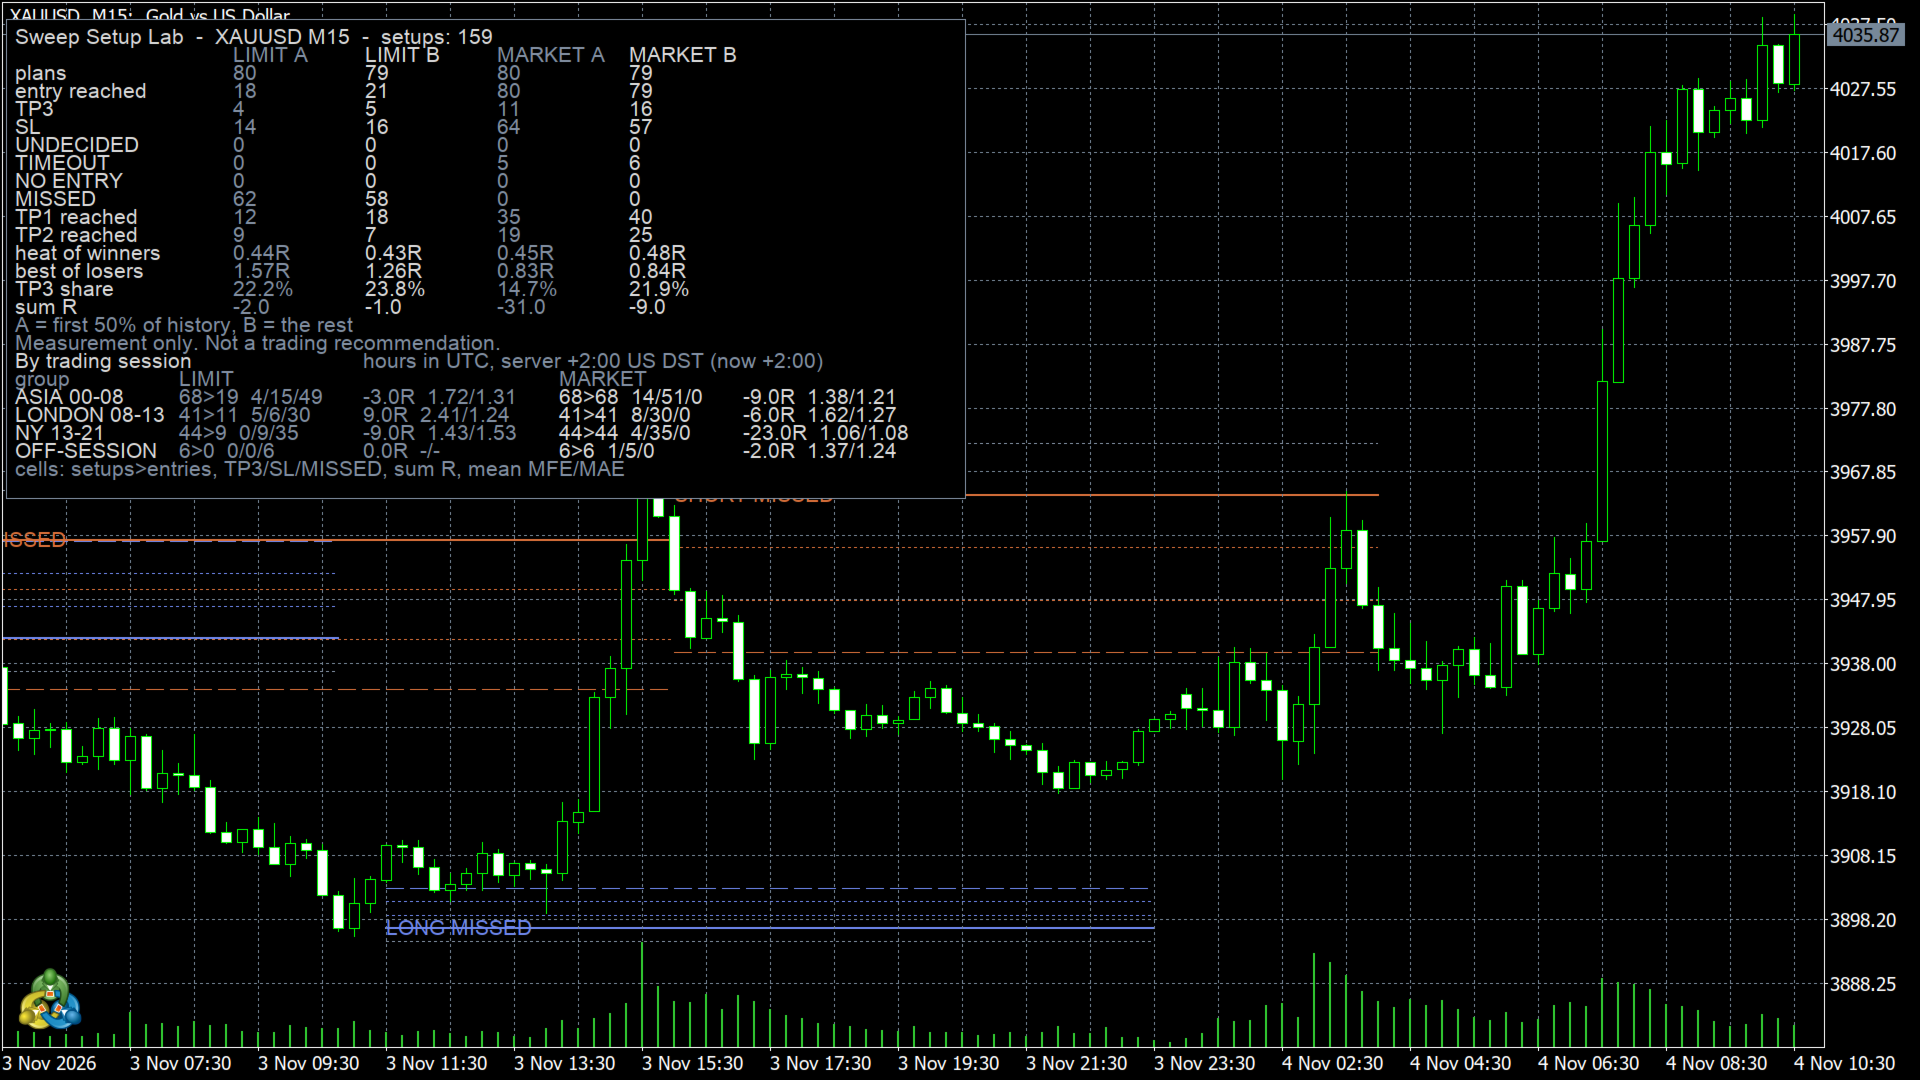
- Out of N setups on this symbol and timeframe: how many reached the entry, how many reached TP3, how many hit the stop, how many ran away without filling.
- Limit order into the zone, or entry at the confirmation close? Both are measured side by side on exactly the same signals.
- How much heat did the winners take before working, and how close did the losers come to the target? Mean MAE of winners and mean MFE of losers, in R.
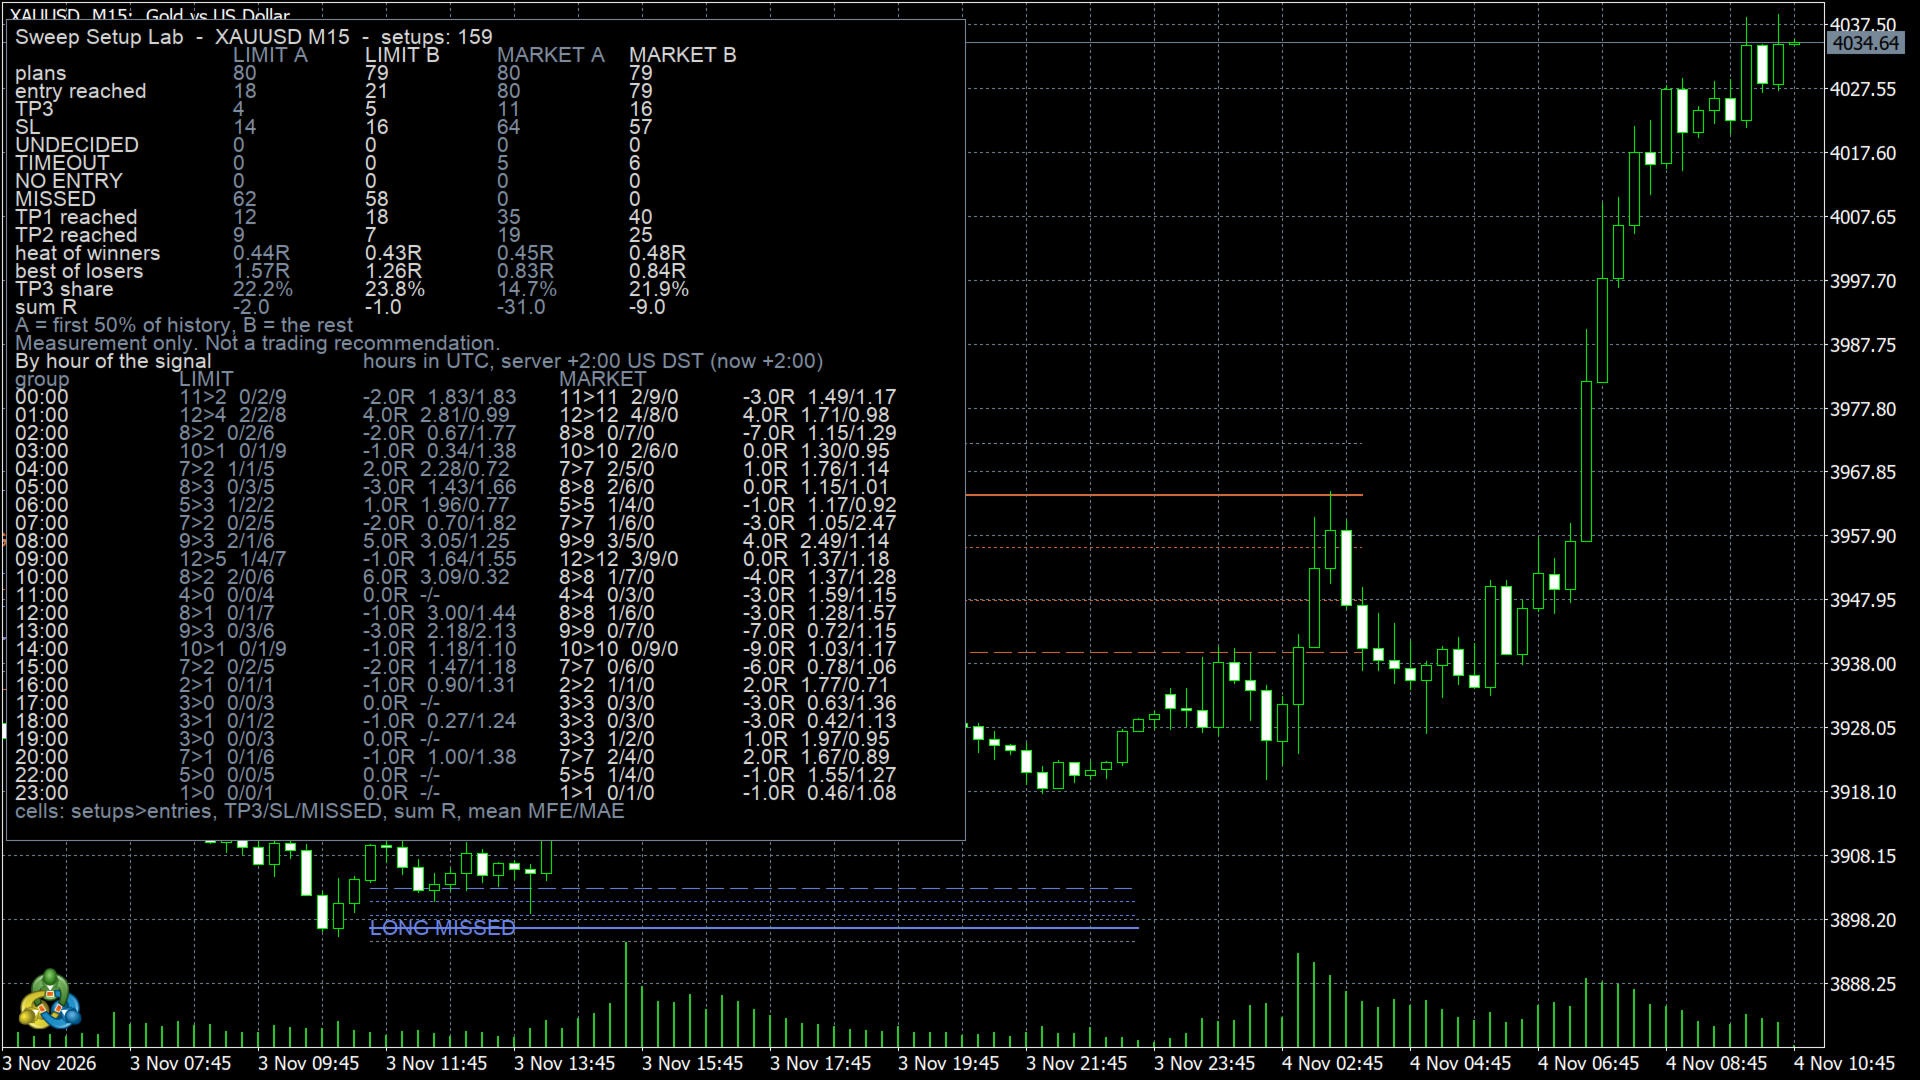
- At which hour of the day, and in which session, did these setups form? Hour and session breakdowns, LIMIT and MARKET side by side.
- How do the two halves of the history compare? The loaded history is split in two, A and B, and every number is reported for both halves separately.
HOW IT MEASURES
- Closed candles only. A plan is advanced only by candles after the confirmation.
- Bid/Ask aware: a long fills at Ask, a short's stop triggers at Ask, targets are priced the way the exit would be priced. Spread is an input.
- When one candle touches both the stop and the target, the order of events inside that candle is unknown. The plan is reported as UNDECIDED and never counted as a win.
- Server time is converted to UTC with an explicit offset and DST rule, so the hour of a setup is stated, not guessed.
HOW sum R IS COUNTED
TP3 and SL are the only outcomes that enter sum R.
A plan that reached TP3 counts as +3R. That figure is the TP3 target input, which is configurable; 3R is its default value, so sum R follows whatever you set the third target to.
A plan that hit the stop counts as -1R.
UNDECIDED, TIMEOUT, NO ENTRY and MISSED do not enter sum R. They are reported as counts in the table and as results in the ledger.
OUTPUT
- A table on the chart: both entry modes against both halves of the history.
- The last N plans drawn on the chart with entry, stop and targets.
- Three CSV files in MQL5/Files/Zen: the full ledger (one row per plan), a summary, and the hour / session breakdown.
WHAT IT DOES NOT DO
- It does not trade and it does not give signals.
- It does not pick "best hours" for you and it does not rank the groups. On samples of this size a difference between groups is not evidence of an edge.
- Splitting the history in two is a comparison of two periods. It is not a guarantee of out-of-sample validity.
- It makes no claim of profitability. It reports what the data shows on the history you point it at.