Keelmark SR Key Zones MT5

Keelmark SR Key Zones - support / resistance zones from reaction-weighted swing density

Keelmark SR Key Zones finds the price areas where the market turned most often and most strongly, then replays the recent closed bars to show how price behaved on each visit to the zone: held (pushed back) or crossed (accepted on the other side). The zone engine uses closed bars of the source timeframe only, so a zone does not change while the source bar is still forming.

HOW A ZONE IS BUILT

  1. Swings: an ATR zigzag on the source timeframe (Auto: the chart timeframe, or M15 on charts below M5). A swing is confirmed when price has moved N x ATR away from it.
  2. Weight: each swing is weighted by its reaction (how far price moved to the next swing, in ATR, capped) and by its age (half-life).
  3. Density: the weighted swings are spread over a price grid with a smooth kernel. Zones are the peaks of this density; a zone's edges are where the density falls to half of its peak, with a minimum and maximum height in ATR.
  4. Visits: every time price comes back to a zone it is a visit. A visit ends HELD when a bar closes back on the side price came from, or CROSSED when N bars close beyond the far edge plus a buffer (a confirmed flip: support becomes resistance or the reverse). Zones crossed too often are dropped.
  5. Score (0-100, relative to the zones on the chart): swing density + held visits + at least one confirmed cross + previous day / week high-low inside the zone + round number inside the zone, lowered for each extra cross. The weights are inputs.

ON THE CHART

  • Zones: red = resistance, green = support, orange = price inside the zone or a flip being tested (closed beyond, not yet confirmed). Darker box = higher score relative to the other zones on the chart.
  • Zone label: R/S + score (0-100) · S swings, H held visits, X confirmed crosses, plus tags: D / W (contains PDH/PDL or PWH/PWL), RN (round number), TEST x/N (closes beyond the far edge, cross not confirmed yet - shown as R? / S?).
  • Right label column: zone, liquidity and day/week labels are aligned in one column at the right edge and spread apart so they never overlap; the area right of the current bar stays free.
  • Market structure from the same zigzag swings: last BOS / CHoCH line and the last swing labels (HH/LH, HL/LL).
  • Liquidity: fresh swing highs (BSL) and lows (SSL) of the chart timeframe until a wick sweeps them; nearby equal levels are shown as EQH/EQL with a count; one level is marked as the target side (by structure, by EMA 1 or nearest).
  • Previous day high/low and previous week high/low lines.
  • Two trend EMAs (default 50 and 200). Colour = EMA slope over N bars measured in ATR: flat, weak or strong, up or down (strong also needs price on the same side of the EMA). The thresholds are inputs. The colour describes the slope that has already happened; it is not a forecast.
  • ADX label at price (ADX value, rising / falling arrow, the leading DI).
  • Optional anchored VWAP (day / week / month) with a deviation band. Off by default.

DASHBOARDS (each with its own position - 9 places, size Tiny to Huge and X / Y offset - or drag a dashboard by its title bar; the dragged position is kept per chart when you change the timeframe, double-click the title to put it back)

  • Zone info: market structure (side, last BOS / CHoCH, swing tags), zones shown / near price / found, history used; engine settings optional.
  • Multi-timeframe context (4 timeframes, pairs or rows): ADX with rising/falling arrow, DI+, DI-, leading side, distance of price from EMA 50 in ATR, last BOS direction; ADR row (today's range as % of the N-day average); session row (Asia / London / New York, daylight saving handled, shown in the GMT offset you choose).
  • Liquidity target: side, target level, nearest BSL / SSL and their distance in ATR. Off by default.

DARK AND LIGHT THEME

Theme: Auto (follows the chart background), Dark or Light. Dashboards are drawn as cards with a header, row stripes and separators. Text and line colours are kept readable on the chart background, so a yellow level stays visible on a white chart. Optional: restyle the chart itself (background, candles, grid off); the original chart colours come back when the indicator is removed.

ONE SETTING SET FOR ALL SYMBOLS

All sizes are measured in ATR of the source timeframe, so the same defaults work on forex, gold, indices and crypto. The round-number step is chosen automatically from the price (or set by hand / switched off).

ALERTS (popup and / or push, on bar close, each type can be switched off)

  • Close beyond the top resistance / support zone
  • Confirmed S/R flip
  • BSL / SSL swept, liquidity target reached
  • Trend EMA slope direction change

NOTES

  • The indicator shows levels and measurements. It does not open trades and gives no buy or sell signals. Zones are built from past price; how price reacts next time is not known in advance.
  • Works on any symbol and timeframe. Needs enough history on the source timeframe (the info panel shows how many bars were available).
  • Box transparency is imitated by blending the zone colour with the chart background colour.
Önerilen ürünler
MFOP Market Forecast
Oscar Josue Pin Bacuzoy
Develop this indicator for periods of 30 minutes or more, focus on getting market trends right and making sure they are met. MFOP v8.1 gets straight to the point: it scans the market and tells you exactly when there is enough strength to enter a trade. This indicator doesn't do magic, it uses mathematical algorithms to filter out market noise, not enter into false breakouts and show you clear BUY (blue arrow) and SELL (red arrow) opportunities. It is designed and optimized specifically to take
Vertex Structure Dashboard delivers a complete multi-timeframe market structure analysis in a single, compact panel. It monitors up to 9   timeframes simultaneously and displays trend bias, structural breaks, momentum, and value zones in real time — no tab-switching, no manual   tracking.   The panel is fully draggable and collapsible. Its position persists across timeframe changes through GlobalVariables, so your layout stays   exactly where you placed it.   How It Works   Each enabled tim
The indicator determines a special pattern of Joe Dinapoli. It gives very high probability buy and sell signals. Indicator does not repaint. Indicator Usage Buy Signal ''B'' Entry : Market buy order at signal bar close Stop : Low of signal bar Take Profit : First swing high Sell Signal ''S'' Entry : Market sell order at signal bar close Stop : High of signal bar Take Profit : First swing low Indicator Parameters Fast EMA : External Parameter (should be kept as default) Slow EMA: External Param
ADR Uyarı Gösterge Tablosu, normal ortalama günlük aralığa göre fiyatın şu anda nerede işlem gördüğünü bir bakışta size gösterir. Fiyat, ortalama aralığı ve seçtiğiniz seviyenin üzerindeki seviyeleri aştığında, açılır pencere, e-posta veya push yoluyla anında uyarılar alacaksınız, böylece hızlı bir şekilde geri çekilmelere ve geri dönüşlere atlayabilirsiniz. Çizgi, boş bir çizelgeye yerleştirilmek üzere tasarlanmıştır ve sadece arka planda oturun ve seviyelere ulaşıldığında sizi uyarır, böylece
Here’s a tight ~300-character text : A trendline break signals a potential shift in market direction. However, entry should only be taken after a confirmation candle. A strong bullish or bearish close beyond the trendline validates the breakout and reduces false signals, improving trade accuracy and confidence.    ShowPatterns ShowBullEngulf ShowBearEnguIf ShowHammer ShowShootingStar ShowMorningStar ShowEveningStar ShowMarubozu
Pattern Tracker PRO Promo: Special offer! Get it now for only $30 ! Pattern Tracker Pro — Advanced Real-Time Candlestick Scanner & Grading System Take your price action trading to the next level with Pattern Tracker Pro , the evolved and professional version of our popular free indicator. If you loved the simplicity of the standard Pattern Tracker , Pattern Tracker Pro unlocks elite-tier capabilities—upgraded with live-candle tracking, enhanced multi-pattern scanning algorithms, and precise sign
Orderflow Super Candles - Simple Footprint Chart Indicator Platform: MetaTrader 5 (MT5)  (The last screenshot shows the use of the DOM tool in conjunction with the product.) 1. Product Introduction Orderflow Super Candles is a professional charting tool based on underlying Tick data analysis, designed to provide traders with a deep "X-ray" view of the market. By parsing the buy and sell volume distribution within each candlestick, this indicator visualizes the hidden market microstructure. It
QM Candle Timing Meter is a free MetaTrader 5 indicator designed to answer one simple question: How late am I in the current candle? A trading signal may still be technically valid while the timing of the entry has already changed significantly. For example, entering during the first minutes of an H1 candle is very different from entering when 90% of that candle has already elapsed. QM Candle Timing Meter continuously measures the temporal position of the current candle and displays this informa
FREE
BS Time Band是一个很好的波段交易指示器,这个指标可以单独使用,但是最好是配合 StartPoint 一起使用效果更好,适用于任何时间框架,非常适合喜欢做波段交易的朋友。它能很好的体现出一个波段的完整信息,你可以很快的从这个指示器上寻找到最佳的预警区域,然后配合 StartPoint 找到最佳的buy位置和最佳的sell位置,也能很好根据指示器去坚守自己的持仓定订单。指标不含有未来函数,不会重新绘制,不仅能够应用到自己的手动交易过程中,还能完全可以写入到自己的EA中。(如果你感觉到这个指标能够帮助你进行更准确的交易,请帮忙给个好评,希望我的作品能够帮助更多有需要的人) =================参考使用方法=================== 此指标可以适用于任何交易品种。 做波段建议参数 timeFame:M5 如果配合 StartPoint 建议 StartPoint 的参数为(240,60)
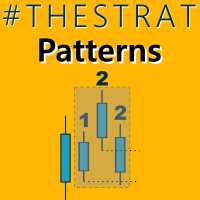
This indicator will draw patterns based on   Rob Smith's   The Strat   as they emerge in real time on your chart. As price evolves,   TheStrat   offers 18 distinct price action patterns that can help you get good entries in the market. Each pattern involves two or three candles, and this indicator will draw a bounding box around the candles and name the pattern. The indicator also shows when a potential setup is forming, known by stratters as an Actionable signal. Candles Each candle is defin
Deviation trend
VLADISLAV AKINDINOV
Indicator of trend deviation with a static level. The deviation coefficient is set for the trend histogram. Signals are the intersection of the level trend histogram in the direction of the trend or during a trend reversal - the option is selected in the indicator settings by the "Revers" parameter. There are all the necessary settings for the design of the indication and sending messages to mail or a mobile terminal. All input parameters have an intuitive name. Analog for MT4: https://www.mql5.
Introduction to Fractal Pattern Scanner Fractal Indicator refers to the technical indicator that makes use of the fractal geometry found in the financial market. Fractal Pattern Scanner is the advanced Fractal Indicator that brings the latest trading technology after the extensive research and development work in the fractal geometry in the financial market. The most important feature in Fractal Pattern Scanner is the ability to measure the turning point probability as well as the trend probabil
Product: Pro RSI Signal Overbought Oversold Multi Filters MT5 Category: Technical Indicator / Oscillators & Momentum Platform: MetaTrader 5 Overview Pro RSI Signal Overbought Oversold Multi Filters is a technical momentum analysis indicator developed natively for the MetaTrader 5 platform. The tool reproduces and expands upon the standard TradingView Relative Strength Index architecture, providing an authentic analytical bridge between modern charting environments and the MetaTrader trading te
MT5 için Crypto_Forex Göstergesi "Ters Çekiç Formasyonu", Yeniden Çizme Yok, Gecikme Yok. - "Ters Çekiç Formasyonu" göstergesi, Fiyat Hareketi işlemleri için çok güçlü bir göstergedir. - Gösterge, grafikte yükseliş yönlü Ters Çekiç formasyonu tespit eder: Grafikte mavi ok sinyali (resimlere bakın). - PC, Mobile alerts. - "Ters Çekiç Formasyonu" göstergesi, Destek/Direnç Seviyeleriyle birleştirmek için mükemmeldir. Yüksek kaliteli Trading Robotları ve Göstergelerini görmek için buraya tıklayın
Extremum levels
VLADISLAV AKINDINOV
Bu gösterge bir önceki günün, haftanın ve ayın maksimum ve minimum fiyatlarını gösterir. Aşırı noktaların kırılmalarını tespit etmek ve bir ticarete giriş yönünü belirlemek için tasarlanmıştır. Geri dönüş seviyelerini daha doğru belirlemek için Fibonacci seviyelerini görüntüleyebilirsiniz. Önceki fatura dönemindeki fiyat hareketini daha net göstermek için yüksek ve düşük fiyatlar arasındaki alanda da çizilebilir. Mevcut mumun (çubuğun) kapanmasına kadar geçen süreyi gösterir. Sürüm 2.0, 3 yeni
StretchTurnLevels
Kaustubh Pradeep Deshmukh
Stretch Turn Levels marks turning points on the chart. Instead of arrows, it draws the level that matters for each turn and tints the candles while that turn is still in play. There are no buy or sell calls: it shows the situation, and you decide what to do with it. What you see on the chart Turn level - a line at the extreme of each turn: under an up turn, above a down turn. It runs to the right until a candle closes beyond it, so you can see at a glance whether the turn is still holding. Tinte
Xtrade Trend Detector
Dago Elkana Samuel Dadie
Xtrade Trend Detector is an indicator capable of finding the best opportunities to take a position in any stock market. Indeed, it is a great tool for scalpers but also for Daytraders. You could therefore use it to identify areas to trade, it fits easily on a chart. I use it to detect trends on Big timeframes and take positions on Small timeframes. Don't hesitate to give me a feedback if you test it.
TrendMorph — giriş oklu uyarlanabilir trend göstergesi Nedir TrendMorph, trend yönünü renkli bir çizgiyle gösterir, dönüş noktalarını Buy/Sell okları ile işaretler ve her sinyal için bir güven puanı ile Stop/Target seviyeleri sunar. Gösterge, çizgisinin hassasiyetini piyasanın mevcut durumuna göre otomatik olarak ayarlayabilir; bu sayede aynı ayarlar hem sakin hem de oynak piyasalarda çalışır. Grafikte bir bilgi paneli görüntülenir ve tüm önemli değerler Expert Advisor'lar için tamponlarda (buf
FREE
SR Zones Sync: Support & Resistance Zones with Break-on-Close Logic SR Zones Sync automatically draws support and resistance zones from swing pivots, then recolours them when price actually breaks through. Only a fully closed candle can break a zone, so wicks and the still-forming candle never trigger a false signal. How it works Zones are built by clustering swing highs and lows into price areas. Each zone’s thickness adapts to the average candle range. Each zone gets a role from its latest pi
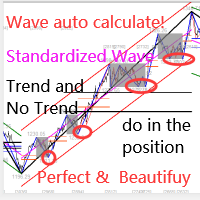
Bu gösterge, pratik ticaret için mükemmel olan otomatik dalga analizine yönelik bir göstergedir! Dava... Not:   Dalga sınıflandırması için Batılı isimleri kullanmaya alışkın değilim. Tang Lun'un (Tang Zhong Shuo Zen) adlandırma kuralının etkisiyle, temel dalgayı   kalem   , ikincil dalga bandını ise   segment   olarak adlandırdım. aynı zamanda segmentin trend yönü vardır. Adlandırma   esas olarak trend segmentidir   (bu adlandırma yöntemi gelecekteki notlarda kullanılacaktır, öncelikle söyleyey
Fibrillar
Vitalii Zakharuk
It is very easy to use the Fibrillar indicator, since the simplest is to look at the chart and act according to the indications of the colored arrows. The algorithm takes into account the measurement of prices, and this method also focuses on measuring each of the price drops (H / C, H / O, LC, LO) - which gives more detailed information, but also more averaged. When calculating this indicator, logarithmic gains are first calculated at the closing price, which allows you to filter out the tren
First Dawn MT5
Innovicient Limited
The First Dawn indicator uses a unique mechanism to search and plot signals. This keeps searching for signals, making it a great indicator for scaping and identification of changes in direction, swing trading and trend trading. The    First Dawn     helps you get early signals. The backtest gives the true picture of how the indicator works with real/demo accounts. Although this is a tiny indicator it is packed with advantageous settings that will help you whether you desire to: Snap the Peaks a
【Super Scanner】Indicator Introduction : The color of the Super Scanner which is green and climbing up means that the price trend is going up.The color of the Super Scanner is red and going down means that the price trend is going down. It is very simple to use it to judge the market trend! What's even better is that the open parameters of the indicators allow investors to adjust. You can adjust【Super Scanner】according to your needs. Adjust it faster to be closer to short-term market fluctuatio
The indicator scans for Dinapoli thrust pattern in multiple timeframes for the all markets filtered and shows the results on Dashboard. Key Features Dashboard can be used for all markets It can scan for thrust pattern on MN1, W1, D1, H4, H1, M30, M15 ,M5, M1 timeframes Ability to choose number of bars required above/below displaced moving average to define thrust Parameters UseMarketWatch: Set true to copy all symbols available in market watch MarketWatchCount : Set the number of symbols that
Multi Indi Signal Mhw
Muhammad Amir Azri Bin Samani
Multi Indi Signal Mhw is a multi-timeframe analysis and signal indicator for MetaTrader 5. It combines Support Becomes Resistance Zones (SR Flip), Fibonacci, BBMA and a Confirmation Zone Meter into one tool. Instead of reading each tool separately on several charts, the indicator analyses them together across timeframes and gives a BUY or SELL signal only when they agree. SR Flip zones is used to identify entry zones with the potential to become strong entry points with less floating loss . Fibo
Gf Breakout
Kayode George Absi
A ZigZag indicator for MetaTrader 5 that finds swing highs and lows, spots W-bottom and M-top patterns, and gives a BUY or SELL signal when the second leg of a pattern forms at an H1 swing point and price breaks the trendline. 1. Key advantages See the structure at a glance. Clear red ZigZag lines join the major swings, with a down arrow on every swing high and an up arrow on every swing low. Trade with the higher timeframe. On M1, M5 or M15, a signal only appears when the second leg sits on an
DoubleBB MARSI — All-in-One Chart Tool Optimized for Day Trading Your price position · Market sentiment · Entry signals — all on one screen In One Line DoubleBB MARSI integrates the three essentials of day trading — daily reference levels · RSI sentiment · Double Bollinger Band signals — into a single chart, helping traders make faster and more confident decisions. Three Benefits You Get DoubleBB MARSI is more than a basic indicator — it gives you everything you need across the entire da
The indicator monitors the Dinapoli MACD trend in multiple timeframes for the all markets filtered and shows the results on Dashboard. Key Features Indicator can be used for all markets Monitors every timeframe, from 1 Min to Monthly Parameters UseMarketWatch: Set true to copy all symbols available in market watch MarketWatchCount : Set the number of symbols that you want to copy from the market watch list. CustomSymbols: Enter the custom symbols that you want to be available in dashboard. Ti
An “inside bar” pattern is a two-bar price action trading strategy in which the inside bar is smaller and within the high to low range of the prior bar, i.e. the high is lower than the previous bar’s high, and the low is higher than the previous bar’s low. Its relative position can be at the top, the middle or the bottom of the prior bar. The prior bar, the bar before the inside bar, is often referred to as the “mother bar”. You will sometimes see an inside bar referred to as an “ib” and its m
FREE
Bu ürünün alıcıları ayrıca şunları da satın alıyor
Trend Sniper X
Sarvarbek Abduvoxobov
4.86 (43)
Trend Sniper X , tüccarların trend yönünü ve olası dönüş noktalarını netlik ve hassasiyetle belirlemelerine yardımcı olan MetaTrader 5 için çoklu zaman dilimli bir trend takip göstergesidir. MT4 için: https://www.mql5.com/en/market/product/193245 Fiyat Bilgisi: Mevcut fiyat tanıtım amaçlıdır ve gelecek güncellemeler ile yeni özellikler yayınlandıkça değişebilir. Bonus Fırsatı: Bu indikatör için ÜCRETSİZ Oto-Trade Assistant EA'yı almak için lütfen satın aldıktan sonra yazara mesaj gönderin. Code
Smart Trend Trading System — MetaTrader 5 Satın aldıktan sonra Smart Universal Expert Advisor'ı ÜCRETSİZ edinmek ve beraberinde çevrimiçi kurs, PDF kılavuzu ve özel gruba erişim almak için MQL5 üzerinden bana mesaj gönderin. STTS; trend yönünü, giriş ve çıkış sinyallerini, dönüş bölgelerini ve önemli fiyat seviyelerini doğrudan grafiğinizde bir araya getirir. Sistemi manuel işlemler için kullanabilir veya ayrı bir uyumlu EA’yı bağlayarak seçtiğiniz ayarlarla otomatik işlem gerçekleştirebilirsini
Şehre yeni bir Kral geldi - Gösterge + Emir Yönetimi göstergeleri (TP1 + TP2 + TP3) + Opsiyonel Telegram Sinyal Gönderici DAHİL (ÜCRETSİZ) (TAM TRADING ve SİNYAL SİSTEMİ) Altın için en iyi EA’mız: Gold Slayer Bu gösterge; gelişmiş bir strateji, özelleştirilebilir emir yönetimine sahip bir trading sistemi ve envelope uzantılarını birleştiren bir mean reversion sistemi içerir. Ayrıca RSI gibi birçok akıllı onay filtresiyle desteklenerek yüksek olasılıklı dönüş girişlerini AL ve SAT sinyalleriyle y
İşlem avantajınızı görüş alanınıza alın! M5 Sniper , MeanFX tarafından geliştirilen yeni bir indikatördür. Hassas işlem sinyallerini adaptif TP/SL seviyeleriyle birleştirir — bunun sonucunda mümkün olan en iyi istatistiksel işlemleri oluşturur! Fiyat her 5 satın alımda bir artar, bir sonraki fiyat 69$ olacaktır. Satın aldıktan sonra ipuçları/rehber ve bonus EA almak için bana mesaj gönderin. Onu öne çıkaran nedir? Kanıtlanmış istatistiksel performans Gold XAUUSD üzerinde ( neredeyse her varlıkta
Ultra Indicator
Ihor Otkydach
5 (1)
ULTRA, “hepsi bir arada” prensibiyle çalışan bir teknik göstergedir; piyasayı bağımsız olarak analiz eder, işlem sinyalleri üretir, stop-loss emirlerinin verileceği seviyeleri gösterir ve kârı garantilemek ya da zararı en aza indirmek için işlemlerin ne zaman kapatılması gerektiğini önerir. Başka bir deyişle, piyasayı nasıl analiz edeceğinizi bilmeseniz, seviyeleri (stop-loss'unuzu nereye koyacağınızı) belirleyemeseniz ya da para yönetimi konusunda zorluk yaşasanız da fark etmez. ULTRA tüm bunla
2019'da bu indikatörün neler yapabildiğini tüm dünyaya gösterdim. Sinyallerine göre elle, gerçek hesapta ve herkesin gözü önünde işlem yaptım — hesap Myfxbook'ta izleniyordu ve bu deneyi Facebook'ta ayrıntılı olarak paylaştım. Sonuç: 10.000 dolar dört ayda 941.411 dolara dönüştü. Risk bilinçli olarak aşırıydı — drawdown %54'e kadar çıktı, çünkü mesleğimizde kâr ve risk her zaman el ele gider. Myfxbook ekran görüntüsü galerideki ilk resimdir. Görünen o ki sizi tebrik edebilirim: arayışınız sona e
SuperScalp Pro
Van Minh Nguyen
4.54 (37)
SuperScalp Pro - Professional Multi-Layer Confluence Scalping System SuperScalp Pro, klasik Supertrend sistemini birden fazla akıllı doğrulama filtresiyle geliştiren ileri düzey bir scalping göstergesidir. Yanlış sinyalleri önemli ölçüde azaltırken başarı olasılığı daha yüksek Buy/Sell işlem fırsatlarını belirlemenize yardımcı olur. Buy ve Sell okları doğrudan grafik üzerinde net bir şekilde görüntülenir. ATR tabanlı Stop Loss ve Take Profit seviyeleri de gerçek zamanlı olarak otomatik hesaplanı
Gann Made Easy , bay teorisini kullanarak ticaretin en iyi ilkelerine dayanan, profesyonel ve kullanımı kolay bir Forex ticaret sistemidir. WD Gann. Gösterge, Zararı Durdur ve Kâr Al Seviyeleri dahil olmak üzere doğru SATIN AL ve SAT sinyalleri sağlar. PUSH bildirimlerini kullanarak hareket halindeyken bile işlem yapabilirsiniz. Satın alma işleminden sonra, alım satım talimatlarını ve harika ek göstergeleri ücretsiz olarak almak için lütfen benimle iletişime geçin! Muhtemelen Gann ticaret yöntem
SMC Intraday Formula
VividMind Digital Solutions
5 (26)
Önce dürüst olalım. Hiçbir gösterge tek başına sizi kârlı yapmaz. Eğer biri size aksini söylüyorsa, size bir hayal satıyordur. Mükemmel al/sat okları gösteren her gösterge, kusursuzmuş gibi görünecek şekilde yapılabilir — sadece geçmişin doğru bir bölümünü yakınlaştırıp kazanan işlemleri ekran görüntüsü almanız yeterlidir. Biz bunu yapmıyoruz.  SMC Intraday Formula bir araçtır. Piyasa yapısını sizin için okur, en yüksek olasılıklı fiyat bölgelerini belirler ve şu anda akıllı paranın izinin nası
M1 Sniper MT5
Oleg Rodin
5 (7)
M1 SNIPER   kullanımı kolay bir işlem göstergesi sistemidir. M1 zaman dilimi için tasarlanmış bir ok göstergesidir. Gösterge, M1 zaman diliminde scalping için bağımsız bir sistem olarak kullanılabilir ve mevcut işlem sisteminizin bir parçası olarak kullanılabilir. Bu işlem sistemi özellikle M1'de işlem yapmak için tasarlanmış olsa da, diğer zaman dilimleriyle de kullanılabilir. Başlangıçta bu yöntemi XAUUSD ve BTCUSD ticareti için tasarladım. Ancak bu yöntemi diğer piyasalarda işlem yaparken de
Sonraki Güncelleme — Sürüm 2.52 Çok Yakında! [YENİ] Piyasa Analizinizi ve İşlem Sürecinizi Geliştirmek İçin Tasarlanmış 4 Büyük Yeni Özelliğe Hazır Olun İşlem ihtiyaçlarınızı karşılamak üzere tasarlanmış 4 yeni özellikle piyasa analizini bir üst seviyeye taşıyoruz. İşte yeni özellikler: 1. TRADE OVERVIEW DASHBOARD 2. CONFLUENCE AT ZONE 3. STRONG & WEAK HIGH/LOW 4. OTE 1. TRADE OVERVIEW DASHBOARD Piyasanın genel görünümünü daha kolay anlamanıza yardımcı olan, işlem kararlarınızı desteklemek için
Atomic Analyst MT5
Issam Kassas
4.5 (64)
Atomic Analyst — MetaTrader 5 Satın aldıktan sonra Smart Universal Expert Advisor'ı ÜCRETSİZ edinmek ve beraberinde çevrimiçi kurs, PDF kılavuzu ve özel gruba erişim almak için MQL5 üzerinden bana mesaj gönderin. Atomic Analyst; fiyat hareketini, trend yönünü, giriş ve çıkış sinyallerini, Stop Loss ve birden fazla Take Profit seviyesini doğrudan grafiğinizde bir araya getirir. SİNYALİ GÖRÜN. İŞLEM KOŞULLARINI ANLAYIN. Atomic Analyst, analizini anlaşılır görsel bilgiler halinde sunar: • Olası gir
Boba Analysis Suite
Trade Ready Solutions LLC
5 (2)
Boba Analysis Suite Boba Analysis Suite, MetaTrader 5 için geliştirilmiş bir analiz göstergesidir. Piyasa yapısını, önemli fiyat bölgelerini ve genel piyasa bağlamını tek bir grafik görünümünde bir araya getirir. Trader ve trading eğitmeni olarak edinilen uygulamalı deneyimden yola çıkarak geliştirilmiştir. Piyasanın yönünü değerlendirme, önemli seviyeleri belirleme ve birden fazla zaman dilimini birlikte inceleme gibi adımlardan oluşan sistematik bir analiz sürecini destekler. Piyasa Bağlamını
Adaptive Price Action Engine Göstergeyi al, EA'sı (Uzman Danışman) bedava gelsin Kendi Kendini Optimize Eden Multi-Timeframe Trend ve Mum Formasyonu Analizi Piyasalar sürekli değişir ve her Price Action formasyonu her piyasa koşulunda aynı değere sahip değildir. Adaptive Price Action Engine , değişen piyasa koşullarına uyum sağlamak amacıyla trend yapısını, Multi-Timeframe analizini, mum formasyonlarını ve istatistiksel optimizasyonu tek bir analiz sistemi içerisinde birleştirir. İki Adaptif Mod
Azimuth Pro
Ottaviano De Cicco
5 (7)
Azimuth Pro V2: Synthetic Fractal Structure and Confirmed Entries for MT5 Overview Azimuth Pro is a multi-level swing structure indicator by Merkava Labs . Four nested swing layers, swing-anchored VWAP, ABC pattern detection, three-timeframe structural filtering, and closed-bar confirmed entries — one chart, one workflow from micro-swings to macro-cycles. This is not a blind signal product. It is a structure-first workflow for traders who care about location, context, and timing. Halloween P
Auto Optimized SpeedAngle , sürekli İleriye Dönük Optimizasyon (Walk-Forward Optimization, WFO) yoluyla eğri uydurmayı (curve-fitting) ortadan kaldıran kurumsal düzeyde bir momentum vektörleme sistemidir. Piyasa rejimleri değiştiğinde etkinliğini yitiren statik girdilere güvenmek yerine, gösterge, örneklem dışı (Out-of-Sample, OOS) doğrulama kullanarak parametrelerini dinamik olarak yeniden kalibre eder ve böylece gösterilen sinyallerin geçmişteki rastgele anomalileri değil, gerçek bir istatisti
Zain Gold Scalping
Ahmed Gamal Abdel Nasser Mohamed
A complete price-action analysis tool built around dual independent entry logic, each confirmed against a volatility band, combined with a configurable set of nine optional confirmation filters that let you shape exactly how conservative or aggressive the tool's signals behave. Core Strategy Two independent entry setups, each triggering only when price moves outside a dynamic volatility band — giving two distinct ways to spot potential reversal points, which can be used together or separately.
Tokyo mt5 Indicator
Vasiliy Strukov
5 (14)
Tokyo Indicator; trend yönü, potansiyel işlem sinyalleri ve piyasa koşulları hakkında net ve görsel bir genel bakış sunar. Renk kodlu ve kademeli trend çizgisi, yükseliş evrelerini (mavi) düşüş evrelerinden (macenta) ayırt eder. Trend değiştiğinde, buna karşılık gelen yön okları potansiyel alım ve satım fırsatlarını vurgular. Entegre bir panel; mevcut sinyali, piyasa eğilimini, momentumu, volatiliteyi ve sinyal kalitesini tek bir kullanışlı görünümde bir araya getirir. Bu sayede yatırımcılar, fa
FiboSniper Pro
Van Minh Nguyen
5 (4)
FiboSniper Pro – Multi-Filter Fibonacci System with Auto SL/TP and Control Panel FiboSniper Pro, seçilmiş Buy ve Sell sinyalleri üretmek için dinamik Fibonacci Envelopes ile birden fazla doğrulama filtresini birleştiren teknik bir göstergedir. Fibonacci seviyeleri Moving Average ve ATR temel alınarak hesaplanır ve ardından ADX, EMA, RSI, ATR, Volume, Time ve Candle yapısı ile filtrelenir. Gösterge, ATR tabanlı otomatik Stop Loss ve Take Profit seviyelerini doğrudan grafik üzerinde görüntüler ve
Quantum TrendPulse
Bogdan Ion Puscasu
5 (26)
SuperTrend   ,   RSI   ve   Stochastic'in   gücünü tek bir kapsamlı göstergede birleştirerek işlem potansiyelinizi en üst düzeye çıkaran nihai işlem aracı olan   Quantum TrendPulse'u   tanıtıyoruz. Hassasiyet ve verimlilik arayan yatırımcılar için tasarlanan bu gösterge, piyasa trendlerini, momentum değişimlerini ve en uygun giriş ve çıkış noktalarını güvenle belirlemenize yardımcı olur. Temel Özellikler: SuperTrend Entegrasyonu:   Güncel piyasa trendlerini kolayca takip edin ve karlılık dalgası
Superhero
Ihor Otkydach
5 (3)
SUPERHERO göstergesi, "her şeyi kapsayan" bir temele dayalı olarak tasarlanmış çoklu para birimli bir işlem sistemidir. Gösterge, piyasayı bağımsız olarak analiz eder ve işlemlerin ne zaman açılıp kapatılacağına dair sinyaller verir. Stop Loss ve Take Profit emirlerini kullanır. R:R oranı 1:1'dir. Bu sistem akıllı telefonunuza anlık bildirimler gönderebilir; böylece bir bilgisayara bağlı kalmanıza gerek kalmadan "hareket halindeyken" işlem yapabilirsiniz. Bu, özel ticaret şirketleri için idealdi
Çoklu Para Birimi Güç ve Momentum Göstergesi MT5 Dynamic Forex28 Navigator, uzun süredir popüler olan göstergelerimizin gelişmiş halidir ve üç aracın gücünü tek bir araçta birleştirir: Advanced Currency Strength28 Indicator (700 değerlendirme) Advanced Currency IMPULSE with ALERT (530 değerlendirme) CS28 Combo Signals (güncel bonus) İki önceki gösterge MQL5 Market'te birlikte 1.200'den fazla değerlendirme aldı ve 2016'dan bu yana MT4 topluluğunun vazgeçilmez araçlarından biri. Dynamic Forex28 Na
Trend Catcher ind mt5
Ramil Minniakhmetov
5 (18)
TREND YAKALAYICI GÖSTERGE Trend Yakalayıcı Gösterge, yazarın tescilli ve özelleştirilmiş uyarlanabilir trend analiz göstergelerinin bir kombinasyonunu kullanarak piyasa fiyat hareketlerini analiz eder. Kısa vadeli gürültüyü filtreleyerek ve temel momentum gücüne, volatilite genişlemesine ve fiyat yapısı davranışına odaklanarak gerçek piyasa yönünü belirler. Ayrıca, hareketli ortalamalar, RSI ve volatilite filtreleri gibi yumuşatma ve trend filtreleme özelleştirilmiş göstergelerinin bir kombina
Apex Patterns PRO İndikatörü Satın Alın - Üzerine Kurulu Expert Advisor'a ÜCRETSİZ Sahip Olun. Kendini Optimize Eden Grafik Formasyonu ve Kırılım Zekası Geleneksel formasyon tarayıcıları sabit girdilere dayanır ve piyasa volatilitesi ile yapıları değiştiğinde genellikle düşük performans gösterir. Apex Patterns PRO, yapısal grafik formasyon tanımayı, momentum filtrelemeyi ve istatistiksel kendi kendini optimizasyonu tek bir analitik çerçevede birleştirerek değişen piyasa koşullarına uyum sağlama
Neuro Poseidon MT5
Daria Rezueva
4.75 (52)
Neuro Poseidon is a new indicator by Daria Rezueva. It combines precise trading signals with adaptive TP/SL levels - creating best possible trades as a result! Message me and get  Neuro Poseidon Assistant  as a gift to automize your trading process! What makes it stand out? 1. Proven profitability on all assets and timeframes 2. Only confirmed BUY and SELL signals present on the chart 3. Adaptive TP & SL levels generated by the software for each trade 4. Easy to understand - suitable for al
Crystal Heikin Ashi Signals
Muhammad Jawad Shabir
5 (5)
Crystal Heikin Ashi Signals—Professional Trend & Signal Detection Indicator Advanced Heikin Ashi Visualization with Intelligent Signal System for Manual & Automated Trading Final Price: $149 ---------> Price goes up $10 after every 10 sales . Limited slots available — act fast . Overview User Guide PDF Crystal Heikin Ashi Signals is a professional-grade MetaTrader 5 indicator that combines pure Heikin Ashi candle visualization with an advanced momentum-shift detection system. Designed for both m
Break and Retest Hunter is a powerful MetaTrader 5 indicator designed to automatically identify support and resistance levels, breakout structures, and potential retest opportunities in real time. Bonus Indicator: After purchasing Break and Retest Hunter , contact me to receive Trade Indicator Assistant EA completely free as a bonus utility. $65 for the next 10 copies . Next price is $120.  Combining adaptive market analysis, clear BUY/SELL signals, Fibonacci-based profit targets, and a premiu
Power Candles MT5
Daniel Stein
4.58 (12)
Power Candles V3 - Kendi Kendini Optimize Eden Güç Göstergesi Power Candles V3, döviz ve enstrüman gücünü, eklendiği her grafikte eyleme geçirilebilir bir ticaret planına dönüştürür. Sadece mumları renklendirmek yerine, arka planda canlı bir otomatik optimizasyon çalıştırır ve önünüzdeki sembol için en iyi Stop Loss, Take Profit ve sinyal eşiğini size sunar. Tek bir tıklama ile canlı ticarete uyarlanır - giriş, Stop Loss ve Take Profit ışınları grafikte tam fiyatlarla görünür ve uyarılar yön bil
Unix Scalper
Issam Kassas
4 (4)
Unix Scalper — MetaTrader 5 Satın aldıktan sonra Smart Universal Expert Advisor'ı ÜCRETSİZ edinmek ve beraberinde çevrimiçi kurs, PDF kılavuzu ve özel gruba erişim almak için MQL5 üzerinden bana mesaj gönderin. İşlem fırsatını belirleyin. Planı görün. Nasıl işlem yapacağınıza karar verin. UNIX Scalper; piyasa analizini, BUY/SELL/WAIT kararlarını ve Entry, Stop Loss, TP1 ve TP2 seviyelerini düzenli bir panelde bir araya getirir. SİNYALİ VE PLANI GÖRÜN • Net kararlar: BUY, SELL veya WAIT. • Belir
Smart Harmonic Patterns - MetaTrader 5 Satın aldıktan sonra Smart Universal Expert Advisor'ı ÜCRETSİZ edinmek ve beraberinde çevrimiçi kurs, PDF kılavuzu ve özel gruba erişim almak için MQL5 üzerinden bana mesaj gönderin. Harmonik fiyat yapılarını doğrudan MetaTrader 5 grafiğinizde inceleyin. Smart Harmonic Patterns, 88 varyantlı bir katalog, ATR tabanlı ZigZag algılayıcı ve görmek istediğiniz formasyonlarla çizimleri seçebileceğiniz bir grafik panelini birleştirir. Görsel analiz ve kendi karar
Yazarın diğer ürünleri
Keelmark All-In Challenge - FREE. An "all-in" compounding gold robot, so you can see how this style really behaves. Can $10 become $100,000 if a robot puts the whole account into every trade and compounds the wins? This EA does exactly that, so you can run it on a demo and watch the result for yourself. It is an experiment, not an income tool. WHAT IT DOES One basket at a time: several equal market positions in the same direction (default 7). Total lots = capital x Lots per $1. Every win makes t
FREE
Vtrade Challenge Dashboard shows how much room is left before your prop firm's daily loss limit and maximum loss limit, counted the way the firm counts it: floating profit and loss included, from the firm's own daily reset time. One copy on one chart covers the whole account: every symbol, every Expert Advisor and every manual trade. What it shows Status: protecting, warning, or limit reached. Today's profit or loss and the time left until the firm's daily reset (Prague midnight, UTC, server mid
FREE
VDivergence Pro - Price / OsMA Divergence on Confirmed Swings VDivergence Pro finds Regular and Hidden divergence between price and OsMA (MACD minus Signal) on swings from an ATR-based ZigZag. It works on closed bars only, and every signal is placed on the bar where it actually became known. What you see on history is what you would have seen live. HOW A SIGNAL IS BUILT Swing: the ZigZag locks a swing high/low only after price has reversed by N x ATR (default 2.5) on a closed bar. Divergence: th
VDelta Profile Pro Volume Profile + Order-Flow Context for XAUUSD, US100 (NAS100) and US500 (SP500) VDelta Profile Pro builds a live volume profile directly on your chart, showing where the market actually traded — the Point of Control (POC), Value Area (VAH/VAL), and High Volume Nodes (HVN). These structural levels act as natural support and resistance zones that price tends to respect, react to, and return to. The core of this tool is volume-at-price : it measures how much activity occurred at
Gold Reversal
Quang Vinh Huynh
Gold Reversal is an automated Stop & Reverse trade management tool for XAUUSD, controlled with a single ON / OFF button. It does not predict the market: you decide when to switch it on, and the bot handles the entry, the reverse order at the Stop Loss, the profit lock and the risk limits for you. The idea is simple: the bot always holds one position, and an opposite Stop order is already sitting exactly at that position's Stop Loss. When the market turns and hits your SL, the old position closes
Gold Reversal Multi Entry is an automated Stop & Reverse trade management tool for XAUUSD with multi-entry along the trend, controlled with a single ON / OFF button. It does not predict the market: you decide when to switch it on, and the bot handles the entries, the reverse order at the Stop Loss, the profit lock on every entry and the risk limits for you. The bot holds a position with a fixed Stop Loss, and an opposite Stop order is already sitting exactly at that Stop Loss. When the market tu
Vtrade Challenge Lock watches the whole account and acts before the prop firm's loss limit is reached: it closes all positions, deletes pending orders and locks trading. The limits are counted the way the firms count them: floating profit and loss included, from the firm's own daily reset time. One copy on one chart covers the whole account: every symbol, every Expert Advisor and every manual trade. Daily loss lock At your safety level (default 80% of the firm's daily limit) it closes all positi
Keelmark Wave Gauge - where the current wave stands, and what waves on your chart did next Keelmark Wave Gauge follows the current price wave and shows it in plain words: which way it goes, how far it has travelled, how long it has been running, how much it has given back, and how straight the last bars pushed with it. A second table counts on the history of your own chart how often price went on with the wave by a fixed distance before turning against it by the same distance. The indicator desc
Filtrele:
Değerlendirme yok
Değerlendirmeye yanıt