Omni Predictor

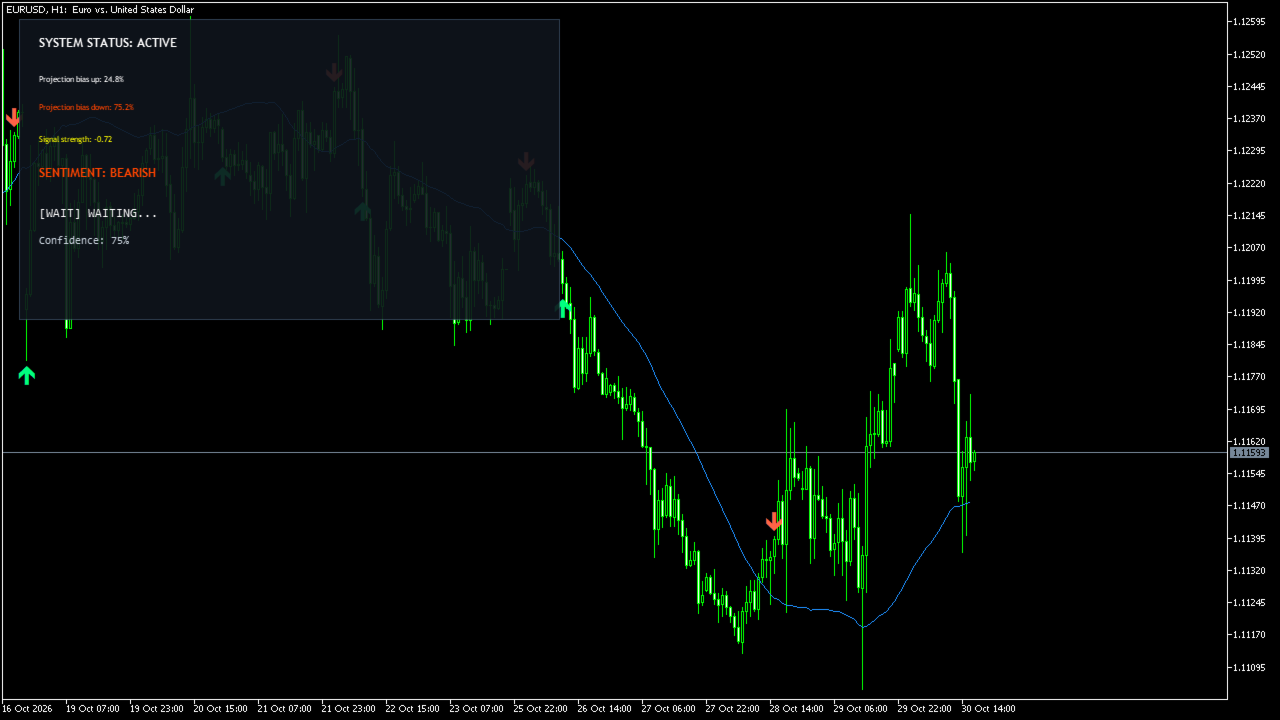
Omni Predictor fits a least-squares linear regression to the recent closing prices and extends it forward to project the next bars. The projection is shown as a line, as semi-transparent projected candles with an uncertainty cone, and as a directional score in an on-chart panel. Buy and sell arrows are evaluated on closed bars only.

How it works

  • For each closed bar, a regression line is fitted to the last N closes (default 120) and extended forward by 1 to 32 bars. History and live bars use exactly the same calculation.
  • The directional score compares the first projected value with the bar's close: score = 0.5 + 0.5 x tanh(distance / 200 points). It is shown in the panel as projection bias up/down percentages. It is a scaled distance, not a statistical probability.
  • A buy arrow is drawn when the up score exceeds the threshold (default 0.72); a sell arrow when the down score exceeds it. After an arrow, the same side re-arms only when price crosses back over the projection, which avoids repeated arrows in one direction. Arrows are never placed on the forming bar.
  • When the last closed bar has an arrow, the panel shows a suggested plan: stop beyond the recent swing low/high plus a margin, and target at a risk multiple (or the projected extreme, whichever is further).

Main features

  • Regression projection line and projected candles with uncertainty cone
  • Closed-bar buy and sell arrows (indicator buffers, usable via iCustom)
  • Panel with direction scores, signal strength, sentiment and the suggested entry/SL/TP

Inputs

  • Context bars, number of projected bars, max history bars
  • Arrow score threshold and arrow offset
  • Plan settings: swing lookback, SL margin, risk-reward multiple, minimum risk
  • Strength and sentiment weights and thresholds
  • Appearance settings

Notes and limitations

  • A regression projection is a mathematical extrapolation, not a prediction of future prices. Arrows tend to appear when price deviates strongly from the regression line.
  • The score uses a fixed 200-point scale, so its sensitivity depends on the symbol's point size; adjust the threshold per symbol.
  • The "max MAE" input is reserved for future use and currently has no effect.
  • The indicator does not trade and does not send alerts.

Recommended use

Any symbol; M15 to H4 charts are a good starting point. Use as a visual aid together with your own analysis.

Önerilen ürünler
XCalper HiLo Activator
Aecio de Feo Flora Neto
HiLo Activator v1.02 by xCalper The HiLo Activator is similar to moving average of previous highs and lows. It is a trend-following indicator used to display market’s direction of movement. The indicator is responsible for entry signals and also helps determine stop-loss levels. The HiLo Activator was first introduced by Robert Krausz in the Feb. 1998 issue of Stocks & Commodities Magazine.
Volume Profile Indicator used by professional Traders at Traders Inside Ltd. If you want to succeed in trading you need to know if current price is cheap, expensive or fair valued. Key features: Fair price (Point of control, POC), high and low price zones (POH, POL) POC in different timeframes for better orientation Symbol and timeframe Chart resize on open positions/orders, VPRmax/min Historic POC - see, how POC has changed the last periods Button to show/hide VPR Calculated Bars (best results)
HiLo Activator Plus
Rodrigo Galeote
5 (1)
HiLo Activator is one of the most used indicators to determine trend. Find it here with the ability to customize period and colors. This indicator also plots up and down arrows when there is a change on the trend, indicating very strong entry and exit points. HiLo fits well to different types of periods for day trading. You can easily understand when it is time to buy or sell. It works pretty good also for other periods like daily and monthly signalizing long-term trends. The use of the indicato
Scan a fixed list of assets (Ibovespa) in the chosen timeframe (TimeFrame). For each pair and for various periods. Calculate a regression model between the two assets (and, if desired, using the bova11 index as a normalizer). Generate the spread of this relationship, its mean, standard deviation, speculative deviation, and betas (B1 and B2). Apply an ADF test without exclusion (cointegration/stationarity). Calculate the Z-score of the current exclusion (how many standard deviations are away from
FREE
Volume Force MT5
Thiago Pereira Pinho
**V-FORCE PRO - METATRADER 5 İÇİN GELİŞMİŞ HACİM GÖSTERGESİ** **V-Force Pro ile Gerçek Hacmin Gücünü Keşfedin - Piyasa Analizinde Devrim!** **Artık Karanlıkta İşlem Yapmayın! Büyük Oyunculerin Gücünü Gerçek Zamanlı Görselleştirin.** **Her Trader'ın Karşılaştığı Sorun:** Tüm teknik göstergeler aynı yönü gösterdiğinde bile neden bazı piyasa hareketleri başarısız oluyor? Cevap **GERÇEK HACMİN** içinde yatıyor - çoğu trader'ın gözden kaçırdığı yapbozun en önemli parçası! **V-Force Pro 5.3 - Spee
CRT Candle Range Theory HTF MT5 - Ultimate CRT Indicator: Gelişmiş ICT Konseptleri ve Malaysian SnR Ticaret Sistemi En gelişmiş Candle Range Theory göstergesi ile Piyasa Yapıcıların ayak izlerinde ustalaşın. Smart Money Concepts (SMC) gücünü açığa çıkarın ve Ultimate CRT Indicator ile tıpkı kurumlar gibi hassas bir şekilde ticaret yapın. Sadece ciddi yatırımcılar için özel olarak oluşturulan bu gösterge, ICT Konseptlerinin (Inner Circle Trader) temel direği olan oldukça etkili CRT (Candle Range
Renko Plus
Eadvisors Software Inc.
With Renko Plus you can use the features in the Indicator functionality, just add it to the Metatrader5 chart.             The Renko chart is a type of chart, developed by the Japanese, that is constructed using price movement rather than standardized prices and time intervals like most charts. It is believed to be named after the Japanese word for bricks, "renga", as the graphic looks like a series of bricks.             A new brick is created when the price moves a specified pri
RSI Divergence Risk Target Signals RSI Divergence Risk Target Signals is a MetaTrader 5 indicator that detects confirmed bullish and bearish RSI divergence and combines the signals with optional trend filters, ATR-based Stop Loss levels, three Take Profit targets, alerts and an internal trade statistics dashboard. The indicator compares confirmed RSI pivot structure with corresponding price highs and lows. It is designed to help traders identify momentum divergence while providing a structure
ÖZEL TEKLİF: İlk 100 alıcı bu göstergeye ömür boyu erişim hakkı kazanacak! Price Daily Percentage Variation Price Daily Percentage Variation , varlığın günlük yüzde değişimine dayalı fiyat seviyelerini belirlemek için geliştirilmiş bir indikatördür ve tüm işlem seansını takip eden sabit bir yüzde ızgarası oluşturur. Günün açılış fiyatından başlayarak indikatör, otomatik olarak bir merkez çizgi ve bu seviyenin yukarı ve aşağı yönlü çeşitli çizgilerini çizerek istatistiksel destek ve direnç
HAshi-E is an enhanced way to analyze Heiken-Ashi signals. Briefing: Heiken-Ashi is particularly valued for its ability to filter out short-term volatility, making it a preferred tool for identifying and following trends, helps in decision-making regarding entry and exit points, and assists in distinguishing between false signals and genuine trend reversals. Unlike traditional candlestick charts, Heiken-Ashi candles are calculated using average values of previous bars, creating a smoother, mo
Volume Speedometer
Flavio Javier Jarabeck
Imagine the ability to have Volume Speed second by second presented to you in the form of a speedometer... Well, imagine no more... Welcome to the new Minions Labs creation: Volume Speedometer . Volume Speedometer is a Minions Labs idea that was born trying to show in realtime what is happening with the Volume Flow of orders (or Ticks, if you don't have that) during the day. This indicator was created to be used in Intraday trading and the goal is to give you a "heads up" when the Volume flow is
Market Profile Suite
Muhammad Minhas Qamar
Developed by MMQ —  Market Profile Suite   Was: $79 Now: $59 A comprehensive Market Profile indicator for MetaTrader 5 that visualizes price distribution through TPO (Time Price Opportunity) analysis. The implementation draws from concepts presented in Jim Dalton's "Mind Over Markets," providing traders with tools to understand market structure, value areas, and volume distribution across multiple timeframes and session configurations. Links [ Documentation  |  Video  | More ] Feature Highlight
WaveTrend Oscillator MT5 güçlü bir ticaret göstergesidir ve momentum değişimlerini ve potansiyel trend dönüşlerini belirleyerek piyasa analizinizi geliştirmek için tasarlanmıştır. Her seviyeden trader için ideal olan bu araç, forex, kripto paralar ve emtialar dahil olmak üzere çeşitli piyasalarda aşırı alım ve aşırı satım koşulları hakkında değerli bilgiler sunar. Doğru alım ve satım sinyalleri üretebilme yeteneği ile WaveTrend Oscillator MT5, trader'ların bilinçli kararlar almasını sağlar ve he
FiveStarFX Gold Reversal Edge Professional automated trading solution designed for structured execution and controlled risk management in the Gold market. Built for traders who value discipline, precision, and consistency. Key Features Fully automated trading One trade at a time (controlled exposure) Fixed Stop Loss and Take Profit Smart Break-Even protection Profit lock with buffer Step-based trailing management Spread protection system Works on any broker Trade Management The E
FREE
Pulse Reversal Zones Pro, MT5 yatırımcılarının olası geri dönüş bölgelerini, piyasa yorgunluğunu, giriş alanlarını, TP/SL tahminlerini ve trend baskısını temiz, gerçek zamanlı bir gösterge paneliyle belirlemelerine yardımcı olur. Satın almadan önce demoyu indirin ve Strateji Test Cihazında deneyin. Pulse Reversal Zones Pro, grafiği aşırı kalabalıklaştırmadan potansiyel piyasa geri dönüşlerini, momentum yorgunluğunu ve fiyat tepki bölgelerini daha net bir şekilde belirlemek isteyen yatırımcılar
# Multi-Timeframe Trend Sync Pro (MTTS Pro) ## Synchronize Multiple Timeframes and Trade with Trend Confluence **MTTS Pro** is an advanced technical indicator developed for traders seeking precision in multi-timeframe analysis. By consolidating information from multiple timeframes simultaneously, the indicator identifies points of high confluence where multiple timeframes confirm the same market direction. --- ## MAIN FEATURES ### **Simultaneous Multi-Timeframe Analysis** - Monitor up t

Support Resistance Zone Master is a display-only support and resistance indicator for MetaTrader 5. It detects price zones from historical highs and lows on a selectable timeframe, then plots them directly on the chart so you can see where the market has reacted before. The indicator shows two types of levels: Current Support / Resistance — the single nearest support level below price and the single nearest resistance level above price, drawn as solid horizontal lines. Multiple levels (R1–R6 / S
Renko + ATR Trend Envelope PRO+ (Non-Repainting) Renko + ATR Trend Envelope PRO+ is a clean trend-filter indicator that combines a Renko-style step histogram with an ATR-based trend envelope. It highlights trend direction, volatility expansion/contraction and trend reversals with arrows and optional alerts. This tool is ideal for: Trend following strategies Breakout confirmation Filtering false entries during choppy markets Visualizing volatility using ATR envelopes Key Features Renko-Style Hi
TrendView Zero — Zero Setup. Zero Complexity. Maximum Clarity. Over time, we received valuable feedback from traders who tested TrendView Ultimate, our most advanced indicator. Many loved its power and depth, but also shared a common challenge: “It’s incredibly powerful, but it gives SO much information that I don’t always know what to configure.” This inspired the creation of TrendView Zero, a fully automated, streamlined version that keeps only the information that matters most. It provide
Cvd Divergence
Thalles Nascimento De Carvalho
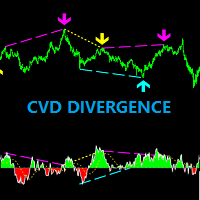
CVD Divergence – Profesyonel Emir Akışı ve Diverjans Analizi CVD Divergence, fiyat ile Kümülatif Delta Hacmi (CVD) arasındaki güvenilir uyumsuzlukları tespit etmek için tasarlanmış teknik bir göstergedir. Gerçek emir akışının fiyat hareketini doğrulamadığı anları yüksek hassasiyetle belirleyerek olası dönüşleri, momentum zayıflamasını ve kurumsal manipülasyonları ortaya çıkarır. Gösterge, agresif hacim analizini fiyat yapısıyla birleştirerek net, objektif ve erken sinyaller sağlar. Göstergenin Ö
Göreceli Güç Endeksi(RSI) Çoklu Para Birimi Tarayıcısı MT5 , birden fazla döviz çiftini aynı anda etkili bir şekilde izlemek isteyen traderlar için tasarlanmış yenilikçi bir ticaret aracıdır. Güçlü RSI göstergesini kullanarak, bu tarayıcı piyasa koşullarının kapsamlı bir özetini sunarak, traderların çeşitli zaman dilimlerinde potansiyel ticaret fırsatlarını belirlemelerine yardımcı olur. Bu gösterge, kritik sinyalleri kullanıcı dostu bir formatta sunarak önemli avantajlar sağlar. Traderlar, stra
Setup 9.1 strategy created by the North American trader Larry Williams . SIMPLE setup, effective, with a good level of accuracy and excellent return. Attention : The Demo version only works on the tester, if you are interested in running it in real time, please contact me and I will provide another version. Buy Signal: Exponential moving average of 9 (MME9) is falling, wait it to TURN UP (in closed candle). Place a buy stop order 1 tick above the HIGH of the candle that caused the turn to occur.
ATrend
Zaha Feiz
4.63 (19)
ATREND: Nasıl Çalışır ve Nasıl Kullanılır ### Nasıl Çalışır "**ATREND**" göstergesi, MT5 platformu için tasarlanmış olup, traderlara sağlam alım ve satım sinyalleri sağlamak amacıyla teknik analiz metodolojilerinin bir kombinasyonunu kullanır. Bu gösterge, öncelikle volatilite ölçümü için Ortalama Gerçek Aralık (ATR) kullanır ve potansiyel piyasa hareketlerini belirlemek için trend tespit algoritmalarıyla birleştirir. Satın aldıktan sonra bir mesaj bırakın ve özel bir bonus hediyesi kazanın. ##
This indicator is best used for   Trend Riding . It ensures that you only enter trades when both the short-term momentum and the medium-term trend are aligned, significantly reducing the risk of being caught in a trend reversal or a flat market. Neutral Zone Protection:   When the price is stuck between (a "mixed" or sideways market), the indicator   hides all signals . This keeps your chart clean and prevents trading in choppy, undecided conditions. Real-Time Dashboard:   A text display in the
Overview Harmonic Patterns MT5 is a technical analysis indicator designed for the MetaTrader 5 platform. It identifies and displays harmonic price patterns, such as Butterfly, Cypher, Crab, Bat, Shark, and Gartley, in both bullish and bearish directions. The indicator calculates key price levels, including entry, stop loss, and three take-profit levels, to assist traders in analyzing market movements. Visual elements and customizable alerts enhance usability on the chart. Features Detects six ha
Weis Wave Scouter
Jean Carlos Martins Roso
MetaTrader 5 için geliştirilen Weis Wave Scouter ile gelişmiş hacim analizinin gücünü keşfedin! Bu devrim niteliğindeki gösterge, Wyckoff yönteminin ve Hacim Yayılımı Analizinin (VSA) kanıtlanmış ilkelerini birleştiriyor. Operasyonlarında doğruluk ve derinlik arayan yatırımcılar için tasarlanmıştır ve kümülatif hacim dalgası analizi yoluyla piyasanın taktiksel bir okumasını sunar. Weis Wave Scouter, Classic, NightVision ve OceanBreeze gibi özelleştirilebilir renk temaları ile renkli histogramlar
Noize Absorption Index - is the manual trading system that measures the difference of pressure between bears forces and bulls forces. Green line - is a noize free index that showing curent situation. Zero value of index shows totally choppy/flat market.Values above zero level shows how powerfull bullish wave is and values below zero measures bearish forces.Up arrow appears on bearish market when it's ready to reverse, dn arrow appears on weak bullish market, as a result of reverse expectation.
TRI Visualizer
Yoshimi Mon 三 Ura
TRI Visualizer MT5 – Thermodynamic Market Analysis Overview The TRI (Thermal Range Indicator) Visualizer Enhanced is a rare market analysis indicator that goes beyond conventional technical analysis, applying principles of thermodynamics from physics. It interprets market price fluctuations as “thermodynamic energy,” enabling the highly accurate detection of subtle market changes that are often overlooked. Innovative Mechanisms 1. Dual Calculation Engines Classic TRI Mode Formula: |Close
This indicator builds upon the previously posted Nadaraya-Watson smoothers. Here we have created an envelope indicator based on Kernel Smoothing with integrated alerts from crosses between the price and envelope extremities. Unlike the Nadaraya-Watson estimator, this indicator follows a contrarian methodology. Please note that by default this indicator can be subject to repainting. Users can use a non-repainting smoothing method available from the settings. The triangle labels are designed so
DoctorEdge V-LINE (Pump it & Dump it) Strategy Pro Confirms trend direction using smart momentum logic and key price behavior How It Works DoctorEdge V-LINE is a smart visual indicator designed to detect trend impulses and confirm their strength based on how price reacts around certain dynamic zones. Buy Trend: When price reaches level -20 , the line turns green , signaling a potential buy . If price breaks above level 0 and the line stays green, the uptrend is confirmed . If price doe
Bu ürünün alıcıları ayrıca şunları da satın alıyor
Trend Sniper X
Sarvarbek Abduvoxobov
4.86 (43)
Trend Sniper X , tüccarların trend yönünü ve olası dönüş noktalarını netlik ve hassasiyetle belirlemelerine yardımcı olan MetaTrader 5 için çoklu zaman dilimli bir trend takip göstergesidir. MT4 için: https://www.mql5.com/en/market/product/193245 Fiyat Bilgisi: Mevcut fiyat tanıtım amaçlıdır ve gelecek güncellemeler ile yeni özellikler yayınlandıkça değişebilir. Bonus Fırsatı: Bu indikatör için ÜCRETSİZ Oto-Trade Assistant EA'yı almak için lütfen satın aldıktan sonra yazara mesaj gönderin. Code
Smart Trend Trading System — MetaTrader 5 Satın aldıktan sonra Smart Universal Expert Advisor'ı ÜCRETSİZ edinmek ve beraberinde çevrimiçi kurs, PDF kılavuzu ve özel gruba erişim almak için MQL5 üzerinden bana mesaj gönderin. STTS; trend yönünü, giriş ve çıkış sinyallerini, dönüş bölgelerini ve önemli fiyat seviyelerini doğrudan grafiğinizde bir araya getirir. Sistemi manuel işlemler için kullanabilir veya ayrı bir uyumlu EA’yı bağlayarak seçtiğiniz ayarlarla otomatik işlem gerçekleştirebilirsini
Şehre yeni bir Kral geldi - Gösterge + Emir Yönetimi göstergeleri (TP1 + TP2 + TP3) + Opsiyonel Telegram Sinyal Gönderici DAHİL (ÜCRETSİZ) (TAM TRADING ve SİNYAL SİSTEMİ) Altın için en iyi EA’mız: Gold Slayer Bu gösterge; gelişmiş bir strateji, özelleştirilebilir emir yönetimine sahip bir trading sistemi ve envelope uzantılarını birleştiren bir mean reversion sistemi içerir. Ayrıca RSI gibi birçok akıllı onay filtresiyle desteklenerek yüksek olasılıklı dönüş girişlerini AL ve SAT sinyalleriyle y
SuperScalp Pro
Van Minh Nguyen
4.54 (37)
SuperScalp Pro - Professional Multi-Layer Confluence Scalping System SuperScalp Pro, klasik Supertrend sistemini birden fazla akıllı doğrulama filtresiyle geliştiren ileri düzey bir scalping göstergesidir. Yanlış sinyalleri önemli ölçüde azaltırken başarı olasılığı daha yüksek Buy/Sell işlem fırsatlarını belirlemenize yardımcı olur. Buy ve Sell okları doğrudan grafik üzerinde net bir şekilde görüntülenir. ATR tabanlı Stop Loss ve Take Profit seviyeleri de gerçek zamanlı olarak otomatik hesaplanı
2019'da bu indikatörün neler yapabildiğini tüm dünyaya gösterdim. Sinyallerine göre elle, gerçek hesapta ve herkesin gözü önünde işlem yaptım — hesap Myfxbook'ta izleniyordu ve bu deneyi Facebook'ta ayrıntılı olarak paylaştım. Sonuç: 10.000 dolar dört ayda 941.411 dolara dönüştü. Risk bilinçli olarak aşırıydı — drawdown %54'e kadar çıktı, çünkü mesleğimizde kâr ve risk her zaman el ele gider. Myfxbook ekran görüntüsü galerideki ilk resimdir. Görünen o ki sizi tebrik edebilirim: arayışınız sona e
ULTRA, “hepsi bir arada” prensibiyle çalışan bir teknik göstergedir; piyasayı bağımsız olarak analiz eder, işlem sinyalleri üretir, stop-loss emirlerinin verileceği seviyeleri gösterir ve kârı garantilemek ya da zararı en aza indirmek için işlemlerin ne zaman kapatılması gerektiğini önerir. Başka bir deyişle, piyasayı nasıl analiz edeceğinizi bilmeseniz, seviyeleri (stop-loss'unuzu nereye koyacağınızı) belirleyemeseniz ya da para yönetimi konusunda zorluk yaşasanız da fark etmez. ULTRA tüm bunla
M1 Sniper MT5
Oleg Rodin
5 (7)
M1 SNIPER   kullanımı kolay bir işlem göstergesi sistemidir. M1 zaman dilimi için tasarlanmış bir ok göstergesidir. Gösterge, M1 zaman diliminde scalping için bağımsız bir sistem olarak kullanılabilir ve mevcut işlem sisteminizin bir parçası olarak kullanılabilir. Bu işlem sistemi özellikle M1'de işlem yapmak için tasarlanmış olsa da, diğer zaman dilimleriyle de kullanılabilir. Başlangıçta bu yöntemi XAUUSD ve BTCUSD ticareti için tasarladım. Ancak bu yöntemi diğer piyasalarda işlem yaparken de
Gann Made Easy , bay teorisini kullanarak ticaretin en iyi ilkelerine dayanan, profesyonel ve kullanımı kolay bir Forex ticaret sistemidir. WD Gann. Gösterge, Zararı Durdur ve Kâr Al Seviyeleri dahil olmak üzere doğru SATIN AL ve SAT sinyalleri sağlar. PUSH bildirimlerini kullanarak hareket halindeyken bile işlem yapabilirsiniz. Satın alma işleminden sonra, alım satım talimatlarını ve harika ek göstergeleri ücretsiz olarak almak için lütfen benimle iletişime geçin! Muhtemelen Gann ticaret yöntem
Auto Optimized SpeedAngle , sürekli İleriye Dönük Optimizasyon (Walk-Forward Optimization, WFO) yoluyla eğri uydurmayı (curve-fitting) ortadan kaldıran kurumsal düzeyde bir momentum vektörleme sistemidir. Piyasa rejimleri değiştiğinde etkinliğini yitiren statik girdilere güvenmek yerine, gösterge, örneklem dışı (Out-of-Sample, OOS) doğrulama kullanarak parametrelerini dinamik olarak yeniden kalibre eder ve böylece gösterilen sinyallerin geçmişteki rastgele anomalileri değil, gerçek bir istatisti
Boba Analysis Suite
Trade Ready Solutions LLC
5 (2)
Boba Analysis Suite Boba Analysis Suite, MetaTrader 5 için geliştirilmiş bir analiz göstergesidir. Piyasa yapısını, önemli fiyat bölgelerini ve genel piyasa bağlamını tek bir grafik görünümünde bir araya getirir. Trader ve trading eğitmeni olarak edinilen uygulamalı deneyimden yola çıkarak geliştirilmiştir. Piyasanın yönünü değerlendirme, önemli seviyeleri belirleme ve birden fazla zaman dilimini birlikte inceleme gibi adımlardan oluşan sistematik bir analiz sürecini destekler. Piyasa Bağlamını
Çoklu Para Birimi Güç ve Momentum Göstergesi MT5 Dynamic Forex28 Navigator, uzun süredir popüler olan göstergelerimizin gelişmiş halidir ve üç aracın gücünü tek bir araçta birleştirir: Advanced Currency Strength28 Indicator (700 değerlendirme) Advanced Currency IMPULSE with ALERT (530 değerlendirme) CS28 Combo Signals (güncel bonus) İki önceki gösterge MQL5 Market'te birlikte 1.200'den fazla değerlendirme aldı ve 2016'dan bu yana MT4 topluluğunun vazgeçilmez araçlarından biri. Dynamic Forex28 Na
Sonraki Güncelleme — Sürüm 2.52 Çok Yakında! [YENİ] Piyasa Analizinizi ve İşlem Sürecinizi Geliştirmek İçin Tasarlanmış 4 Büyük Yeni Özelliğe Hazır Olun İşlem ihtiyaçlarınızı karşılamak üzere tasarlanmış 4 yeni özellikle piyasa analizini bir üst seviyeye taşıyoruz. İşte yeni özellikler: 1. TRADE OVERVIEW DASHBOARD 2. CONFLUENCE AT ZONE 3. STRONG & WEAK HIGH/LOW 4. OTE 1. TRADE OVERVIEW DASHBOARD Piyasanın genel görünümünü daha kolay anlamanıza yardımcı olan, işlem kararlarınızı desteklemek için
FiboSniper Pro
Van Minh Nguyen
5 (4)
FiboSniper Pro – Multi-Filter Fibonacci System with Auto SL/TP and Control Panel FiboSniper Pro, seçilmiş Buy ve Sell sinyalleri üretmek için dinamik Fibonacci Envelopes ile birden fazla doğrulama filtresini birleştiren teknik bir göstergedir. Fibonacci seviyeleri Moving Average ve ATR temel alınarak hesaplanır ve ardından ADX, EMA, RSI, ATR, Volume, Time ve Candle yapısı ile filtrelenir. Gösterge, ATR tabanlı otomatik Stop Loss ve Take Profit seviyelerini doğrudan grafik üzerinde görüntüler ve
Zain Gold Scalping
Ahmed Gamal Abdel Nasser Mohamed
A complete price-action analysis tool built around dual independent entry logic, each confirmed against a volatility band, combined with a configurable set of nine optional confirmation filters that let you shape exactly how conservative or aggressive the tool's signals behave. Core Strategy Two independent entry setups, each triggering only when price moves outside a dynamic volatility band — giving two distinct ways to spot potential reversal points, which can be used together or separately.
Power Candles MT5
Daniel Stein
4.58 (12)
Power Candles V3 - Kendi Kendini Optimize Eden Güç Göstergesi Power Candles V3, döviz ve enstrüman gücünü, eklendiği her grafikte eyleme geçirilebilir bir ticaret planına dönüştürür. Sadece mumları renklendirmek yerine, arka planda canlı bir otomatik optimizasyon çalıştırır ve önünüzdeki sembol için en iyi Stop Loss, Take Profit ve sinyal eşiğini size sunar. Tek bir tıklama ile canlı ticarete uyarlanır - giriş, Stop Loss ve Take Profit ışınları grafikte tam fiyatlarla görünür ve uyarılar yön bil
Quantum TrendPulse
Bogdan Ion Puscasu
5 (26)
SuperTrend   ,   RSI   ve   Stochastic'in   gücünü tek bir kapsamlı göstergede birleştirerek işlem potansiyelinizi en üst düzeye çıkaran nihai işlem aracı olan   Quantum TrendPulse'u   tanıtıyoruz. Hassasiyet ve verimlilik arayan yatırımcılar için tasarlanan bu gösterge, piyasa trendlerini, momentum değişimlerini ve en uygun giriş ve çıkış noktalarını güvenle belirlemenize yardımcı olur. Temel Özellikler: SuperTrend Entegrasyonu:   Güncel piyasa trendlerini kolayca takip edin ve karlılık dalgası
Adaptive Price Action Engine Göstergeyi al, EA'sı (Uzman Danışman) bedava gelsin Kendi Kendini Optimize Eden Multi-Timeframe Trend ve Mum Formasyonu Analizi Piyasalar sürekli değişir ve her Price Action formasyonu her piyasa koşulunda aynı değere sahip değildir. Adaptive Price Action Engine , değişen piyasa koşullarına uyum sağlamak amacıyla trend yapısını, Multi-Timeframe analizini, mum formasyonlarını ve istatistiksel optimizasyonu tek bir analiz sistemi içerisinde birleştirir. İki Adaptif Mod
Trend Catcher ind mt5
Ramil Minniakhmetov
5 (18)
TREND YAKALAYICI GÖSTERGE Trend Yakalayıcı Gösterge, yazarın tescilli ve özelleştirilmiş uyarlanabilir trend analiz göstergelerinin bir kombinasyonunu kullanarak piyasa fiyat hareketlerini analiz eder. Kısa vadeli gürültüyü filtreleyerek ve temel momentum gücüne, volatilite genişlemesine ve fiyat yapısı davranışına odaklanarak gerçek piyasa yönünü belirler. Ayrıca, hareketli ortalamalar, RSI ve volatilite filtreleri gibi yumuşatma ve trend filtreleme özelleştirilmiş göstergelerinin bir kombina
Superhero
Ihor Otkydach
5 (3)
SUPERHERO göstergesi, "her şeyi kapsayan" bir temele dayalı olarak tasarlanmış çoklu para birimli bir işlem sistemidir. Gösterge, piyasayı bağımsız olarak analiz eder ve işlemlerin ne zaman açılıp kapatılacağına dair sinyaller verir. Stop Loss ve Take Profit emirlerini kullanır. R:R oranı 1:1'dir. Bu sistem akıllı telefonunuza anlık bildirimler gönderebilir; böylece bir bilgisayara bağlı kalmanıza gerek kalmadan "hareket halindeyken" işlem yapabilirsiniz. Bu, özel ticaret şirketleri için idealdi
Neuro Poseidon MT5
Daria Rezueva
4.75 (52)
Neuro Poseidon is a new indicator by Daria Rezueva. It combines precise trading signals with adaptive TP/SL levels - creating best possible trades as a result! Message me and get  Neuro Poseidon Assistant  as a gift to automize your trading process! What makes it stand out? 1. Proven profitability on all assets and timeframes 2. Only confirmed BUY and SELL signals present on the chart 3. Adaptive TP & SL levels generated by the software for each trade 4. Easy to understand - suitable for al
Azimuth Pro
Ottaviano De Cicco
5 (7)
Azimuth Pro V2: Synthetic Fractal Structure and Confirmed Entries for MT5 Overview Azimuth Pro is a multi-level swing structure indicator by Merkava Labs . Four nested swing layers, swing-anchored VWAP, ABC pattern detection, three-timeframe structural filtering, and closed-bar confirmed entries — one chart, one workflow from micro-swings to macro-cycles. This is not a blind signal product. It is a structure-first workflow for traders who care about location, context, and timing. Halloween P
Break and Retest Hunter is a powerful MetaTrader 5 indicator designed to automatically identify support and resistance levels, breakout structures, and potential retest opportunities in real time. Bonus Indicator: After purchasing Break and Retest Hunter , contact me to receive Trade Indicator Assistant EA completely free as a bonus utility. $65 for the next 10 copies . Next price is $120.  Combining adaptive market analysis, clear BUY/SELL signals, Fibonacci-based profit targets, and a premiu
OrderFlux – MetaTrader 5 için Orderflow Footprint Chart, Volume Profile ve Market Profile Göstergesi OrderFlux, MetaTrader 5 için geliştirilmiş, emir akışını ayrıntılı biçimde gösteren bir Footprint göstergesidir. Her mumun içini açarak her fiyat seviyesinde gerçekleşen işlem hacmini gösterir ve bu hacmi agresif alıcılar ile agresif satıcılar arasında ayırır. Tick verilerinden yararlanarak delta, dengesizlik, absorpsiyon, Volume Profile, Market Profile (TPO), VWAP, kümülatif delta (CVD), DOM sek
CGE Trading Suite
Carl Gustav Johan Ekstrom
5 (3)
Institutional-Grade Analytics for MT5 The full analytical edge of a professional trading desk, built into your MT5 chart. A full guided tour walks you through every feature step by step. Standard retail platforms lack the depth required for professional market analysis. The CGE Trading Suite bridges this gap, transforming MetaTrader 5 into a comprehensive workspace. By integrating 18 proprietary modules into a single, unified chart interface, the suite eliminates fragmented analysis. It provide
Scalper Vault, gün içi işlemlerde istikrar yakalamak isteyen yatırımcılar için tasarlanmış, güçlü ve tam donanımlı bir alım satım sistemidir. Bu yüksek hassasiyetli gösterge; hem Forex hem de İkili Opsiyon yatırımcıları için kurumsal düzeyde analizler sunan, bağımsız ve eksiksiz bir alım satım sistemi işlevi görür. SATIN ALIM İŞLEMİNDEN SONRA BENİMLE İLETİŞİME GEÇİN; ALIM SATIM İPUÇLARIMI VE HARİKA BİR BONUSU ALIN! Tahmin yürütme zorunluluğunu ve karmaşık manuel analiz süreçlerini ortadan kaldı
Divergence Bomber
Ihor Otkydach
4.89 (94)
Bu göstergeyi satın alan herkese aşağıdaki ekstra içerikler ücretsiz olarak sunulmaktadır: Her işlemi otomatik olarak yöneten, Stop Loss ve Take Profit seviyelerini ayarlayan ve işlemleri strateji kurallarına göre kapatan özel yardımcı araç: "Bomber Utility" Göstergenin farklı varlıklar üzerinde kullanılmasına yönelik ayar dosyaları (set dosyaları) Bomber Utility için 3 farklı modda kullanım sunan ayar dosyaları: "Minimum Risk", "Dengeli Risk" ve "Bekle-Gör Stratejisi" Bu ticaret stratejisini
FX Analysis is an all-in-one MT5 indicator dashboard that combines eight analytical tools in a single panel, helping traders identify high-probability setups without switching between charts or indicators. Designed for standard forex pairs on MetaTrader 5. Best results on M15 - H4 timeframes when all components are used together as part of the included workflow. Components Volatility Analyzer Displays historical average movement by hour and by day of the week. A real-time Pip Balance shows the
Yeni Başlayanlar veya Uzman Tüccarlar için En İyi Çözüm! Bu Gösterge benzersiz, yüksek kaliteli ve uygun fiyatlı bir ticaret aracıdır çünkü bir dizi tescilli özellik ve yeni bir formül ekledik. Sadece BİR grafik ile 28 Forex çifti için Döviz Gücünü okuyabilirsiniz! Yeni bir trendin veya scalping fırsatının tam tetik noktasını belirleyebildiğiniz için ticaretinizin nasıl gelişeceğini hayal edin? Kullanım kılavuzu:   buraya tıklayın Bu ilk olan, orijinal! Değersiz bir özenti klonunu almayın.
Crystal Heikin Ashi Signals
Muhammad Jawad Shabir
5 (5)
Crystal Heikin Ashi Signals—Professional Trend & Signal Detection Indicator Advanced Heikin Ashi Visualization with Intelligent Signal System for Manual & Automated Trading Final Price: $149 ---------> Price goes up $10 after every 10 sales . Limited slots available — act fast . Overview User Guide PDF Crystal Heikin Ashi Signals is a professional-grade MetaTrader 5 indicator that combines pure Heikin Ashi candle visualization with an advanced momentum-shift detection system. Designed for both m
Merhaba yatırımcılar! Birçok bireysel yatırımcı yavaş web komut dosyaları kullanıyor. Kârlı işlem yapmak için sistematik bir yaklaşım şarttır. Astro AI göstergesi sadece bir grafik üzerindeki görselleştirme değildir. Doğrudan terminal içinde çalışan iki ajandan oluşan gelişmiş bir sinir ağıdır. Sistemin teknik detayları: 1. Ajan 1: Analist (Grafiksel Sinir Ağı – GNN) Piyasa, tek tek fiyat çubuklarından değil, birbirine bağlı verilerden oluşan bir ağdan oluşur. İşlev: Ajan 1, bu karmaşık, d
Yazarın diğer ürünleri
Master Institutional AI
Matheus Rodrigues Satriano
️ INSTITUTIONAL WARNING: This is not a retail "magic arrows" system. The Master Institutional AI Ecosystem is a bank-level quantitative treasury infrastructure for MetaTrader 5. It combines statistical Order Flow processing, stochastic regimes, and neural intelligence to identify where major players (HFTs and Treasuries) are injecting real liquidity. If you are looking for institutional precision instead of lagging indicators, this is your definitive upgrade. Our engine does not "guess" the ma
Confluencia Dimensional MTF
Matheus Rodrigues Satriano
Confluencia Dimensional MTF is a chart indicator that combines three classic tools (EMA crossover state, RSI and MACD) on three timeframes at the same time: M15, H1 and H4. Each timeframe receives a score between -1 and +1, and the indicator draws a buy arrow, a sell arrow or an exit mark only when the scores agree. How it works For every active timeframe the score is a weighted sum of: trend (fast EMA above or below slow EMA), normalized RSI distance from 50, and the sign of the MACD main line
Institutional Volume Anomaly Detector measures how unusual the volume of each bar is compared with the recent past. It calculates a Z-score (number of standard deviations from the rolling mean) and shows the absolute value as a color histogram in a separate window. Bars above your threshold are highlighted and can be marked on the main chart. The indicator uses only data provided by your broker's terminal; it does not access any external or off-exchange data source. How it works For every closed
Deep State Regime Classifier
Matheus Rodrigues Satriano
Deep State Regime Classifier paints the candles of your chart according to the market regime detected on each closed bar. It is a deterministic, rule-based classifier built on well-known statistics: a rescaled-range estimate of the Hurst exponent, a fractal dimension index (FDI), the standard deviation of price changes and momentum. The same data always produces the same colors. How it works For each closed bar the indicator looks back over a configurable window (default 144 bars) and calculates
Visual Strategy Terminal
Matheus Rodrigues Satriano
Visual Strategy Terminal is an indicator that runs a quick virtual backtest of a simple rule set on the chart's history and draws the resulting equity curve in a separate window. A panel shows the number of trades, win rate, profit factor, net result and maximum drawdown. It is a tool for exploring filter combinations quickly; it does not place orders. How it works On each closed bar of the tested range, up to three filters vote: RSI: below 35 votes long, above 65 votes short MACD (12/26 with a
Institutional Architect Heatmap finds Fair Value Gaps (three-candle price imbalances) on closed bars and draws them as rectangles on the chart. Each zone is colored by how much activity the terminal's tick history shows inside the zone, so you can quickly see which gaps attracted more trading. A panel lists up to 10 symbols with an activity score, and clicking a symbol switches the chart to it. How it works A bullish gap is detected when the high of a candle is below the low of the candle two ba
OrderFlow MicroStructure Pro
Matheus Rodrigues Satriano
OrderFlow MicroStructure Pro brings several order-flow views to one chart: a daily VWAP with standard-deviation bands, buy/sell delta of each closed bar, cumulative delta, a bid x ask footprint of the last closed bar and a volume profile over a range you can move with the mouse. It is designed for exchange instruments with trade data (for example B3 futures and stocks) and also runs on Forex with an approximation described below. How it works VWAP: typical price weighted by tick volume, reset on
Mestre Unificado
Matheus Rodrigues Satriano
Mestre Unificado is a multi-timeframe confluence indicator with a built-in dashboard. It scores three standard tools (EMA trend, RSI and MACD) on M15, H1 and H4, draws buy, sell and exit arrows on the chart when the timeframes agree, and displays the score of each timeframe in a canvas panel. Everything is contained in a single file; no external indicators are required. How it works Each active timeframe receives a score from -1 to +1: a weighted sum of the EMA trend direction (fast above or bel
Mestre Neural Signal
Matheus Rodrigues Satriano
Mestre Neural Signal is a separate-window oscillator. For every closed bar it builds eight normalized features from standard indicators and price data and passes them to a compact neural network model in ONNX format that is embedded inside the indicator file. The model output, limited to the range -1 to +1, is plotted as a line. No external files or downloads are needed. The forming bar is left empty, so plotted values do not repaint. How it works Features (each clipped to -1..+1) 1. Close minus
Nexus Trade Terminal is a utility Expert Advisor that combines market context and manual execution on one panel. On every closed bar it updates three readings and offers buttons to send orders. Panel execution is disabled until you allow it in the inputs. How it works Regime: Hurst exponent and fractal dimension over the lookback window, plus momentum and volatility, classify the market as trend, mean reversion, chaotic or range/accumulation, with a heuristic confidence value. Volume and gap mon
Quantum Stat Arb Engine
Matheus Rodrigues Satriano
Quantum Stat-Arb Engine is an Expert Advisor for pairs trading. It monitors the price ratio between two symbols (by default the chart symbol and GBPUSD), opens an opposite-direction position on each symbol when the ratio moves far from its average, and closes both when the ratio returns toward the mean. How it works On each new closed bar of the analysis timeframe, the ratio A/B is compared with its mean and standard deviation over the lookback window to obtain a Z-score. The correlation of bar-
Aegis Order and Risk Manager is a utility Expert Advisor for traders who open positions themselves. A two-tab panel provides one-click buy and sell orders, and the EA manages the positions of the chart symbol with a fractal trailing stop, an optional basket profit target and an optional rescue hedge. How it works Trade tab: set Risk % and volume with the +/- buttons, then click BUY or SELL. With panel risk sizing on (default), the volume is calculated from Risk % of the balance over the default
Filtrele:
Değerlendirme yok
Değerlendirmeye yanıt