Omni Predictor

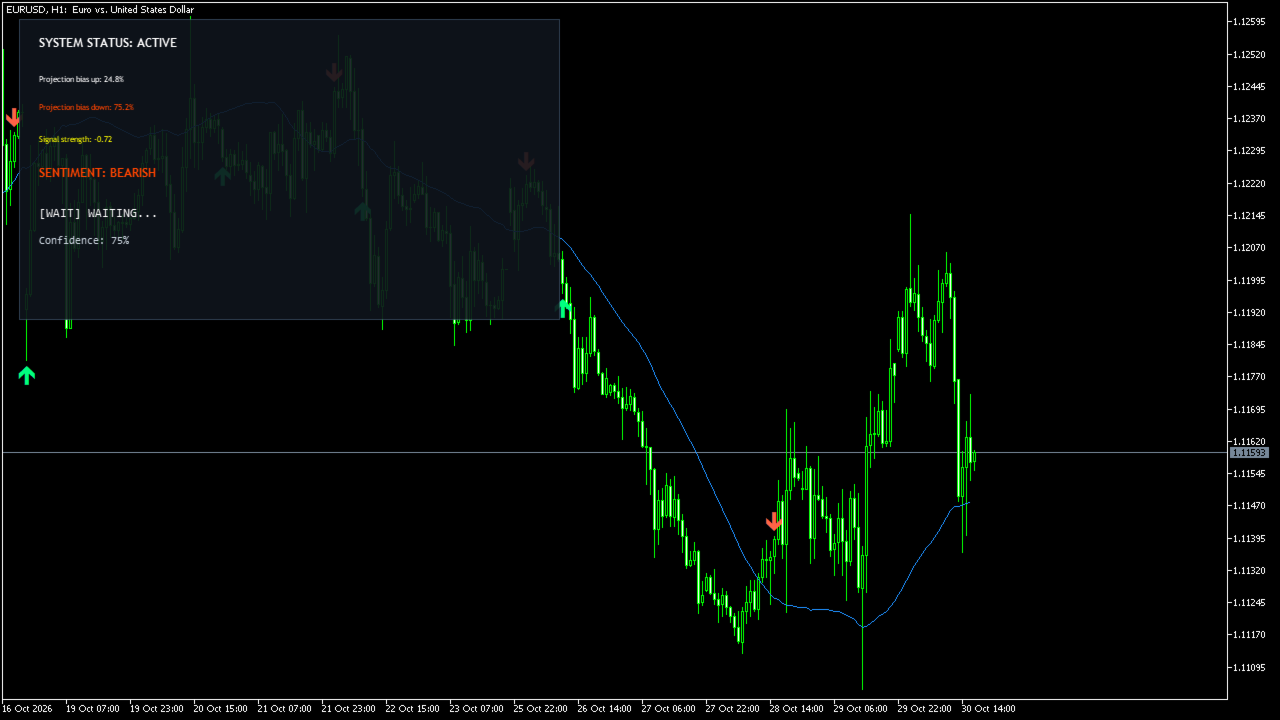
Omni Predictor fits a least-squares linear regression to the recent closing prices and extends it forward to project the next bars. The projection is shown as a line, as semi-transparent projected candles with an uncertainty cone, and as a directional score in an on-chart panel. Buy and sell arrows are evaluated on closed bars only.

How it works

  • For each closed bar, a regression line is fitted to the last N closes (default 120) and extended forward by 1 to 32 bars. History and live bars use exactly the same calculation.
  • The directional score compares the first projected value with the bar's close: score = 0.5 + 0.5 x tanh(distance / 200 points). It is shown in the panel as projection bias up/down percentages. It is a scaled distance, not a statistical probability.
  • A buy arrow is drawn when the up score exceeds the threshold (default 0.72); a sell arrow when the down score exceeds it. After an arrow, the same side re-arms only when price crosses back over the projection, which avoids repeated arrows in one direction. Arrows are never placed on the forming bar.
  • When the last closed bar has an arrow, the panel shows a suggested plan: stop beyond the recent swing low/high plus a margin, and target at a risk multiple (or the projected extreme, whichever is further).

Main features

  • Regression projection line and projected candles with uncertainty cone
  • Closed-bar buy and sell arrows (indicator buffers, usable via iCustom)
  • Panel with direction scores, signal strength, sentiment and the suggested entry/SL/TP

Inputs

  • Context bars, number of projected bars, max history bars
  • Arrow score threshold and arrow offset
  • Plan settings: swing lookback, SL margin, risk-reward multiple, minimum risk
  • Strength and sentiment weights and thresholds
  • Appearance settings

Notes and limitations

  • A regression projection is a mathematical extrapolation, not a prediction of future prices. Arrows tend to appear when price deviates strongly from the regression line.
  • The score uses a fixed 200-point scale, so its sensitivity depends on the symbol's point size; adjust the threshold per symbol.
  • The "max MAE" input is reserved for future use and currently has no effect.
  • The indicator does not trade and does not send alerts.

Recommended use

Any symbol; M15 to H4 charts are a good starting point. Use as a visual aid together with your own analysis.

Produits recommandés
XCalper HiLo Activator
Aecio de Feo Flora Neto
HiLo Activator v1.02 by xCalper The HiLo Activator is similar to moving average of previous highs and lows. It is a trend-following indicator used to display market’s direction of movement. The indicator is responsible for entry signals and also helps determine stop-loss levels. The HiLo Activator was first introduced by Robert Krausz in the Feb. 1998 issue of Stocks & Commodities Magazine.
Volume Profile Indicator used by professional Traders at Traders Inside Ltd. If you want to succeed in trading you need to know if current price is cheap, expensive or fair valued. Key features: Fair price (Point of control, POC), high and low price zones (POH, POL) POC in different timeframes for better orientation Symbol and timeframe Chart resize on open positions/orders, VPRmax/min Historic POC - see, how POC has changed the last periods Button to show/hide VPR Calculated Bars (best results)
HiLo Activator Plus
Rodrigo Galeote
5 (1)
HiLo Activator is one of the most used indicators to determine trend. Find it here with the ability to customize period and colors. This indicator also plots up and down arrows when there is a change on the trend, indicating very strong entry and exit points. HiLo fits well to different types of periods for day trading. You can easily understand when it is time to buy or sell. It works pretty good also for other periods like daily and monthly signalizing long-term trends. The use of the indicato
Scan a fixed list of assets (Ibovespa) in the chosen timeframe (TimeFrame). For each pair and for various periods. Calculate a regression model between the two assets (and, if desired, using the bova11 index as a normalizer). Generate the spread of this relationship, its mean, standard deviation, speculative deviation, and betas (B1 and B2). Apply an ADF test without exclusion (cointegration/stationarity). Calculate the Z-score of the current exclusion (how many standard deviations are away from
FREE
Volume Force MT5
Thiago Pereira Pinho
V-FORCE PRO – L'INDICATEUR DE VOLUME AVANCÉ POUR METATRADER 5 Découvrez la Puissance du Volume Réel avec V-Force Pro – La Révolution dans l'Analyse de Marché ! Arrêtez de Trader dans le Noir ! Visualisez la Force des Gros Joueurs en Temps Réel. Le Problème que Tout Trader Rencontre : Vous êtes-vous déjà demandé pourquoi certains mouvements de marché échouent même lorsque tous les indicateurs techniques pointent dans la même direction ? La réponse se trouve dans le   VOLUME RÉEL   – la pièce la
CRT Candle Range Theory HTF MT5 - Ultimate CRT Indicator : Concepts ICT avancés et système de trading Malaysian SnR Maîtrisez les traces des Market Makers avec l'indicateur Candle Range Theory le plus avancé. Libérez la véritable puissance des Smart Money Concepts (SMC) et tradez avec la même précision que les institutions grâce à l'Ultimate CRT Indicator. Conçu exclusivement pour les traders sérieux, cet indicateur automatise la théorie CRT, un pilier central des concepts ICT (Inner Circle Trad
Renko Plus
Eadvisors Software Inc.
With Renko Plus you can use the features in the Indicator functionality, just add it to the Metatrader5 chart.             The Renko chart is a type of chart, developed by the Japanese, that is constructed using price movement rather than standardized prices and time intervals like most charts. It is believed to be named after the Japanese word for bricks, "renga", as the graphic looks like a series of bricks.             A new brick is created when the price moves a specified pri
RSI Divergence Risk Target Signals RSI Divergence Risk Target Signals is a MetaTrader 5 indicator that detects confirmed bullish and bearish RSI divergence and combines the signals with optional trend filters, ATR-based Stop Loss levels, three Take Profit targets, alerts and an internal trade statistics dashboard. The indicator compares confirmed RSI pivot structure with corresponding price highs and lows. It is designed to help traders identify momentum divergence while providing a structure
OFFRE EXCLUSIVE : Les 100 premiers acheteurs auront un accès à vie à cet indicateur ! Price Daily Percentage Variation Le Price Daily Percentage Variation est un indicateur développé pour identifier les niveaux de prix basés sur la variation en pourcentage quotidienne de l'actif, créant une grille de pourcentage fixe qui accompagne toute la séance de négociation. À partir du prix d'ouverture du jour, l'indicateur trace automatiquement une ligne centrale et plusieurs lignes au-dessus et en d
HAshi-E is an enhanced way to analyze Heiken-Ashi signals. Briefing: Heiken-Ashi is particularly valued for its ability to filter out short-term volatility, making it a preferred tool for identifying and following trends, helps in decision-making regarding entry and exit points, and assists in distinguishing between false signals and genuine trend reversals. Unlike traditional candlestick charts, Heiken-Ashi candles are calculated using average values of previous bars, creating a smoother, mo
Volume Speedometer
Flavio Javier Jarabeck
Imagine the ability to have Volume Speed second by second presented to you in the form of a speedometer... Well, imagine no more... Welcome to the new Minions Labs creation: Volume Speedometer . Volume Speedometer is a Minions Labs idea that was born trying to show in realtime what is happening with the Volume Flow of orders (or Ticks, if you don't have that) during the day. This indicator was created to be used in Intraday trading and the goal is to give you a "heads up" when the Volume flow is
Market Profile Suite
Muhammad Minhas Qamar
Developed by MMQ —  Market Profile Suite   Was: $79 Now: $59 A comprehensive Market Profile indicator for MetaTrader 5 that visualizes price distribution through TPO (Time Price Opportunity) analysis. The implementation draws from concepts presented in Jim Dalton's "Mind Over Markets," providing traders with tools to understand market structure, value areas, and volume distribution across multiple timeframes and session configurations. Links [ Documentation  |  Video  | More ] Feature Highlight
Le WaveTrend Oscillator MT5 est un indicateur de trading puissant conçu pour améliorer votre analyse de marché en identifiant les changements de momentum et les potentielles inversions de tendance. Idéal pour les traders de tous niveaux, cet outil offre des informations précieuses sur les conditions de surachat et de survente à travers divers marchés, y compris forex, les cryptomonnaies et les matières premières. Avec sa capacité à générer des signaux d'achat et de vente précis, le WaveTrend Osc
FiveStarFX Gold Reversal Edge Professional automated trading solution designed for structured execution and controlled risk management in the Gold market. Built for traders who value discipline, precision, and consistency. Key Features Fully automated trading One trade at a time (controlled exposure) Fixed Stop Loss and Take Profit Smart Break-Even protection Profit lock with buffer Step-based trailing management Spread protection system Works on any broker Trade Management The E
FREE
Pulse Reversal Zones Pro aide les traders MT5 à identifier les zones de retournement potentielles, l'épuisement du marché, les zones d'entrée, les projections de Take Profit/Stop Stop et la pression de la tendance grâce à un tableau de bord clair et en temps réel. Téléchargez la démo et testez-la avec Strategy Tester avant de l'acheter. Pulse Reversal Zones Pro est conçu pour les traders qui souhaitent identifier plus clairement les retournements de marché potentiels, l'essoufflement du moment
Multi Timeframe Trend Sync
Jamille De Jesus Velasco
# Multi-Timeframe Trend Sync Pro (MTTS Pro) ## Synchronize Multiple Timeframes and Trade with Trend Confluence **MTTS Pro** is an advanced technical indicator developed for traders seeking precision in multi-timeframe analysis. By consolidating information from multiple timeframes simultaneously, the indicator identifies points of high confluence where multiple timeframes confirm the same market direction. --- ## MAIN FEATURES ### **Simultaneous Multi-Timeframe Analysis** - Monitor up t

Support Resistance Zone Master is a display-only support and resistance indicator for MetaTrader 5. It detects price zones from historical highs and lows on a selectable timeframe, then plots them directly on the chart so you can see where the market has reacted before. The indicator shows two types of levels: Current Support / Resistance — the single nearest support level below price and the single nearest resistance level above price, drawn as solid horizontal lines. Multiple levels (R1–R6 / S
Renko + ATR Trend Envelope PRO+ (Non-Repainting) Renko + ATR Trend Envelope PRO+ is a clean trend-filter indicator that combines a Renko-style step histogram with an ATR-based trend envelope. It highlights trend direction, volatility expansion/contraction and trend reversals with arrows and optional alerts. This tool is ideal for: Trend following strategies Breakout confirmation Filtering false entries during choppy markets Visualizing volatility using ATR envelopes Key Features Renko-Style Hi
TrendView Zero — Zero Setup. Zero Complexity. Maximum Clarity. Over time, we received valuable feedback from traders who tested TrendView Ultimate, our most advanced indicator. Many loved its power and depth, but also shared a common challenge: “It’s incredibly powerful, but it gives SO much information that I don’t always know what to configure.” This inspired the creation of TrendView Zero, a fully automated, streamlined version that keeps only the information that matters most. It provide
Cvd Divergence
Thalles Nascimento De Carvalho
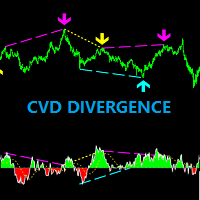
CVD Divergence – Analyse Professionnelle du Flux d’Ordres et des Divergences CVD Divergence est un indicateur technique conçu pour détecter des divergences fiables entre le prix et le Cumulative Delta Volume (CVD). Il identifie avec précision les moments où le flux réel d’ordres ne confirme pas le mouvement du prix, révélant ainsi de possibles retournements, des phases d’essoufflement et des manipulations institutionnelles. L’indicateur combine l’analyse du volume agressif avec l’étude structure
L'Indice de Force Relative (RSI) Scanner Multidevises MT5 est un outil de trading innovant conçu pour les traders qui souhaitent surveiller efficacement plusieurs paires de devises simultanément. En utilisant le puissant indicateur RSI, ce scanner fournit un aperçu complet des conditions du marché, aidant les traders à identifier des opportunités de trading potentielles à travers divers intervalles de temps. Ce indicateur offre des avantages significatifs en présentant des signaux cruciaux dans
Setup 9.1 strategy created by the North American trader Larry Williams . SIMPLE setup, effective, with a good level of accuracy and excellent return. Attention : The Demo version only works on the tester, if you are interested in running it in real time, please contact me and I will provide another version. Buy Signal: Exponential moving average of 9 (MME9) is falling, wait it to TURN UP (in closed candle). Place a buy stop order 1 tick above the HIGH of the candle that caused the turn to occur.
ATrend
Zaha Feiz
4.63 (19)
ATREND ATREND : Comment ça fonctionne et comment l'utiliser Comment ça fonctionne L'indicateur "ATREND" pour la plateforme MT5 est conçu pour fournir aux traders des signaux d'achat et de vente robustes en utilisant une combinaison de méthodologies d'analyse technique. Cet indicateur s'appuie principalement sur la plage vraie moyenne (ATR) pour mesurer la volatilité, ainsi que sur des algorithmes de détection de tendance pour identifier les mouvements potentiels du marché. Laissez un message ap
Easy Buy Sell Pro
Israr Hussain Shah
This indicator is best used for   Trend Riding . It ensures that you only enter trades when both the short-term momentum and the medium-term trend are aligned, significantly reducing the risk of being caught in a trend reversal or a flat market. Neutral Zone Protection:   When the price is stuck between (a "mixed" or sideways market), the indicator   hides all signals . This keeps your chart clean and prevents trading in choppy, undecided conditions. Real-Time Dashboard:   A text display in the
Overview Harmonic Patterns MT5 is a technical analysis indicator designed for the MetaTrader 5 platform. It identifies and displays harmonic price patterns, such as Butterfly, Cypher, Crab, Bat, Shark, and Gartley, in both bullish and bearish directions. The indicator calculates key price levels, including entry, stop loss, and three take-profit levels, to assist traders in analyzing market movements. Visual elements and customizable alerts enhance usability on the chart. Features Detects six ha
Weis Wave Scouter
Jean Carlos Martins Roso
Découvrez la puissance de l'analyse avancée du volume avec le Weis Wave Scouter, un indicateur révolutionnaire pour MetaTrader 5 combinant les principes éprouvés de la méthode Wyckoff et de l'analyse VSA (Volume Spread Analysis). Conçu pour les traders recherchant précision et profondeur, cet indicateur fournit une lecture tactique du marché via l'analyse des vagues de volume cumulatif, aidant à identifier les points clés de retournement et de continuation de tendance. Le Weis Wave Scouter propo
Noize Absorption Index - is the manual trading system that measures the difference of pressure between bears forces and bulls forces. Green line - is a noize free index that showing curent situation. Zero value of index shows totally choppy/flat market.Values above zero level shows how powerfull bullish wave is and values below zero measures bearish forces.Up arrow appears on bearish market when it's ready to reverse, dn arrow appears on weak bullish market, as a result of reverse expectation.
TRI Visualizer
Yoshimi Mon 三 Ura
TRI Visualizer MT5 – Thermodynamic Market Analysis Overview The TRI (Thermal Range Indicator) Visualizer Enhanced is a rare market analysis indicator that goes beyond conventional technical analysis, applying principles of thermodynamics from physics. It interprets market price fluctuations as “thermodynamic energy,” enabling the highly accurate detection of subtle market changes that are often overlooked. Innovative Mechanisms 1. Dual Calculation Engines Classic TRI Mode Formula: |Close
This indicator builds upon the previously posted Nadaraya-Watson smoothers. Here we have created an envelope indicator based on Kernel Smoothing with integrated alerts from crosses between the price and envelope extremities. Unlike the Nadaraya-Watson estimator, this indicator follows a contrarian methodology. Please note that by default this indicator can be subject to repainting. Users can use a non-repainting smoothing method available from the settings. The triangle labels are designed so
DoctorEdge V-LINE (Pump it & Dump it) Strategy Pro Confirms trend direction using smart momentum logic and key price behavior How It Works DoctorEdge V-LINE is a smart visual indicator designed to detect trend impulses and confirm their strength based on how price reacts around certain dynamic zones. Buy Trend: When price reaches level -20 , the line turns green , signaling a potential buy . If price breaks above level 0 and the line stays green, the uptrend is confirmed . If price doe
Les acheteurs de ce produit ont également acheté
Trend Sniper X
Sarvarbek Abduvoxobov
4.86 (43)
Trend Sniper X est un indicateur de suivi de tendance multi-unités de temps pour MetaTrader 5 qui aide les traders à identifier la direction de la tendance et les points d'inversion potentiels avec clarté et précision. pour MT4: https://www.mql5.com/en/market/product/193245 Informations sur le prix : Le prix actuel est un prix promotionnel et est susceptible de changer lors des prochaines mises à jour et nouvelles fonctionnalités. Offre bonus : Pour obtenir GRATUITEMENT l'Auto-Trade Assistant E
Smart Trend Trading System — MetaTrader 5 Après votre achat, envoyez-moi un message sur MQL5 pour recevoir GRATUITEMENT Smart Universal Expert Advisor, ainsi que le cours en ligne, le manuel PDF et l’accès au groupe privé. STTS réunit la direction de la tendance, les signaux d’entrée et de sortie, les zones de retournement et les niveaux de prix importants directement sur votre graphique. Suivez le système manuellement ou connectez un EA compatible distinct pour une exécution automatique selon l
Un nouveau Roi en ville - Indicateur + Gestion des ordres (TP1 + TP2 + TP3) + Envoi optionnel de signaux Telegram INCLUS (GRATUIT) (SYSTÈME COMPLET DE TRADING et DE SIGNAUX) Notre meilleur EA pour l’Or : Gold Slayer Cet indicateur inclut une stratégie avancée, un système de trading avec gestion des ordres personnalisable ainsi qu’un système de retour à la moyenne combinant des extensions d’enveloppes, soutenu par plusieurs filtres intelligents de confirmation comme le RSI afin de détecter des en
SuperScalp Pro
Van Minh Nguyen
4.54 (37)
SuperScalp Pro - Professional Multi-Layer Confluence Scalping System SuperScalp Pro est un indicateur de scalping avancé qui améliore le Supertrend classique grâce à plusieurs filtres intelligents de confirmation. Il vous aide à identifier des opportunités de trading Buy/Sell présentant une probabilité de réussite plus élevée, tout en réduisant considérablement les faux signaux. Des flèches Buy et Sell bien visibles apparaissent directement sur le graphique, avec des niveaux de Stop Loss et de T
En 2019, j'ai montré au monde entier ce dont cet indicateur est capable. J'ai tradé ses signaux manuellement, sur un compte réel, en toute transparence — le compte était suivi sur Myfxbook, et je relatais cette expérience en détail sur Facebook. Résultat : en quatre mois, 10 000 dollars sont devenus 941 411. Le risque était délibérément extrême — le drawdown allait jusqu'à 54 %, car dans notre métier, le profit et le risque vont toujours de pair. La capture d'écran de Myfxbook est la première im
ULTRA est un indicateur technique « tout-en-un » : il analyse le marché de manière autonome, génère des signaux de trading, affiche les niveaux permettant de définir des ordres stop-loss et suggère le moment opportun pour clôturer les positions afin de sécuriser les bénéfices ou de minimiser les pertes. En d'autres termes, peu importe que vous ne sachiez pas analyser le marché, déterminer les niveaux (où placer votre stop-loss) ou que vous ayez du mal à gérer votre capital. ULTRA s'occupera de t
M1 Sniper MT5
Oleg Rodin
5 (7)
M1 SNIPER   est un système d'indicateurs de trading facile à utiliser. Il s'agit d'un indicateur à flèche conçu pour l'unité de temps M1. Cet indicateur peut être utilisé seul pour le scalping sur l'unité de temps M1 ou intégré à votre système de trading existant. Bien que conçu spécifiquement pour le trading sur l'unité de temps M1, ce système peut également être utilisé avec d'autres unités de temps. Initialement, j'avais conçu cette méthode pour le trading du XAUUSD et du BTCUSD. Cependant, j
Gann Made Easy   est un système de trading Forex professionnel et facile à utiliser qui est basé sur les meilleurs principes de trading en utilisant la théorie de mr. WD Gann. L'indicateur fournit des signaux d'ACHAT et de VENTE précis, y compris les niveaux Stop Loss et Take Profit. Vous pouvez échanger même en déplacement en utilisant les notifications PUSH. VEUILLEZ ME CONTACTER APRÈS L'ACHAT POUR RECEVOIR GRATUITEMENT DES INSTRUCTIONS DE TRADING ET D'EXCELLENTS INDICATEURS SUPPLÉMENTAIRES! V
Auto Optimized SpeedAngle est un système de vectorisation du momentum de niveau institutionnel qui élimine l'ajustement de courbe ( curve-fitting ) grâce à une optimisation continue par avancement ( Walk-Forward Optimization , WFO). Plutôt que de s'appuyer sur des entrées statiques qui se dégradent lorsque les régimes de marché changent, l'indicateur recalibre dynamiquement ses paramètres en utilisant une validation hors échantillon ( Out-of-Sample , OOS), garantissant ainsi que les signaux affi
Boba Analysis Suite
Trade Ready Solutions LLC
5 (2)
Boba Analysis Suite Boba Analysis Suite est un indicateur d’analyse pour MetaTrader 5. Il réunit la structure du marché, les zones de prix pertinentes et le contexte général du marché dans une même vue graphique. Développé à partir de l’expérience pratique d’un trader et formateur en trading, il accompagne une démarche d’analyse structurée : évaluer la direction du marché, identifier les niveaux importants et analyser plusieurs unités de temps conjointement. Une analyse en contexte La significat
Indicateur de force et de momentum multi-devises MT5 Dynamic Forex28 Navigator est l'évolution de nos indicateurs populaires de longue date et réunit la puissance de trois outils en un : Advanced Currency Strength28 Indicator (700 avis) Advanced Currency IMPULSE with ALERT (530 avis) CS28 Combo Signals (bonus actuel) Les deux indicateurs précédents totalisent plus de 1 200 avis sur le MQL5 Market et font partie des outils incontournables de la communauté MT4 depuis 2016. Dynamic Forex28 Navigato
Prochaine mise à jour — Version 2.52 bientôt disponible ! [NOUVEAU] Préparez-vous à découvrir 4 nouvelles fonctionnalités majeures conçues pour améliorer votre analyse du marché et votre flux de travail de trading Nous faisons passer l’analyse du marché au niveau supérieur avec 4 nouvelles fonctionnalités conçues pour répondre à vos besoins en trading. Découvrez : 1. TRADE OVERVIEW DASHBOARD 2. CONFLUENCE AT ZONE 3. STRONG & WEAK HIGH/LOW 4. OTE 1. TRADE OVERVIEW DASHBOARD Un tableau de bord qu
FiboSniper Pro
Van Minh Nguyen
5 (4)
FiboSniper Pro – Multi-Filter Fibonacci System with Auto SL/TP and Control Panel FiboSniper Pro est un indicateur technique qui combine des Fibonacci Envelopes dynamiques avec plusieurs filtres de confirmation afin de générer des signaux Buy et Sell sélectionnés. Les niveaux de Fibonacci sont calculés à partir de Moving Average et ATR, puis filtrés par ADX, EMA, RSI, ATR, Volume, Time et la structure des bougies. L’indicateur affiche directement sur le graphique les niveaux automatiques de Stop
Zain Gold Scalping
Ahmed Gamal Abdel Nasser Mohamed
A complete price-action analysis tool built around dual independent entry logic, each confirmed against a volatility band, combined with a configurable set of nine optional confirmation filters that let you shape exactly how conservative or aggressive the tool's signals behave. Core Strategy Two independent entry setups, each triggering only when price moves outside a dynamic volatility band — giving two distinct ways to spot potential reversal points, which can be used together or separately.
Power Candles MT5
Daniel Stein
4.58 (12)
Power Candles V3 - Indicateur de force à optimisation automatique Power Candles V3 transforme la force des devises et des instruments en un plan de trading exploitable sur chaque graphique auquel il est associé. Au lieu de se contenter de colorer les bougies, il effectue une optimisation automatique en temps réel en arrière-plan et vous fournit les meilleurs niveaux de Stop Loss, Take Profit et seuils de signal pour le symbole que vous avez sous les yeux. Un simple clic suffit pour l'adopter en
Quantum TrendPulse
Bogdan Ion Puscasu
5 (26)
Présentation de   Quantum TrendPulse   , l'outil de trading ultime qui combine la puissance de   SuperTrend   ,   RSI   et   Stochastic   dans un seul indicateur complet pour maximiser votre potentiel de trading. Conçu pour les traders qui recherchent précision et efficacité, cet indicateur vous aide à identifier les tendances du marché, les changements de dynamique et les points d'entrée et de sortie optimaux en toute confiance. Caractéristiques principales : Intégration SuperTrend :   suivez f
Adaptive Price Action Engine Achetez un indicateur, obtenez l'EA gratuitement Analyse auto-optimisée des tendances et des figures de chandeliers Multi-Timeframe Les marchés évoluent constamment, et tous les modèles de Price Action n’ont pas la même valeur dans toutes les conditions de marché. Adaptive Price Action Engine a été conçu pour s’adapter aux changements du marché en combinant structure de tendance, analyse Multi-Timeframe, figures de chandeliers et optimisation statistique au sein d’un
Trend Catcher ind mt5
Ramil Minniakhmetov
5 (18)
INDICATEUR DE DÉTECTEUR DE TENDANCE L'indicateur de détecteur de tendance analyse les mouvements de prix du marché grâce à une combinaison d'indicateurs d'analyse de tendance adaptatifs, propriétaires et personnalisés. Il identifie la véritable direction du marché en filtrant les fluctuations à court terme et en se concentrant sur la force de la dynamique sous-jacente, l'expansion de la volatilité et la structure des prix. Il utilise également une combinaison d'indicateurs personnalisés de lis
Superhero
Ihor Otkydach
5 (3)
L'indicateur SUPERHERO est un système de trading multidevises conçu selon un principe « tout compris ». Cet indicateur analyse le marché de manière autonome et fournit des signaux indiquant quand ouvrir et clôturer des positions. Il utilise des ordres Stop Loss et Take Profit. Le rapport R:R est de 1:1. Ce système peut envoyer des notifications push sur votre smartphone, ce qui vous permet de passer des ordres « où que vous soyez », sans avoir à rester devant un ordinateur. C'est la solution idé
Neuro Poseidon MT5
Daria Rezueva
4.75 (52)
Neuro Poseidon is a new indicator by Daria Rezueva. It combines precise trading signals with adaptive TP/SL levels - creating best possible trades as a result! Message me and get  Neuro Poseidon Assistant  as a gift to automize your trading process! What makes it stand out? 1. Proven profitability on all assets and timeframes 2. Only confirmed BUY and SELL signals present on the chart 3. Adaptive TP & SL levels generated by the software for each trade 4. Easy to understand - suitable for al
Azimuth Pro
Ottaviano De Cicco
5 (7)
Azimuth Pro V2: Synthetic Fractal Structure and Confirmed Entries for MT5 Overview Azimuth Pro is a multi-level swing structure indicator by Merkava Labs . Four nested swing layers, swing-anchored VWAP, ABC pattern detection, three-timeframe structural filtering, and closed-bar confirmed entries — one chart, one workflow from micro-swings to macro-cycles. This is not a blind signal product. It is a structure-first workflow for traders who care about location, context, and timing. Halloween P
Break and Retest Hunter is a powerful MetaTrader 5 indicator designed to automatically identify support and resistance levels, breakout structures, and potential retest opportunities in real time. Bonus Indicator: After purchasing Break and Retest Hunter , contact me to receive Trade Indicator Assistant EA completely free as a bonus utility. $65 for the next 10 copies . Next price is $120.  Combining adaptive market analysis, clear BUY/SELL signals, Fibonacci-based profit targets, and a premiu
OrderFlux – Indicateur Orderflow Footprint Chart, Volume Profile et Market Profile pour MetaTrader 5 OrderFlux est un indicateur de flux d’ordres et de footprint pour MetaTrader 5 qui se comprend intuitivement. Il ouvre chaque bougie pour montrer ce qui se passe à l’intérieur : le volume négocié à chaque niveau de prix, réparti entre les acheteurs agressifs et les vendeurs agressifs. À partir des ticks, il construit en temps réel un graphique Footprint complet intégrant le delta, les déséquilibr
CGE Trading Suite
Carl Gustav Johan Ekstrom
5 (3)
Institutional-Grade Analytics for MT5 The full analytical edge of a professional trading desk, built into your MT5 chart. A full guided tour walks you through every feature step by step. Standard retail platforms lack the depth required for professional market analysis. The CGE Trading Suite bridges this gap, transforming MetaTrader 5 into a comprehensive workspace. By integrating 18 proprietary modules into a single, unified chart interface, the suite eliminates fragmented analysis. It provide
Scalper Vault est un système de trading puissant et complet, conçu pour les traders en quête de régularité dans le cadre du trading intrajournalier. Cet indicateur de haute précision constitue un système de trading autonome et exhaustif, offrant des analyses de qualité institutionnelle, aussi bien pour le Forex que pour les options binaires. VEUILLEZ ME CONTACTER APRÈS VOTRE ACHAT POUR OBTENIR MES CONSEILS DE TRADING AINSI QU'UN EXCELLENT BONUS ! En éliminant les incertitudes et les analyses man
Divergence Bomber
Ihor Otkydach
4.89 (94)
Chaque acheteur de cet indicateur reçoit également gratuitement : L’outil exclusif « Bomber Utility », qui accompagne automatiquement chaque opération de trading, fixe les niveaux de Stop Loss et de Take Profit, et clôture les positions selon les règles de la stratégie Des fichiers de configuration (set files) pour adapter l’indicateur à différents actifs Des set files pour configurer le Bomber Utility selon différents modes : « Risque Minimum », « Risque Équilibré » et « Stratégie d’Attente »
FX Analysis is an all-in-one MT5 indicator dashboard that combines eight analytical tools in a single panel, helping traders identify high-probability setups without switching between charts or indicators. Designed for standard forex pairs on MetaTrader 5. Best results on M15 - H4 timeframes when all components are used together as part of the included workflow. Components Volatility Analyzer Displays historical average movement by hour and by day of the week. A real-time Pip Balance shows the
La meilleure solution pour tout trader débutant ou expert ! Cet indicateur est un outil de trading unique, de haute qualité et abordable, car nous avons intégré un certain nombre de fonctionnalités propriétaires et une nouvelle formule. Avec UN SEUL graphique, vous lisez la force des devises pour 28 paires Forex ! Imaginez comment votre trading va s'améliorer parce que vous êtes capable de repérer le point de déclenchement exact d'une nouvelle tendance ou d'une opportunité de scalping ? Manuel d
Crystal Heikin Ashi Signals
Muhammad Jawad Shabir
5 (5)
Crystal Heikin Ashi Signals—Professional Trend & Signal Detection Indicator Advanced Heikin Ashi Visualization with Intelligent Signal System for Manual & Automated Trading Final Price: $149 ---------> Price goes up $10 after every 10 sales . Limited slots available — act fast . Overview User Guide PDF Crystal Heikin Ashi Signals is a professional-grade MetaTrader 5 indicator that combines pure Heikin Ashi candle visualization with an advanced momentum-shift detection system. Designed for both m
Bonjour à tous les traders ! De nombreux investisseurs individuels utilisent des scripts web lents. Une approche systématique est essentielle pour un trading rentable. L'indicateur Astro AI n'est pas un simple affichage sur un graphique. Il s'agit d'un réseau neuronal sophistiqué composé de deux agents fonctionnant directement dans le terminal. Détails techniques du système : 1. Agent 1 : Analyste (Réseau neuronal graphique – GNN) Le marché n'est pas constitué de barres de prix individuelle
Plus de l'auteur
Master Institutional AI
Matheus Rodrigues Satriano
️ INSTITUTIONAL WARNING: This is not a retail "magic arrows" system. The Master Institutional AI Ecosystem is a bank-level quantitative treasury infrastructure for MetaTrader 5. It combines statistical Order Flow processing, stochastic regimes, and neural intelligence to identify where major players (HFTs and Treasuries) are injecting real liquidity. If you are looking for institutional precision instead of lagging indicators, this is your definitive upgrade. Our engine does not "guess" the ma
Confluencia Dimensional MTF
Matheus Rodrigues Satriano
Confluencia Dimensional MTF is a chart indicator that combines three classic tools (EMA crossover state, RSI and MACD) on three timeframes at the same time: M15, H1 and H4. Each timeframe receives a score between -1 and +1, and the indicator draws a buy arrow, a sell arrow or an exit mark only when the scores agree. How it works For every active timeframe the score is a weighted sum of: trend (fast EMA above or below slow EMA), normalized RSI distance from 50, and the sign of the MACD main line
Institutional Volume Anomaly Detector measures how unusual the volume of each bar is compared with the recent past. It calculates a Z-score (number of standard deviations from the rolling mean) and shows the absolute value as a color histogram in a separate window. Bars above your threshold are highlighted and can be marked on the main chart. The indicator uses only data provided by your broker's terminal; it does not access any external or off-exchange data source. How it works For every closed
Deep State Regime Classifier
Matheus Rodrigues Satriano
Deep State Regime Classifier paints the candles of your chart according to the market regime detected on each closed bar. It is a deterministic, rule-based classifier built on well-known statistics: a rescaled-range estimate of the Hurst exponent, a fractal dimension index (FDI), the standard deviation of price changes and momentum. The same data always produces the same colors. How it works For each closed bar the indicator looks back over a configurable window (default 144 bars) and calculates
Visual Strategy Terminal
Matheus Rodrigues Satriano
Visual Strategy Terminal is an indicator that runs a quick virtual backtest of a simple rule set on the chart's history and draws the resulting equity curve in a separate window. A panel shows the number of trades, win rate, profit factor, net result and maximum drawdown. It is a tool for exploring filter combinations quickly; it does not place orders. How it works On each closed bar of the tested range, up to three filters vote: RSI: below 35 votes long, above 65 votes short MACD (12/26 with a
Institutional Architect Heatmap finds Fair Value Gaps (three-candle price imbalances) on closed bars and draws them as rectangles on the chart. Each zone is colored by how much activity the terminal's tick history shows inside the zone, so you can quickly see which gaps attracted more trading. A panel lists up to 10 symbols with an activity score, and clicking a symbol switches the chart to it. How it works A bullish gap is detected when the high of a candle is below the low of the candle two ba
OrderFlow MicroStructure Pro
Matheus Rodrigues Satriano
OrderFlow MicroStructure Pro brings several order-flow views to one chart: a daily VWAP with standard-deviation bands, buy/sell delta of each closed bar, cumulative delta, a bid x ask footprint of the last closed bar and a volume profile over a range you can move with the mouse. It is designed for exchange instruments with trade data (for example B3 futures and stocks) and also runs on Forex with an approximation described below. How it works VWAP: typical price weighted by tick volume, reset on
Mestre Unificado
Matheus Rodrigues Satriano
Mestre Unificado is a multi-timeframe confluence indicator with a built-in dashboard. It scores three standard tools (EMA trend, RSI and MACD) on M15, H1 and H4, draws buy, sell and exit arrows on the chart when the timeframes agree, and displays the score of each timeframe in a canvas panel. Everything is contained in a single file; no external indicators are required. How it works Each active timeframe receives a score from -1 to +1: a weighted sum of the EMA trend direction (fast above or bel
Mestre Neural Signal
Matheus Rodrigues Satriano
Mestre Neural Signal is a separate-window oscillator. For every closed bar it builds eight normalized features from standard indicators and price data and passes them to a compact neural network model in ONNX format that is embedded inside the indicator file. The model output, limited to the range -1 to +1, is plotted as a line. No external files or downloads are needed. The forming bar is left empty, so plotted values do not repaint. How it works Features (each clipped to -1..+1) 1. Close minus
Nexus Trade Terminal
Matheus Rodrigues Satriano
Nexus Trade Terminal is a utility Expert Advisor that combines market context and manual execution on one panel. On every closed bar it updates three readings and offers buttons to send orders. Panel execution is disabled until you allow it in the inputs. How it works Regime: Hurst exponent and fractal dimension over the lookback window, plus momentum and volatility, classify the market as trend, mean reversion, chaotic or range/accumulation, with a heuristic confidence value. Volume and gap mon
Quantum Stat Arb Engine
Matheus Rodrigues Satriano
Quantum Stat-Arb Engine is an Expert Advisor for pairs trading. It monitors the price ratio between two symbols (by default the chart symbol and GBPUSD), opens an opposite-direction position on each symbol when the ratio moves far from its average, and closes both when the ratio returns toward the mean. How it works On each new closed bar of the analysis timeframe, the ratio A/B is compared with its mean and standard deviation over the lookback window to obtain a Z-score. The correlation of bar-
Aegis Order and Risk Manager
Matheus Rodrigues Satriano
Aegis Order and Risk Manager is a utility Expert Advisor for traders who open positions themselves. A two-tab panel provides one-click buy and sell orders, and the EA manages the positions of the chart symbol with a fractal trailing stop, an optional basket profit target and an optional rescue hedge. How it works Trade tab: set Risk % and volume with the +/- buttons, then click BUY or SELL. With panel risk sizing on (default), the volume is calculated from Risk % of the balance over the default
Filtrer:
Aucun avis
Répondre à l'avis