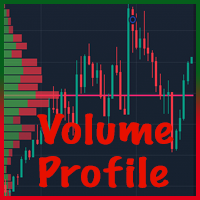
Manual Volume Profile MS

  • Göstergeler
  • Mariusz Sedlak
    Mariusz Sedlak
    I am Mariusz Sedlak, based in Poland, where I lead Selenita as its President. My work combines strategic leadership with a deep passion for financial markets and algorithmic trading. I specialize in developing custom indicators for MetaTrader 5 — tools that turn raw market data into clear
  • Sürüm: 1.0
  • Etkinleştirmeler: 5

Ręczny profil wolumenu MS pokazuje , gdzie faktycznie handlowano wolumenem. Rysuje dzisiejszy profil sesji na żywo i pozwala umieścić do 10 niezależnych zakresów profili woluminów w dowolnym miejscu wykresu za pomocą dwóch kliknięć myszką. Każdy profil pokazuje POC, VAH, VAL i obszar wartości.

KLUCZOWE CECHY

  • Profil dzienny – dzisiejszy profil wolumenu, narysowany po prawej stronie bieżącego paska lub nad paskami dnia, aktualizowany na żywo.
  • Zakresy ręczne PV 1 – PV 10 – kliknij przycisk PV, kliknij początek i koniec zakresu, a profil zostanie natychmiast obliczony. Przenieś lub zmień rozmiar pola – profil przelicza automatycznie.
  • POC, VAH, VAL i obszar wartości dla każdego profilu, z opcjonalnymi etykietami cenowymi.
  • Poziomy rozszerzone – POC (i opcjonalnie VAH/VAL) każdego zakresu można rozszerzyć w prawo jako poziomy odniesienia.
  • Wolumen rzeczywisty lub tick – wolumen rzeczywisty jest używany, gdy dostarcza go Twój broker, z automatycznym powrotem do wolumenu tick. Linia stanu na wykresie pokazuje dokładnie, który wolumin jest używany.
  • Głośność z innego symbolu – np. narysuj wykres kontraktu CFD i zbuduj profil na podstawie kontraktu futures dostępnego u tego samego brokera. Oblicza się przesunięcie ceny pomiędzy symbolami automatycznie lub ustawione ręcznie.
  • Dokładna dystrybucja – objętość jest dystrybuowana przy użyciu danych M1 (konfigurowalnych), niezależnie od przedziału czasowego wykresu.
  • Przyciągnij do przedziału cenowego – przyciągnij górę i dół do górnego/dolnego wybranego paska lub ustaw wolny przedział cenowy tak, aby liczył tylko głośność w środku.
  • Pamięć – pozycje wszystkich zakresów są zachowywane po zmianie przedziału czasowego i ponownym uruchomieniu terminala.
  • Szybkie usuwanie – usuń wybrane zakresy (np. „2” lub „1,3”) lub wszystkie („0”) za pomocą jednego przycisku.
  • W pełni konfigurowalne kolory, nieprzezroczystość, wysokość wiersza, powierzchnia wartości %, pozycja panelu.

SZYBKI START

  1. Przymocuj wskaźnik do wykresu, na przykład M5. Dzisiejszy profil znajduje się po prawej stronie obecnego paska.
  2. Kliknij PV 1 w panelu przycisków (prawy górny róg wykresu).
  3. Kliknij na wykres, na którym powinien rozpocząć się zakres, przesuń mysz – prostokąt podąża za kursorem – i kliknij miejsce, w którym powinien zakończyć się zakres.
  4. Profil jest obliczany natychmiast. POC, VAH i VAL są oznaczone po prawej stronie zakresu.
  5. Przeciągnij prostokąt lub jego rogi, aby dostosować zakres. Profil jest przeliczany w locie.
  6. Kliknij ponownie PV 1, aby ukryć zasięg. Kliknij go jeszcze raz, aby go przywrócić.

PANEL STEROWANIA

  • Dzień – pokazuje lub ukrywa dzisiejszy profil. Kolorowy = włączony, szary = wyłączony. Państwo jest pamiętane.
  • PV n (kolorowy) – pokazano zakres. Kliknij, aby go ukryć; jego pozycja jest zapamiętana.
  • PV n (złoto) – czeka na kliknięcia na wykresie. Kliknij przycisk ponownie lub naciśnij Esc , aby anulować.
  • PV n (szary) – kliknij, aby przywrócić ukryty zakres lub umieścić nowy.
  • Pole zakresu –, które zakresy usuwa przycisk Usuń: 0 = wszystkie (także „wszystkie" lub „*"), 2 = tylko PV 2, 1,3 lub 1 3 = PV 1 i PV 3.
  • Delete – usuwa zakresy wprowadzone w polu z wykresu i z pamięci.
  • Linia stanu (pod przyciskami) – pokazuje głośność faktycznie użytą dla profili.

PROFIL DZIENNY

Profil dzienny obejmuje bieżący dzień handlowy, od otwarcia dzisiejszego paska D1 (czas serwera brokera) do chwili obecnej. Odświeża się co 2 sekundy i na każdym nowym pasku.

  • Po prawej stronie bieżącego paska (domyślnie) – profil jest rysowany w wolnej przestrzeni po prawej stronie ostatniej świecy.
  • Od początku dnia – profil jest rysowany na świecach dnia, począwszy od otwartej sesji.

ZAKRESY RĘCZNE

  • Umieszczanie – kliknij szary przycisk PV, a następnie kliknij początek i koniec zakresu w głównym oknie wykresu. Jeśli oba kliknięcia spadną na ten sam pasek, zakres ma szerokość 5 pasków.
  • Regulacja – każdy zakres jest standardowym prostokątem MetaTrader. Przeciągnij go lub pociągnij za rogi; profil przelicza się i nowa pozycja jest zapisywana. Aby wybrać niewybrany zakres, kliknij dwukrotnie jego obramowanie.
  • Przyciągnij, aby wycenić ON (domyślnie) – góra i dół zakresu przytrzasną się do najwyższego maksimum i najniższego minimum. Ustawiasz tylko przedział czasowy.
  • Snap to price OFF – swobodnie ustawiasz przedział cenowy i liczony jest tylko wolumen obrotu wewnątrz przedziału. Przydatne do wyizolowania jednego obszaru większego ruchu.
  • Asortymenty na żywo – jeśli prawa krawędź asortymentu znajduje się na bieżącym pasku lub poza nim, asortyment jest aktualizowany w miarę pojawiania się nowych cen.
  • Ukrywanie i przywracanie – kliknij PV n, aby ukryć zakres. Kliknij go ponownie: jeśli zapamiętana pozycja jest widoczna na ekranie, zakres powraca; w przeciwnym razie umieszczasz nowy.
  • Klawisz Delete – wybranie prostokąta i naciśnięcie Delete wyłącza zakres; jego ostatnia pozycja pozostaje w pamięci.
  • Pamięć – pozycje, które zakresy są włączone i stan przycisku Dzień są przechowywane na wykresie. Przeżywają zmiany ram czasowych i ponowne uruchomienie terminala. Usunięcie wskaźnika z wykresu lub zamknięcie wykresu ich oczyszcza.

CZYTANIE PROFILU

  • Wiersze histogramu – każdy wiersz to jeden poziom cen; jego długość jest proporcjonalna do wolumenu obrotu w danym okresie profilu.
  • POC (Punkt Kontroli) – cena o największym wolumenie. Narysowane złotem, grubą linią i etykietą.
  • Obszar wartości – wiersze wokół POC zawierające wybrany udział w całkowitym wolumenie (domyślnie 70%). Narysowane jaśniejszym kolorem.
  • VAH / VAL – górna i dolna granica Obszaru Wartości, narysowana liniami przerywanymi.
  • Rozszerzone linie – POC każdego zakresu może być kontynuowany do prawej krawędzi wykresu (domyślnie włączone); VAH i VAL również mogą być rozszerzone.

Typowe zastosowania: porównaj dzisiejszy obszar wartości z poprzednią sesją, zaznacz strukturę wolumenu odcinka trendu, konsolidacji lub ruchu informacyjnego i użyj rozszerzonych linii POC z poprzednich zakresów jako odniesienia poziomy.

DANE DOTYCZĄCE OBJĘTOŚCI

  • Rzeczywisty wolumen to wolumen wymiany (kontrakty terminowe, akcje), dostępny, jeśli zapewnia go Twój broker. Wolumen ticków to liczba zmian cen; dla forex i większości kontraktów CFD jest to jedyny wolumen dostępny.
  • Przy ty pie głośności = Objętość rzeczywista (domyślna) każdy pasek używa swojej objętości rzeczywistej, gdy jest obecny, i objętości znacznika w przeciwnym razie.
  • Wolumen z innego symbolu – jeśli Twój broker oferuje zarówno kontrakt CFD, jak i odpowiadający mu kontrakt futures o rzeczywistym wolumenie, zachowaj wykres CFD i wprowadź nazwę symbolu futures (dokładnie jako w Market Watch, łącznie z dowolnym sufiksem) w Take volume z innego symbolu .
  • Przesunięcie ceny – Automatycznie mierzy różnicę cen między obydwoma symbolami na końcu zakresu; Ręcznie wykorzystuje Twoją wartość; Nie ma przesunięcia dla symboli podawanych w tym samym miejscu poziom cen.

Wiadomości z linii statusu:

  • Objętość: rzeczywista – wszystkie paski profilu mają rzeczywistą objętość.
  • Objętość: rzeczywista (x% słupków, zaznaczenie reszty) – na części słupków brakuje objętości rzeczywistej.
  • Wolumen: TICK - SYMBOL nie ma rzeczywistego wolumenu u tego brokera (pomarańczowy) – używany jest wolumen tick.
  • Objętość: tick – w danych wejściowych wybrano objętość tick.
  • | z SYMBOLU, offset +x – głośność jest pobierana z innego symbolu.
  • | symbol nie został znaleziony: NAZWA – symbol woluminu nie istnieje u tego brokera; używany jest symbol wykresu.

PARAMETRY WEJŚCIOWE

  • Prefiks nazwy obiektu – zmień go tylko po to, aby uruchomić dwie kopie na tym samym wykresie.
  • Przedział czasowy źródła – dane użyte do dystrybucji wolumenu (domyślnie M1).
  • Typ głośności – Rzeczywista głośność (powraca do ticku) / Głośność ticku.
  • Weź wolumen z innego symbolu – nazwa symbolu u tego samego brokera, np. kontrakt terminowy (pusty = symbol wykresu).
  • Price offset of the volume symbol – Auto / Manual / No offset, plus the manual offset value.
  • Show which volume is being used – status line on/off.
  • Row height in points – fixed row height, or 0 = automatic; AutoRows – a larger value gives thinner rows.
  • Value Area % – default 70.
  • POC color, VAH/VAL line color and style, labels, price in labels, label font size.
  • Daily profile – on/off at start, position, offset from the current bar, width, colors, opacity.
  • Manual ranges – number of PV buttons (1–10), snap to price, histogram width, opacity, POC and VAH/VAL extension, 5 range colors.
  • Panel – pokaż/ukryj, rozmiar przycisku, marginesy, kolory. Po ukryciu panelu istniejące zakresy pozostają, ale nie można umieścić nowych.
  • Odświeżanie na żywo – interwał odświeżania profili na żywo w sekundach (domyślnie 2).

TESTER STRATEGII

Na wykresie Strategy Tester przyciski nie są interaktywne (ograniczenie MetaTrader), więc zakres PV 1 jest automatycznie umieszczany w poprzednim dniu handlowym w celu demonstracji. Dzisiejszy profil działa jak na wykres na żywo.

ROZWIĄZYWANIE PROBLEMÓW

  • Nic nie jest rysowane zaraz po podłączeniu – terminal pobiera historię M1/D1; wskaźnik ponawia próbę automatycznie co kilka sekund.
  • Zakres daleko wstecz w historii nie pokazuje żadnego profilu – przewiń wykres do tego okresu raz, aby terminal załadował historię; w razie potrzeby zwiększ „Maksymalne paski na wykresie” w Narzędzia → Opcje → Wykresy.
  • Linia statusu pokazuje TICK na pomarańczowo – Twój broker nie podaje rzeczywistego wolumenu dla tego symbolu; jest to normalne w przypadku forex i kontraktów CFD.
  • Profil z innego symbolu jest przesunięty – użyj przesunięcia ręcznego (np. po przeniesieniu kontraktów terminowych).
  • Kliknięcie przycisku PV rozpoczyna umieszczanie zamiast przywracania – zapamiętana pozycja jest poza ekranem; przewiń do niej i kliknij ponownie lub umieść nowy zakres.
  • Zakresy utracone po ponownym dodaniu wskaźnika – usunięcie wskaźnika celowo czyści jego zakresy; zmiana przedziału czasowego lub ponowne uruchomienie terminala pozwala je zachować.

NOTATKI

  • Dostępna jest instrukcja obsługi w formacie PDF (angielskim i polskim) – wyślij mi prywatną wiadomość.
  • Wskaźnik jest narzędziem analitycznym. Nie otwiera, nie modyfikuje ani nie zamyka transakcji i nie daje sygnałów handlowych. Handel wiąże się z ryzykiem.

Önerilen ürünler
The "MR Volume Profile 5" indicator is a charting tool that displays trading volume at different price levels rather than time intervals. A key concept in volume profile is the point of control (POC)—the price level with the highest volume traded during the session or time range. While tools like VWAP or OBV provide volume trends, the "MR Volume Profile 5" indicator offers granular detail about where the most market activity occurs at specific price levels. This makes it a more precise tool for
Master Edition, piyasa yapısını hacim ve para akışı merceğinden görselleştirmek için tasarlanmış profesyonel kalitede bir analiz aracıdır. Standart hacim göstergelerinin aksine, bu araç doğrudan grafiğinizde bir Günlük Hacim Profili görüntüleyerek, fiyat keşfinin tam olarak nerede gerçekleştiğini ve "akıllı paranın" nerede konumlandığını görmenizi sağlar. Bu Master Edition, netlik ve hız için tasarlanmıştır ve yüklendiğinde grafik düzeninizi anında güzelleştiren benzersiz bir Otomatik Tema Senkr
MT5 için uyarılar içeren Otomatik Sabit Aralık Hacim Profili Bu gösterge, fiyatın nerede daha fazla zaman harcadığını gösterir ve ticarette kullanılabilecek önemli seviyeleri vurgular. ve belirli bir ticaret seansının en önemli fiyat seviyelerini, değer alanını ve kontrol değerini özetleyerek zaman içindeki fiyat yoğunluğunu gösterebilir. Bu gösterge, M1 ile D1 arasındaki zaman dilimlerine eklenebilir ve günlük, haftalık, aylık ve hatta gün içi oturumlar için Piyasa Profilini gösterir. Daha d
Bitcoin Regime Matrix Bitcoin Regime Matrix is a closed-bar BTCUSD regime indicator for MetaTrader 5. It is designed for H1 and classifies the market as LONG, SHORT or NEUTRAL. Ekim 2026 güncelleme paketi: kurulum, varsayılanlar ve simülasyon karşılaştırması . MT5 Setup Hub . The indicator combines a slow exponential baseline with a slope filter, confirmed entry distance, exit hysteresis and realized-volatility measurement. Its dashboard keeps the active regime, recommended exposure, annualized
Market Structure, Liquidity and Price Action Analysis for MetaTrader 5 A chart can contain plenty of information and still leave a trader without a clear decision. A BOS label may appear, liquidity may be nearby, and an order block may remain active, yet the real challenge is understanding how those elements relate to one another. ICT Yoshi Pro organizes that process into a cleaner, more disciplined MetaTrader 5 workflow. What ICT Yoshi Pro Does ICT Yoshi Pro is a manual decision-support indicat
Live broadcast of the indicator on YouTube. Please click on the link below for more credibility. There are also videos of the indicator that you can watch. Note that the broadcast is late, do not rely on it. Only a review of the indicator is only a review of the indicator’s accuracy, which does not lose almost and the profit rate reaches 95%. I will work with great accuracy on the CRASH coin 1000 INDICES
Was: $249  Now: $99   Market Profile defines a number of day types that can help the trader to determine market behaviour. A key feature is the Value Area, representing the range of price action where 70% of trading took place. Understanding the Value Area can give traders valuable insight into market direction and establish the higher odds trade. It is an excellent addition to any system you may be using. Inspired by Jim Dalton’s book “Mind Over Markets”, this indicator is designed to suit the
GoldenX Entry MT5
VividMind Digital Solutions
5 (17)
GoldenX Entry, adaptif Smart Entry Trend algoritmasına, sinyal skorlaması sistemine, piyasa rejimi algılayıcısına ve volatilite filtresine sahip bir MT5 indikatörüdür. Her sinyal; hesaplanmış bir giriş seviyesi, üç adet Take-Profit seviyesi (TP1, TP2, TP3) ve bir Stop-Loss seviyesi içerir. Farklı piyasa koşullarına uyum sağlamak için tasarlanmış çok katmanlı analitik yapı üzerine kuruludur ve yerleşik optimizasyon aracı ile istatistik takip sistemini birleştirir. Risk-ödül (RR) metrikleri ve geç
Titan Z-Score Pro v3.2 Sürüm Notları: Kurumsal UI/UX Yeniden Tasarımı: Performans kokpitleri ve MTF matrisleri ana harita köşelerine taşındı, böylece tertemiz, dağınıklıktan arındırılmış bir alt pencere görünümü sağlandı. Canlı Kazanma Oranı ve Geri Dönüş Kokpiti: Ortalama geri dönüş başarı oranının ve kazanılan ortalama piplerin gerçek zamanlı takibi eklendi. Çok Zaman Dilimi Z-Puan Matrisi: Ana tabloya doğrudan görsel olarak 5 zaman dilimli (M5'ten D1'e) bir durum ızgarası entegre edildi. Yen
Fixed Volume Profile
Carlos Pascual Perez Maturano
This indicator, titled "Fixed Volume Profile.mq5", is a custom tool for MetaTrader 5 (MQL5) designed to calculate and display a Volume Profile over a user-defined fixed time range. The Volume Profile shows the distribution of trading volume at different price levels during a specific period, helping to identify areas of high activity (such as Points of Control or POCs) and volume-based support/resistance areas. Main Functionality: Interactive Range: The indicator creates two vertical lines on
FREE
Ugenesys AI MT5
Odaine Ramon Mcmillan
uGenesys AI - 90% Accurate Daytrading Indicator Introducing the ultimate forex trading indicator system, uGenesys AI, powered by cutting-edge AI technology and advanced analytical techniques, including Time-Series Analysis and Genetic Algorithms. Our AI-powered trading system leverages the power of time-series analysis to identify trends and patterns in historical price data, allowing traders to make informed predictions about future market movements. By analyzing vast amounts of data, our syst
Spike Blast Pro
Israr Hussain Shah
Here   our more valuable tools SMC Trend Trading   ,  Easy SMC Trading  ,  Institutional SMC Architect Volume Analysis Tools  ,  Volume flow Profile  ,  Market volume profile  , FVG with Volume  , Liquidity Heatmap Profile  ,  Volume Spread Analysis Spike Blaster Pro is a next-generation MT5 indicator designed specifically for synthetic markets. It works seamlessly on Boom Index and Weltrade Index , providing traders with sharp, reliable spike detection signals. What makes Spike Blaster Pro po
Here   our more valuable tools SMC Trend Trading   ,  Easy SMC Trading  ,  Institutional SMC Architect Volume Analysis Tools  ,  Volume flow Profile  ,  Market volume profile  , FVG with Volume  , Liquidity Heatmap Profile  ,  Volume Spread Analysis The    Liquidity Heatmap   is a sophisticated institutional trading tool designed to reveal where over-leveraged traders are trapped. By calculating estimated liquidation levels based on volume spikes and leverage, this indicator draws a dynamic "h
Intraday Session TPO: Precision Volume Profiling for Day Traders Stop trading blind during the most volatile hours of the day. Standard daily volume profiles blend everything together, masking the true areas of liquidity and institutional interest. The Intraday Session TPO is engineered specifically for session-to-session traders. It empowers you to isolate and profile specific time windows—like the London Open, the New York Killzone, or the Asian range—so you can see exactly where the volume is
Here   our more valuable tools SMC Trend Trading   ,  Easy SMC Trading  ,  Institutional SMC Architect Volume Analysis Tools  ,  Volume flow Profile  ,  Market volume profile  , FVG with Volume  , Liquidity Heatmap Profile  ,  Volume Spread Analysis Short Description: Stop overloading your charts with dozens of indicators.   Bollinger Fibo  Pro   is a sophisticated, all-in-one trading system for MetaTrader 5 that merges two legendary concepts into a single, powerful tool. It enhances standard
AURUM Volume At Price + Alerts Volume Profile with self-adjusting VAH, POC and VAL alerts. See where the volume is and get notified when price gets there. [Please leave a review if you find the indicator useful and how we can improve it further] AURUM Volume At Price + Alerts builds a live volume profile over your chosen lookback window and turns three key reference levels, Value Area High (VAH), Point of Control (POC) and Value Area Low (VAL), into automatic price alerts. There are no hardcoded
Hacim Profili Çok Modlu: Hacmi Göstergenizin Yöntemiyle Değil, Kendi Yönteminizle Analiz Edin. Çoğu Hacim Profili göstergesi, yatırımcıları önceden tanımlanmış analiz aralıklarıyla sınırlandırır. Ancak piyasa sabit şablonlar içinde hareket etmez, öyleyse analiziniz neden öyle olsun ki? Çok Modlu Hacim Profili, hacmin nerede, ne zaman ve nasıl analiz edileceğine karar verme konusunda size tam özgürlük sağlar. Piyasa yapısını inceliyor, işlem seanslarını profillendiriyor, daha yüksek zaman dilimli
QuantMatrix Probability AI Free QuantMatrix Probability AI Free is a technical indicator for MetaTrader 5 that combines several measurements of current market conditions into three numerical estimates. The indicator uses exponential moving averages, Relative Strength Index (RSI), Average True Range (ATR) and the current price position in its calculation. These measurements are combined into a normalized market score. The resulting information is displayed on the chart as: BUY percentage SELL p
FREE
Smart SMC FVG
Ekkasawat Pitichalermroch
SMC + Volume Profile + FVG: Indicator Guide Overview SMC + Volume Profile + FVG is an all-in-one indicator for MetaTrader 5. It combines three popular price-action tools on a single chart: Smart Money Concepts (SMC): market structure (swings, BOS, CHoCH) and Order Blocks Fair Value Gaps (FVG): price imbalances left behind by fast moves Volume Profile: where the most trading happened, shown as POC, Value Area High and Value Area Low Everything is drawn automatically. You can turn each part on or
Symbol: EURUSD Timeframe: 30 minutes (M30) For other symbols or timeframes, adjust the settings to match the market. Volume Profile POC Breakout builds a volume profile from recent candles, finds the Point of Control (POC) and marks clean breakouts of that level. Each breakout is shown as a complete trade plan with entry, stop loss and three take profit levels, filtered by the higher timeframe trend and rated by a quality score. The indicator does not open trades. It is a visual and analysis to
What if you could finally SEE where the market really wants to go? Most traders watch price. Pros watch VOLUME — where the money was actually traded. Volume Profile Fibo Confluence puts that reading right in front of you, in plain language, no jargon. WHAT YOU SEE ON YOUR CHART • The POC, the most-traded price: the market's natural magnet • The value area (VAH / VAL): the "house" where price spends its time • Automatic Fibonacci retracement + the golden pocket • Low-volume nodes
Gold Trend 5
Sergei Linskii
4 (3)
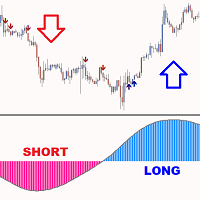
Altın Trend - bu iyi bir hisse senedi teknik göstergesidir. Gösterge algoritması, bir varlığın fiyat hareketini analiz eder ve oynaklığı ve potansiyel giriş bölgelerini yansıtır. En iyi gösterge sinyalleri: - SATIŞ için = kırmızı histogram + kırmızı KISA işaretçi + aynı yönde sarı sinyal oku + kırmızı trend yön oku. - AL için = mavi histogram + mavi UZUN işaretçi + aynı yönde aqua sinyal oku + mavi trend yön oku. Göstergenin faydaları: 1. Gösterge yüksek doğrulukta sinyaller üretir. 2. On
VMS Oscillator
Vincent Jose Proenca
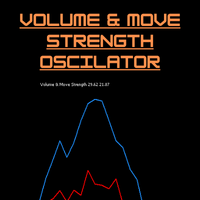
Volume & Move Strength (VMS) Indicator for MT5 The VMS Indicator displays the relationship between trading volume and price movement strength, helping traders assess how well market activity supports price action. How It Works: Measures tick volume as trading activity. Calculates move strength using a normalized True Range (%). Both values can be smoothed (default: 5) and optionally normalized (0–100) for consistency across markets. Plots two lines in a separate window: Blue (Volume) – trading a
FREE
ONNYX INDICATOR sürüm 1.14 MetaTrader 5 için onaylanmış ve yeniden boyanmayan sinyallere sahip arz-talep göstergesidir. Onaylı salınımları belirler, bölge genişliğini ATR ile ayarlar, kaliteyi yüzde olarak gösterir ve kapanmış mumlarda BUY/SELL okları çizer. TEMEL ÖZELLİKLER - Bölge içinde yüzde kalite puanı bulunan arz-talep bölgeleri. - Mum kapanışından sonra büyütülmüş BUY/SELL okları. - İsteğe bağlı EMA trend filtresi ve mum reddi onayı. - Trend, fiyat seviyeleri ve piyasa bağlamı paneli. -
THV Volume Profile MT5 Analyze Daily and Weekly Volume Profiles with POC, VAH, and VAL — directly on your MT5 chart. THV W-D-S Volume Profile MT5 is a technical analysis indicator designed to visualize volume distribution across different price levels for the previous day, the current day, and the previous week. The indicator helps traders identify important volume-based price levels, analyze market structure, and study potential support and resistance areas using Volume Profile analysis. With
VOLUME PROFILE SAF-XII MT5 için Profesyonel Market Profile Analizi (Grid tarzı yatırımcılar için rüya indikatör) VOLUME PROFILE (HACİM PROFİLİ) NEDİR? Volume Profile, hacmi zamana göre gösteren geleneksel hacim indikatörlerinin aksine, belirli fiyat seviyelerindeki işlem faaliyetlerini görüntüleyen profesyonel bir kurumsal araçtır. Seçtiğiniz pencere içinde işlemlerin NEREDE gerçekleştiğini ortaya çıkararak şunları belirlemenize yardımcı olur: ADİL DEĞER ALANLARI (VAH/VAL) – İşlemlerin çoğunun
(Special New Year promotion - free price!) The indicator displays the actual 'Scale in points per bar' (identical to the manual setting in the Terminal, see screenshot) in the upper right corner of the chart. The displayed value changes INSTANTLY whenever the chart scale is changed! (This is very convenient when planning screenshots). In Settings: Change language (Russian/English), font size of the displayed text, text label offset coefficient from the graph corner, equally in X and Y directi
FREE
TradeAQ
Guo Sheng Zhao
LuoMo Volume & Price Structure 8.98 A multi-function chart indicator for   MetaTrader 4 and MetaTrader 5 , designed to display key volume, volatility, sentiment, and price-structure information directly on the main chart. Main Features Volume and price-based Support & Resistance Volume spike and exhaustion signals ATR volatility expansion alerts Volume Profile with HVN and LVN Bullish and bearish sentiment distribution Developing or fixed POC VAH and VAL levels Supply and Demand zones Volume-wei
Gösterge, tarihsel olanlarla karşılaştırılabilecek güncel teklifler oluşturur ve bu temelde bir fiyat hareketi tahmini yapar. Gösterge, istenen tarihe hızlı navigasyon için bir metin alanına sahiptir. Seçenekler: Sembol - göstergenin göstereceği sembolün seçimi; SymbolPeriod - göstergenin veri alacağı dönemin seçimi; GöstergeRenk - gösterge rengi; Ters - doğru tırnakları tersine çevirir, yanlış - orijinal görünüm; Sonraki, tarihi girebileceğiniz ve 'enter' tuşuna basarak hemen atlayab
Breakout Boxes with Volume Pressure This indicator automates the identification of key consolidation zones (Supply and Demand) based on Market Pivots and Volatility (ATR). Unlike standard support/resistance tools, this indicator provides a unique   Volume Pressure Analysis   inside every box, giving you insight into the battle between Buyers and Sellers before a breakout occurs. Key Features Automated Supply & Demand Zones:   Automatically detects significant Pivot Highs and Lows to draw dyna
Bu ürünün alıcıları ayrıca şunları da satın alıyor
Trend Sniper X
Sarvarbek Abduvoxobov
4.86 (43)
Trend Sniper X , tüccarların trend yönünü ve olası dönüş noktalarını netlik ve hassasiyetle belirlemelerine yardımcı olan MetaTrader 5 için çoklu zaman dilimli bir trend takip göstergesidir. MT4 için: https://www.mql5.com/en/market/product/193245 Fiyat Bilgisi: Mevcut fiyat tanıtım amaçlıdır ve gelecek güncellemeler ile yeni özellikler yayınlandıkça değişebilir. Bonus Fırsatı: Bu indikatör için ÜCRETSİZ Oto-Trade Assistant EA'yı almak için lütfen satın aldıktan sonra yazara mesaj gönderin. Code
Efsane geri dönüyor: Entry Points Pro 10. MQL5 Market'te 3 yıl boyunca ilk 3'te kalan efsanevi indikatörün yeniden lansmanı. İki sürümde toplam 600'dan fazla yorum, her gün binlerce trader onunla işlem yapıyor, 28.000'den fazla demo indirmesi   MT4+MT5 . Beş yıl boyunca yazdığınız her yorumu okudum — ve söz vermek yerine yanıtları 10. sürümün içine işledim. 1999'dan beri piyasada olan ve dürüstlüğe, itibarına ve müşterilerine değer veren bir yazardan. Entry Points Pro, işleme giriş sinyallerini
M1 Sniper MT5
Oleg Rodin
5 (7)
M1 SNIPER   kullanımı kolay bir işlem göstergesi sistemidir. M1 zaman dilimi için tasarlanmış bir ok göstergesidir. Gösterge, M1 zaman diliminde scalping için bağımsız bir sistem olarak kullanılabilir ve mevcut işlem sisteminizin bir parçası olarak kullanılabilir. Bu işlem sistemi özellikle M1'de işlem yapmak için tasarlanmış olsa da, diğer zaman dilimleriyle de kullanılabilir. Başlangıçta bu yöntemi XAUUSD ve BTCUSD ticareti için tasarladım. Ancak bu yöntemi diğer piyasalarda işlem yaparken de
Auto Optimized SpeedAngle , sürekli İleriye Dönük Optimizasyon (Walk-Forward Optimization, WFO) yoluyla eğri uydurmayı (curve-fitting) ortadan kaldıran kurumsal düzeyde bir momentum vektörleme sistemidir. Piyasa rejimleri değiştiğinde etkinliğini yitiren statik girdilere güvenmek yerine, gösterge, örneklem dışı (Out-of-Sample, OOS) doğrulama kullanarak parametrelerini dinamik olarak yeniden kalibre eder ve böylece gösterilen sinyallerin geçmişteki rastgele anomalileri değil, gerçek bir istatisti
Gann Made Easy , bay teorisini kullanarak ticaretin en iyi ilkelerine dayanan, profesyonel ve kullanımı kolay bir Forex ticaret sistemidir. WD Gann. Gösterge, Zararı Durdur ve Kâr Al Seviyeleri dahil olmak üzere doğru SATIN AL ve SAT sinyalleri sağlar. PUSH bildirimlerini kullanarak hareket halindeyken bile işlem yapabilirsiniz. Satın alma işleminden sonra, alım satım talimatlarını ve harika ek göstergeleri ücretsiz olarak almak için lütfen benimle iletişime geçin! Muhtemelen Gann ticaret yöntem
Adaptive Price Action Engine Göstergeyi al, EA'sı (Uzman Danışman) bedava gelsin Kendi Kendini Optimize Eden Multi-Timeframe Trend ve Mum Formasyonu Analizi Piyasalar sürekli değişir ve her Price Action formasyonu her piyasa koşulunda aynı değere sahip değildir. Adaptive Price Action Engine , değişen piyasa koşullarına uyum sağlamak amacıyla trend yapısını, Multi-Timeframe analizini, mum formasyonlarını ve istatistiksel optimizasyonu tek bir analiz sistemi içerisinde birleştirir. İki Adaptif Mod
Boba Analysis Suite
Trade Ready Solutions LLC
5 (2)
Boba Analysis Suite Boba Analysis Suite, MetaTrader 5 için geliştirilmiş bir analiz göstergesidir. Piyasa yapısını, önemli fiyat bölgelerini ve genel piyasa bağlamını tek bir grafik görünümünde bir araya getirir. Trader ve trading eğitmeni olarak edinilen uygulamalı deneyimden yola çıkarak geliştirilmiştir. Piyasanın yönünü değerlendirme, önemli seviyeleri belirleme ve birden fazla zaman dilimini birlikte inceleme gibi adımlardan oluşan sistematik bir analiz sürecini destekler. Piyasa Bağlamını
Quantum TrendPulse
Bogdan Ion Puscasu
5 (26)
SuperTrend   ,   RSI   ve   Stochastic'in   gücünü tek bir kapsamlı göstergede birleştirerek işlem potansiyelinizi en üst düzeye çıkaran nihai işlem aracı olan   Quantum TrendPulse'u   tanıtıyoruz. Hassasiyet ve verimlilik arayan yatırımcılar için tasarlanan bu gösterge, piyasa trendlerini, momentum değişimlerini ve en uygun giriş ve çıkış noktalarını güvenle belirlemenize yardımcı olur. Temel Özellikler: SuperTrend Entegrasyonu:   Güncel piyasa trendlerini kolayca takip edin ve karlılık dalgası
Neuro Poseidon MT5
Daria Rezueva
4.75 (52)
Neuro Poseidon is a new indicator by Daria Rezueva. It combines precise trading signals with adaptive TP/SL levels - creating best possible trades as a result! Message me and get  Neuro Poseidon Assistant  as a gift to automize your trading process! What makes it stand out? 1. Proven profitability on all assets and timeframes 2. Only confirmed BUY and SELL signals present on the chart 3. Adaptive TP & SL levels generated by the software for each trade 4. Easy to understand - suitable for al
Azimuth Pro
Ottaviano De Cicco
5 (7)
Azimuth Pro V2: Synthetic Fractal Structure and Confirmed Entries for MT5 Overview Azimuth Pro is a multi-level swing structure indicator by Merkava Labs . Four nested swing layers, swing-anchored VWAP, ABC pattern detection, three-timeframe structural filtering, and closed-bar confirmed entries — one chart, one workflow from micro-swings to macro-cycles. This is not a blind signal product. It is a structure-first workflow for traders who care about location, context, and timing. Halloween P
Çoklu Para Birimi Güç ve Momentum Göstergesi MT5 Dynamic Forex28 Navigator, uzun süredir popüler olan göstergelerimizin gelişmiş halidir ve üç aracın gücünü tek bir araçta birleştirir: Advanced Currency Strength28 Indicator (700 değerlendirme) Advanced Currency IMPULSE with ALERT (530 değerlendirme) CS28 Combo Signals (güncel bonus) İki önceki gösterge MQL5 Market'te birlikte 1.200'den fazla değerlendirme aldı ve 2016'dan bu yana MT4 topluluğunun vazgeçilmez araçlarından biri. Dynamic Forex28 Na
Volatility Master for MetaTrader is a real-time dashboard tool that scans up to  50 symbols  to identify high-volatility , trending markets instantly. With bullish/bearish signals, customizable alerts, and a user-friendly interface, it helps you avoid range-bound conditions and focus on high-probability trades. Clarity leads to confidence. Trade confidently and protect your capital effectively with this powerful dashboard. We don't offer free or bonus indicators in exchange of reviews from you.
SR Liquidity , piyasa likiditesinin yoğunlaştığı ve fiyatın en güçlü tepkiyi verdiği gizli bölgeleri ortaya çıkarmak için tasarlanmış bir alım-satım göstergesidir. Bu özel likidite alanları güçlü destek ve direnç seviyeleri işlevi görerek, piyasanın yön değiştirme ihtimalinin en yüksek olduğu yerlere dair size net bir harita sunar. SR Liquidity, sıradan Destek/Direnç çizgileri çizmek yerine, alım ve satım baskısının yoğunlaştığı bölgeleri tespit etmek için gerçek fiyat hareketlerini analiz eder.
OrderFlux – MetaTrader 5 için Orderflow Footprint Chart, Volume Profile ve Market Profile Göstergesi OrderFlux, MetaTrader 5 için geliştirilmiş, emir akışını ayrıntılı biçimde gösteren bir Footprint göstergesidir. Her mumun içini açarak her fiyat seviyesinde gerçekleşen işlem hacmini gösterir ve bu hacmi agresif alıcılar ile agresif satıcılar arasında ayırır. Tick verilerinden yararlanarak delta, dengesizlik, absorpsiyon, Volume Profile, Market Profile (TPO), VWAP, kümülatif delta (CVD), DOM sek
Advanced Supply Demand MT5
Bernhard Schweigert
4.53 (15)
Herhangi bir Acemi veya Uzman Tüccar için En İyi Çözüm! Bu gösterge benzersiz, yüksek kaliteli ve uygun fiyatlı bir ticaret aracıdır çünkü bir dizi tescilli özelliği ve yeni bir formülü bir araya getirdik. Bu güncelleme ile çift zaman dilimi dilimlerini gösterebileceksiniz. Yalnızca daha yüksek bir TF gösteremeyeceksiniz, aynı zamanda TF grafiğini ve ARTIK daha yüksek TF'yi de gösterebileceksiniz: YUVARLAK BÖLGELERİ GÖSTERMEK. Tüm Arz Talebi tüccarları buna bayılacak. :) Önemli Bilgiler Açıkland
Precision Spike Detector
Francisco Mandomo Simbine
5 (2)
Precision Spike Detector V3 – Institutional-Grade AI Trading System Attention: The price increases by US$50 for every 10 purchases.  Final price: US$599 Precision Spike Detector V3   is a   state-of-the-art, institutional-grade market analysis system   for   MetaTrader 5 , designed to detect   high-probability market movements   in synthetic indices such as   Boom, Crash, GainX, and PainX . After purchase, send me a private message to receive the optimized configuration files,  the installation
Scalper Vault, gün içi işlemlerde istikrar yakalamak isteyen yatırımcılar için tasarlanmış, güçlü ve tam donanımlı bir alım satım sistemidir. Bu yüksek hassasiyetli gösterge; hem Forex hem de İkili Opsiyon yatırımcıları için kurumsal düzeyde analizler sunan, bağımsız ve eksiksiz bir alım satım sistemi işlevi görür. SATIN ALIM İŞLEMİNDEN SONRA BENİMLE İLETİŞİME GEÇİN; ALIM SATIM İPUÇLARIMI VE HARİKA BİR BONUSU ALIN! Tahmin yürütme zorunluluğunu ve karmaşık manuel analiz süreçlerini ortadan kaldı
Matreshka
Dimitr Trifonov
5 (2)
Matreshka self-testing and self-optimizing indicator: 1. Is an interpretation of the Elliott Wave Analysis Theory. 2. Based on the principle of the indicator type ZigZag, and the waves are based on the principle of interpretation of the theory of DeMark. 3. Filters waves in length and height. 4. Draws up to six levels of ZigZag at the same time, tracking waves of different orders. 5. Marks Pulsed and Recoil Waves. 6. Draws arrows to open positions 7. Draws three channels. 8. Notes support and re
Divergence Bomber
Ihor Otkydach
4.89 (94)
Bu göstergeyi satın alan herkese aşağıdaki ekstra içerikler ücretsiz olarak sunulmaktadır: Her işlemi otomatik olarak yöneten, Stop Loss ve Take Profit seviyelerini ayarlayan ve işlemleri strateji kurallarına göre kapatan özel yardımcı araç: "Bomber Utility" Göstergenin farklı varlıklar üzerinde kullanılmasına yönelik ayar dosyaları (set dosyaları) Bomber Utility için 3 farklı modda kullanım sunan ayar dosyaları: "Minimum Risk", "Dengeli Risk" ve "Bekle-Gör Stratejisi" Bu ticaret stratejisini
ARIPoint
Temirlan Kdyrkhan
1 (4)
ARIPoint is a powerful trading companion designed to generate high-probability entry signals with dynamic TP/SL/DP levels based on volatility. Built-in performance tracking shows win/loss stats, PP1/PP2 hits, and success rates all updated live. Key Features: Buy/Sell signals with adaptive volatility bands Real-time TP/SL/DP levels based on ATR Built-in MA Filter with optional ATR/StdDev volatility Performance stats panel (Success, Profit/Loss, PP1/PP2) Alerts via popup, sound, push, or email Cu
Yeni Başlayanlar veya Uzman Tüccarlar için En İyi Çözüm! Bu Gösterge benzersiz, yüksek kaliteli ve uygun fiyatlı bir ticaret aracıdır çünkü bir dizi tescilli özellik ve yeni bir formül ekledik. Sadece BİR grafik ile 28 Forex çifti için Döviz Gücünü okuyabilirsiniz! Yeni bir trendin veya scalping fırsatının tam tetik noktasını belirleyebildiğiniz için ticaretinizin nasıl gelişeceğini hayal edin? Kullanım kılavuzu:   buraya tıklayın Bu ilk olan, orijinal! Değersiz bir özenti klonunu almayın.
Protect against whipsaws: revolutionize your swing trading approach Swing Trading is the first indicator designed to detect swings in the direction of the trend and possible reversal swings. It uses the baseline swing trading approach, widely described in trading literature. The indicator studies several price and time vectors to track the aggregate trend direction and detects situations in which the market is oversold or overbought and ready to correct. [ Installation Guide | Update Guide | Tro
Merhaba yatırımcılar! Birçok bireysel yatırımcı yavaş web komut dosyaları kullanıyor. Kârlı işlem yapmak için sistematik bir yaklaşım şarttır. Astro AI göstergesi sadece bir grafik üzerindeki görselleştirme değildir. Doğrudan terminal içinde çalışan iki ajandan oluşan gelişmiş bir sinir ağıdır. Sistemin teknik detayları: 1. Ajan 1: Analist (Grafiksel Sinir Ağı – GNN) Piyasa, tek tek fiyat çubuklarından değil, birbirine bağlı verilerden oluşan bir ağdan oluşur. İşlev: Ajan 1, bu karmaşık, d
DELTA FUSION PRO 10.0, MetaTrader için özel olarak geliştirilmiş, emir akışının (order flow) ve kurumsal baskının (Ask/Bid farkı) gerçek zamanlı analizi için tasarlanmış profesyonel bir göstergedir. Ana Özellikler Akıllı Otomatik Ayarlama (Auto-Tuning): Piyasa türüne (Forex, Kripto, Endeksler, Emtialar, Hisseler, Vadeli İşlemler), zaman dilimine ve volatiliteye (ATR) göre otomatik olarak kalibre olur. Operasyonel İşlevler: NetDelta & Kümülatif Delta: EMA düzeltmesi ile yönsel baskının takibi. F
The Oracle Pro
Ottaviano De Cicco
5 (1)
The Oracle Pro: Synthetic Multi-Timeframe Bias Engine for MT5 Halloween Promo — 35% OFF The market gets spooky. Your edge stays sharp. Save 35% before this offer fades into the mist. The Oracle Pro is now USD 194 (regular USD 299). The Oracle Pro is a premium multi-timeframe bias engine for MetaTrader 5, built for demanding and professional traders. It answers one question with discipline: what is the directional bias on each timeframe right now, how strong is it, and how much do the timefra
Tanıtım       Quantum Breakout PRO   , Breakout Bölgeleri ile ticaret yapma şeklinizi değiştiren çığır açan MQL5 Göstergesi! 13 yılı aşkın ticaret tecrübesine sahip deneyimli tüccarlardan oluşan bir ekip tarafından geliştirilmiştir.       Kuantum Breakout PRO       yenilikçi ve dinamik koparma bölgesi stratejisiyle ticaret yolculuğunuzu yeni zirvelere taşımak için tasarlanmıştır. Kuantum Breakout Göstergesi, size 5 kar hedefi bölgesi ile kırılma bölgelerinde sinyal okları ve kırılma kutusuna da
Graded Liquidity Sweep
Kaustubh Pradeep Deshmukh
This indicator marks the candles where price runs through a liquidity level and turns back. It finds and ranks the levels by itself, so there is nothing to draw by hand. It is made for manual trading on any symbol and timeframe. What you see on the chart A buy or sell arrow on the candle that confirms the reversal. Arrows appear only after that candle has closed, and they do not repaint. For every signal: the level that was swept, a stop level and two target levels. A label with the type of leve
Superhero
Ihor Otkydach
5 (3)
SUPERHERO göstergesi, "her şeyi kapsayan" bir temele dayalı olarak tasarlanmış çoklu para birimli bir işlem sistemidir. Gösterge, piyasayı bağımsız olarak analiz eder ve işlemlerin ne zaman açılıp kapatılacağına dair sinyaller verir. Stop Loss ve Take Profit emirlerini kullanır. R:R oranı 1:1'dir. Bu sistem akıllı telefonunuza anlık bildirimler gönderebilir; böylece bir bilgisayara bağlı kalmanıza gerek kalmadan "hareket halindeyken" işlem yapabilirsiniz. Bu, özel ticaret şirketleri için idealdi
Btmm state engine pro
Garry James Goodchild
5 (4)
BTMM State Engine Pro by G-Labs — Beat The Market Maker indicator for MetaTrader 5. Asian session range, London and New York kill zones, level progression (L1/L2/L3), peak formation detection (PFH/PFL), entry signals, and a multi-pair scanner from one chart. Stop scanning charts one pair at a time. The State Engine tracks the BTMM daily cycle automatically — Asian box, room boundaries, level blocks, peak formations, and filtered entries — while the scanner dashboard shows level, peak status, d
RelicusRoad Pro MT5
Relicus LLC
4.96 (25)
İşlemlerinizi tahminle yapmayı bırakın. Ne zaman gireceğinizi, nereden çıkacağınızı ve piyasanın hangi yöne eğildiğini, hepsini tek grafikte görün. RelicusRoad Pro, neredeyse yirmi aracı tek bir göstergede toplar; işlem tarzınıza uyan araçları açarsınız. Net girişler. Net çıkışlar. Her grafikte bir plan. Tanıdık geliyor mu? Alım yaparsınız, bir dakika sonra fiyat aleyhinize döner. Erken kapatırsınız, sonra hareketin sizsiz devam ettiğini izlersiniz. Grafikte beş gösterge, beş farklı cevap. Zarar
Yazarın diğer ürünleri
Swing Structure MS shows market structure as a clean line of confirmed swing highs and swing lows. Swings can be taken from any timeframe (for example H1) and displayed on any chart, so you can follow the higher-timeframe structure while working on M5 or M15. How it works A swing high/low is a bar whose high/low is not exceeded by N bars on each side (Depth). A new leg is accepted only if its size is at least X times ATR, or a fixed number of points. Small noise is ignored. On a lower-timeframe
FREE
TPO Session Letters MS draws a classic Market Profile with letters (A, B, C …) for one cash session per day, directly on the MetaTrader 5 chart. By default it is set up for the Xetra session of the German index (09:00–17:30 Frankfurt time); any other session can be configured in the inputs. You enter the session in its own time zone (Frankfurt, London or New York). The indicator converts it to your broker's server time separately for every day, including the weeks when Europe and the USA change
Filtrele:
Değerlendirme yok
Değerlendirmeye yanıt