Lighthouse Market Structure MT4

LIGHTHOUSE — piyasa yapısını bir bakışta görün. Yeniden çizim yok.

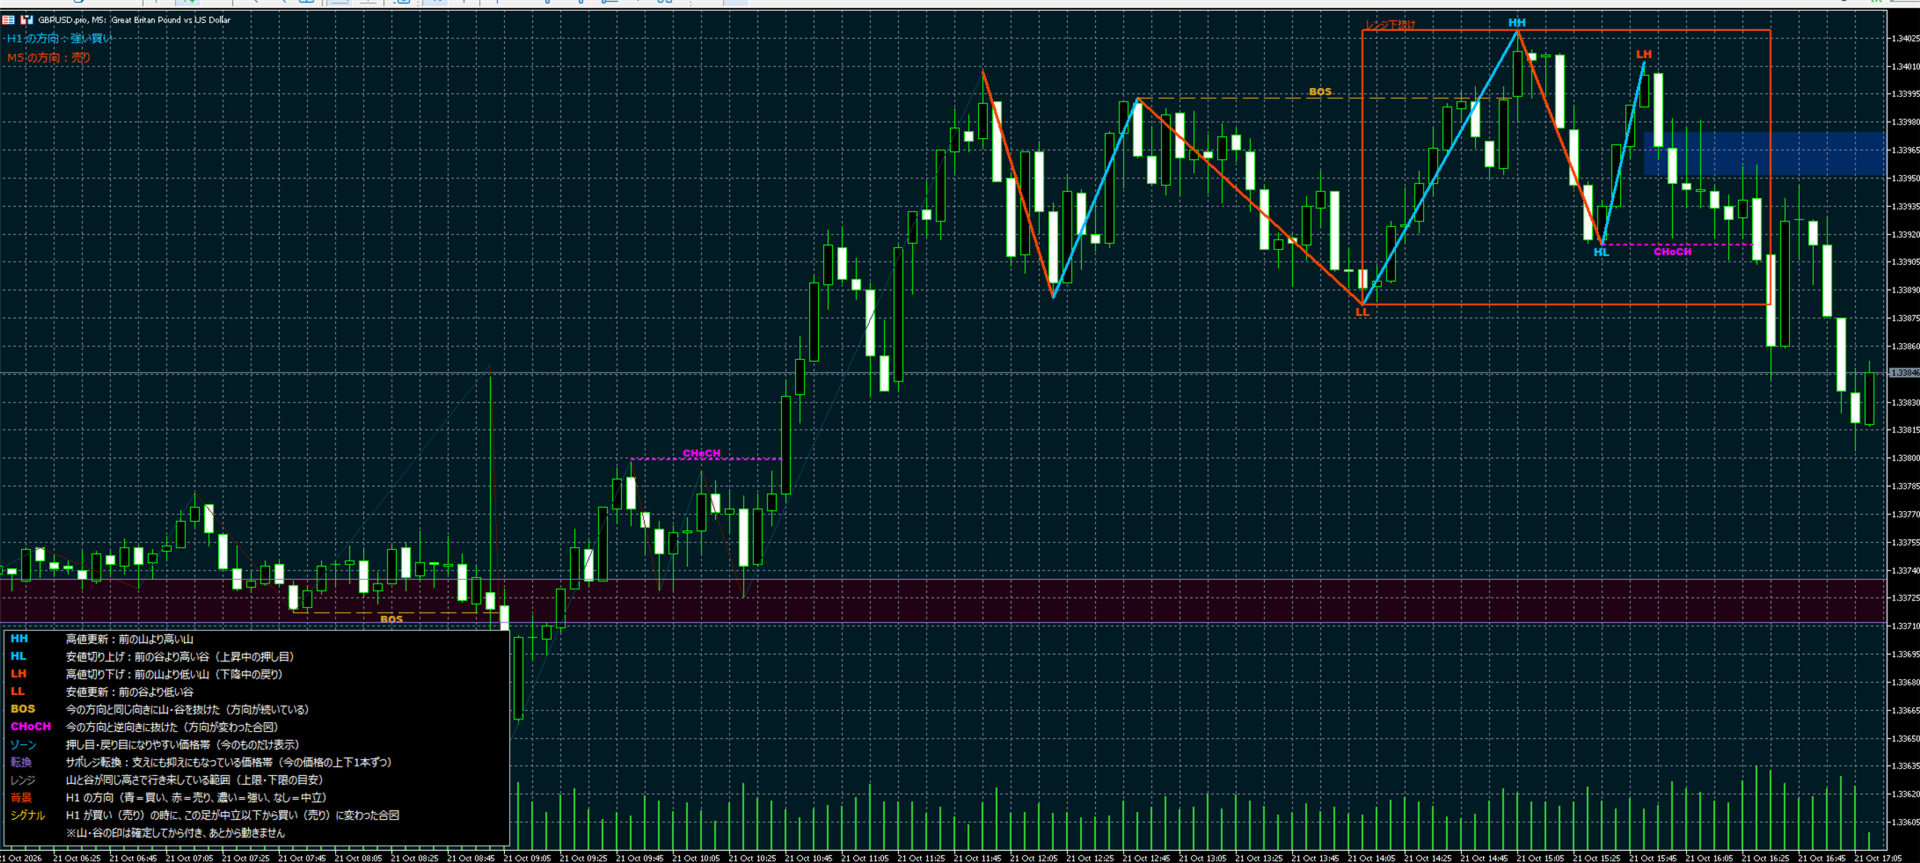
LIGHTHOUSE, fiyat yapısını onaylanmış salınım noktalarından okur ve grafikte sade, anlaşılır biçimde gösterir. Her takdire dayalı yatırımcının girişten önce sorduğu üç soruyu yanıtlar: Üst zaman dilimi hangi yöne gidiyor? Mevcut grafik hangi yöne gidiyor? Önemli fiyat seviyeleri nerede?
Karar destek aracıdır. İşlem açmaz ve fiyat tahmini yapmaz.

Neden "LIGHTHOUSE" (deniz feneri)?
Deniz feneri gemilere yolu gösterir ve kayalıkları uyarır, ama dümende yine kaptan vardır. LIGHTHOUSE da grafiğinizde piyasanın yönünü ve fiyatın tepki verme eğiliminde olduğu bölgeleri gösterir. Kararlar sizindir.

Nasıl çalışır

  • Salınım tepe ve dipleri yalnızca mum kapandıktan sonra onaylanır. Görünen bir etiket artık kaymaz veya kaybolmaz.
  • Yapı kırılımları fitillerle değil kapanış fiyatıyla değerlendirilir.
  • Yön, son kırılımın yönünden ve son iki tepe ile dibin sıralamasından (Dow teorisi) belirlenir.
  • Aynı mantık bir üst zaman dilimine de uygulanır (varsayılan H1).

Ana özellikler

  • 5 seviyeli yön: Strong Buy, Buy, Neutral, Sell, Strong Sell; üst zaman dilimi ve mevcut grafik için.
  • İki renkli zikzak ile HH, HL, LH ve LL etiketleri.
  • BOS (devam) ve CHoCH (karakter değişimi) çizgileri.
  • Mevcut dalga için bir geri çekilme bölgesi.
  • Destek/direnç dönüşüm bölgeleri: hem destek hem direnç olmuş dar bantlar, fiyatın üstünde ve altında birer tane. Kırılan bölgeler soluklaşır.
  • Aralık kutusu: tepeler ve dipler benzer seviyelerde tekrarlandığında çizilir; kırılımda renk değiştirir (yukarı mavi, aşağı kırmızı).
  • Uyumlu yön sinyali: üst zaman dilimi Buy veya daha güçlüyken mevcut grafik Neutral veya altından Buy veya üstüne geçtiğinde panelde saatle birlikte "Buy signal" görünür. Satış için tersi geçerlidir.
  • Sinyal, BOS ve CHoCH için açılır uyarılar ve anlık bildirimler, ayrı ayrı açılıp kapatılabilir.
  • Dahili açıklama, üç görüntü seviyesi (Simple, Standard, Full).
  • Hafif: geçmiş bir kez hesaplanır, sonra yalnızca her yeni kapanan mum işlenir.

Tipik kullanım

  • Üst zaman dilimine karşı işlem yapmaktan kaçınmak.
  • Bir destek/direnç dönüşüm bölgesiyle birlikte aralık kenarlarında işlem yapmak.
  • Önceki BOS/CHoCH çizgileri ve bölgelerle çıkış planlamak.

Önerilen ayarlar

  • M5'te, üst zaman dilimi H1 ile geliştirildi ve kontrol edildi (EURUSD, GBPUSD, USDJPY, XAUUSD).
  • Her sembol ve zaman diliminde çalışır. M15 için üst zaman dilimi olarak H4 doğal bir seçimdir.

Ana girişler

  • Üst zaman dilimi ve mum sayısı, salınım mumları, maksimum mum, görüntü seviyesi
  • Son dalgalar ve etiketler, renkler, çizgi kalınlığı, yazı boyutu, açıklama
  • Destek/direnç dönüşüm bölgesi ve aralık kutusu ayarları
  • Sinyal, BOS ve CHoCH uyarıları, anlık bildirimler

Notlar

  • Bu bir analiz aracıdır. İşlem açmaz veya kapatmaz.
  • Hiçbir gösterge gelecekteki sonuçları garanti edemez. Lütfen önce demo hesapta deneyin.
  • Sorularınız için yorum bölümünü veya MQL5 özel mesajlarını kullanın.
Önerilen ürünler
Power Flow Binary
Ganesh Tanaji Lohar
POWER FLOW PRO — Binary Options Edition For the first time ever, the POWER FLOW PRO cumulative dominance logic is specially optimized for Binary Options trading. POWER FLOW PRO is a smart real-time pressure-flow indicator designed to detect aggressive market momentum and short-term directional dominance for fast Binary Options entries. The system analyzes: Real-time buying pressure Real-time selling pressure Momentum candle strength Cumulative dominance flow Continuation pressure to generate hig
Dear Trader It is my pleasure to introduce to you my tool called the " Forex Sniper Indicator" . The major aim of this tool is to help serious traders and investors in all type of Financial Markets to catch price next movement right at the moment the price direction is about to change. This tool can be used to snipe the price direction in both down trend, uptrend and ranging markets. This tool can be used as the stand alone tool though it may be combined with other tools as well. My goal is to h
Fibonacci Trend Marker —  mevcut mumun önceki mumların Yüksek-Düşük (High-Low, HL) aralığına göre davranışını Fibonacci geri çekilme seviyelerini kullanarak analiz eden bir trend göstergesidir. Trendin gücünü görsel olarak takip eder ve mum renginin değişimiyle olası zayıflama veya tersine dönüş sinyalleri verir. Özellikler: Trend odaklı traderlar için tasarlanmıştır ve Fibonacci seviyelerine dayanarak trend değişikliklerini hızlıca tespit etmeye yardımcı olur. Piyasada yeterli volatilite olduğ
Currency Strength Table HYBRID v1.33   - Professional Multi-Timeframe Currency Strength Analyzer (PRO) BREAKTHROUGH CURRENCY ANALYSIS SOLUTION FOR SERIOUS FOREX TRADERS!  *Note: Most suitable for Professionals, Advanced & Intermediate traders!   * ADDITIONAL BONUS:   Rent for 3months and get a free ex.4 dual switch momentum (RSI+Prcie/Bid Ratio) Currency Bar Meter . See attached screenshot 6 .  Limited offer (first 50 purchases). The Ultimate All-In-One Currency Strength Dashboard EXPLAINED. St
F ully automated Expert Advisor using the  advanced   algorithm for trading the EURUSD Designed for profit in a short period of time and big profit in a long run. Prefers EURUSD 1H. Principle of operation The SELL and BUY orders are opened (depending on the parameters set), guided by signals and the market situation.     Recommended parameter: Use an ECN broker account. minimum deposit of 100$ USD. use it in H1 time frame recommended symbol is EURUSD input parameter: TrendType                 


FiboPlusWaveRunner
Sergey Malysh
3.29 (7)
Expert. Automatic and manual trading. Ready-made trading system based on Elliott waves and Fibonacci retracement levels . It is simple and affordable. Display of the marking of Elliott waves (main or alternative option) on the chart Construction of horizontal levels, support and resistance lines, a channel Superposition of Fibonacci levels on waves 1, 3, 5, A Alert system (on-screen, E-Mail, Push notifications) visual panel for opening orders in manual trading visual panel for setting up automat
Alphabet AI MT4
Sergei Pomytkin
Alphabet AI , ortalamaya dönüş stratejisi üzerinde çalışan bir danışmandır; bu, piyasaların güçlü sapmalardan sonra ortalama değerlerine geri dönme doğal özelliğini kullandığı anlamına gelir. Algoritma, varlığın mevcut fiyatını sürekli olarak analiz eder ve hesaplanan ortalama seviyelerle karşılaştırır. Fiyat ortalama değerinden önemli ölçüde saptığında, danışman bunu bir eylem sinyali olarak yorumlar: Üst sınır aşıldığında, fiyat düşüşü bekleyerek kısa pozisyonlar açar ve alt sınırın altına dü
TPO Profile MT4
Kyra Nickaline Watson-gordon
5 (1)
Definition : TPO is a Time Price Opportunity. Instead of using bars or candles with an Open, High, Low, and Close price, each "bar" in a Market Profile is represented by horizontal bars against the price It is called Market Profile terminology. In other words time-price-opportunity (TPO) profiles are histograms of how much time was spent at each price within the span of the profile. By using a TPO chart, you are able to analyze the amount of trading activity, based on time, for each price level
Diamond Trend
Segundo Calvo Munoz
Indicator which identifies Trend and also buy/sell opportunities. Use for entries aligned to the Trend.  Although Diamond Trend is very accurate identifying entry points, it is always recommended to use a support indicator in order to reconfirm the operation. Remind to look for those Assets and Timeframes which best fit to your trader behavior/need... Valid for Scalping and Long Term operations. Please, set up a Bars Chart to be able to visualize the indicator properly...  ...And remind to give
Infinite Forex EA
Roman Pozdnyakov
1 (1)
We are pleased to present to you, our new product, this is the next step in the development of automated trading in the Forex market. This is a revolutionary algorithm developed by our team of programmers. Here all the accumulated experience for 10 years of work in the Forex market is gathered. The adviser uses several strategies for different stages of the market (Trend, Flat, Volatile market or Very weak). The algorithm passed all testing with different brokers, at different quotes. Advisor is
Milch Cow Harmonic EA "Tool designed to trade 28 currency pairs according to 88 harmonic patterns plus one customized according to your parameters The expert graph interface guides you to the pattern names when passing over the pattern circle You can activate or disable any number of currency pairs and patterns for your trade by clicking on the currency pair circle or the harmonic pattern (green = activate    red = disable) You can set more than one time frame within which the expert will look f
Sell Signall
Dmitriy Kashevich
This indicator is named so for a reason, because it will show the reverse side of the market. It has several math indicators built in that are tuned to show the best signals for currency pairs! Ideally proved to be in work on the M5-M15 no more and no less! Only at the same time it shows up to 86.5% of correct signals! The settings include the colors of the arrows, the alert, and the same parameters so that you can reconfigure the indicator and trade on cryptocurrency and raw materials! If
ZigZag Lower Entry and Top Entry
Jose Alejandro Alcala Lira
MQL4 LOWER ENTRY AND UPPER ENTRY IN ZIGZAG 1.- ENTRIES AT THE HIGHEST POINT OF THE ZIGZAG INDICATOR WHEN YOU BUY (EXTREMUM HIGH) AND AT THE LOWEST POINT OF THE ZIGZAG INDICATOR WHEN YOU SELL (EXTREMUM LOW), MANUALLY ADDING THE LOTS, SLIPPAGE, STOP LOSS AND TAKE PROFIT, IT COMES WITH AN ALERT AND A SOUND WHEN THE ROBOT ADD THE PENDING OPERATION. 2.- YOU CAN DECIDE BY TRUE OR FALSE IF YOU WANT THE PENDING ORDERS TO BE MODIFIED IF A NEW ZIGZAG IS MADE AT A HIGHER POINT WHEN YOU ARE SELLING OR A NEW
Sweet Waffle
Christophe Godart
The arrows are calculated with: -     2 Parabolic  parameters -     2 ADX parameters -     4 Stochastic parameters We recommend to combine it with Parabolic, ZigZag or Elliot waves indicator. Always trade the trend! If you make sure to draw your trend lines and support/resistance zones you will just have to wait for the signal to appear. Take the trade. For Binary Options it is advisable to set the expiry time to 5-15 min in M1 chart. THIS INDICATOR IS ZERO REPAINT Best assets to trade: - EUR
New York AM Session Profile NY AM Session Profiling Framework | Non-Repainting | Real-Time | FX & Index Presets | MT5 Version Available Full Setup Guide & Strategy Playbook: https://www.mql5.com/en/blogs/post/771380 MT5 Version: https://www.mql5.com/en/market/product/180798 Indicator Overview The New York AM Session Profile framework is a   professional market-structure visualization tool   designed for traders who study liquidity, session behaviour, and institutional price delivery. Instead
Project IG MT4
Ruslan Pishun
1.78 (9)
The EA is not a scalper. The EA uses a strategy based on the breakdown of local support and resistance levels, also uses the reverse and rebound from support and resistance levels.  The EA is based on the original author's strategy. Real monitoring:   https://www.mql5.com/en/signals/author/profi_mql Detailed description of the strategy here:  https://www.mql5.com/ru/blogs/post/728430 This is a link for general discussion of the EA:  https://www.mql5.com/ru/blogs/post/728430 Hidden Take profit,
Rtc ML Ai | Predictor CORE MACHINE LEARNING ENGINE Adaptive ML Market Predictor – Multi-Bar Trend & Candle Forecast What This Indicator Does This indicator is a  real-time market prediction engine  designed to analyze price behavior and estimate  future market tendencies . Unlike conventional indicators, this system  does not rely on static parameters or historical curve-fitting , but adapts its internal state dynamically during live market operation. Instead of using static rules, the indic
The EA trades when momentum reach more volume factor . Any pair, time frame any broker no limited, recommend minimum deposit 500$ SETTING Symbol - Name of pair (ex.EURUSD#) Breakout_factor - Volume peak factor (Recommend for forex use 0.5-1.5). Sideway_factor - Volume low factor ( Recommend for  forex use 0.1-0.5). Lots - start lot. Max_lots -    maximum lot. Grid_boost -  Frequency of opening position (Less more order). Grid_minimum_pips - Check distance grid from last order. TP_pips - take pr
FREE
Asteroid
Evgeniy Zhdan
The basis of the work of the adviser is to use the change in trend strength to determine the optimal entry points to the market. The logic of the advisor’s work combines two strategies: control of price consolidation and its “explosion” and control of the trend end to work in the channel. The EA does NOT use dangerous trading methods. Each trade has a stop loss and take profit. Recommended trading tools (5m): EURUSD, GBPUSD, USDJPY, USDCAD. Settings: MaxRisk - Value for calculating the tradi
Supply and Demand Tracker MT4  US PPI, Fed Interest Rates, and FOMC Trade Setup Time Lapse: U.S. dollar(DXY) and Australian dollar vs U.S. dollar(AUD/USD) https://youtu.be/XVJqdEWfv6s  May CPI Trade Setup Time Lapse: Gold, Euro/US dollar, US Tech 100, and USDX Experience the power of our cutting-edge supply and demand system as we delve into the captivating world of market dynamics surrounding the release of the consumer price index (CPI). Our system, built on the principles of supply and deman
The EA’s unique algorithm calculates the average price (reflected in the form of a trend line on the chart), which is the center of price attraction in the framework of the traded timeframe. At times of increasing volatility, the adviser begins work with the goal of fixing profit in the region of the center of attraction of the price. Advisor does not use dangerous trading methods. It is recommended to install a trading expert on a remote server (VPS). Recommended Trading Instruments (TF 5M)
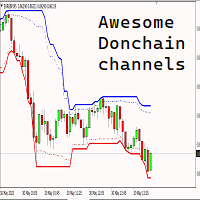
Introducing the Donchian Channels indicator for MQL4, a powerful technical analysis tool designed to boost your trading success. This indicator consists of four lines that represent the upper and lower boundaries of price movement over a specified period. With the Donchian Channels indicator, you can easily identify potential breakouts and reversals in the market. The upper line shows the highest high of the specified period, while the lower line represents the lowest low. The space between thes
Introducing the River Flow Divergence Indicator Are you ready to unlock your trading potential? Meet the River Flow Divergence Indicator, a powerful tool designed to help you navigate market trends and reversals with precision. This indicator is tailored for traders who are eager to fine-tune their strategies and take control of their success. Note: This indicator is not optimized out of the box. It’s crafted for you to customize and optimize according to your unique trading style and goals. Ho
Magic EA MT4
Kyra Nickaline Watson-gordon
3 (1)
Magic EA is an Expert Advisor based on Scalping, Elliot Waves and with filters such as RSI, Stochastic and 3 other strategies managed and decided with the robot smartly. Large number of inputs and settings are tested and optimized and embedded in the program thus inputs are limited and very simple. Using EA doesn't need any professional information or Forex Trading Knowledge. EA can trade on all symbols and all time frames, using special and unique strategies developed by the author. The EA wo
Gold Strike Predator
Ignacio Agustin Mene Franco
GoldStrike Predator – Professional Expert Advisor for XAUUSD GoldStrike Predator is an advanced, high-precision Expert Advisor (EA) designed exclusively for trading the XAUUSD pair (Gold vs. US Dollar) on the MetaTrader 4 platform. Developed with a sophisticated hybrid architecture, it combines multiple layers of technical and predictive analysis to identify high-probability opportunities in the gold market, one of the world's most volatile and profitable instruments. Trading Strategy The sys
QuantEx Pivot Indicator
Savia Forex Software Solutions
QuantEx Pivot Indicator is a practical MT4 technical analysis tool designed to help traders identify important Fibonacci-based pivot, support, and resistance levels directly on the chart. The indicator monitors price action and plots key levels using a structured calculation framework, giving traders a clearer view of potential reaction zones across different market conditions. QuantEx Pivot Indicator can be used on compatible currency pairs, indices, commodities, stocks, metals, and cryptocurre
HighScalpel
Ivan Simonika
5 (1)
Introducing the HighScalpel scalping system. It is enough to optimize once, for example, per month. After that, he shows excellent results on the forward period (several times larger), which can be seen in the screenshots. Be attentive to the spread indicators of your broker! The higher the spread, the less often the market entries. If the spread is above 20 pips, then the number of inputs falls by two orders of magnitude. It is ideal to use a broker with a floating spread of 6 pips. Such bro
Ruby Scalper EA MT4
Telio Ivan Ezequiel Macie
# Ruby Scalper EA – Automated Trading Robot Ruby Scalper EA is designed for traders who want an automated tool that follows structured trading rules with speed and precision. The system applies a multi-timeframe confirmation process, where entries are aligned across different timeframes for additional confluence. It can be applied to multiple markets, though it has been most frequently used on **Gold (XAU/USD)** on the 1-minute chart with the default settings. --- ### Key Features * **Multi
Indicator for binary options arrow is easy to use and does not require configuration works on all currency pairs, cryptocurrencies buy signal blue up arrow sell signal red down arrow tips do not trade during news and 15-30 minutes before their release, as the market is too volatile and there is a lot of noise it is worth entering trades one or two candles from the current period (recommended for 1 candle) timeframe up to m 15 recommended money management fixed lot or fixed percentage of the depo
Know the direction. Know the plan. Know when to stand aside. CS Trend Pro turns a busy chart into a clear decision. It shows which way the market is moving and marks the moment that changes. With every signal it gives you a complete plan: where to enter, where the idea is wrong, and where to take profit. It is built for swing traders and scalpers who move with the swing: take a part of the profit at each target, and stay in for as long as the move lasts. Built on volatility and on support and re
Bu ürünün alıcıları ayrıca şunları da satın alıyor
Miraculous Indicator Binary & Forex v3 StrategySafe Miraculous Indicator Binary & Forex v3 StrategySafe , net sinyaller, güçlü onay araçları ve Binary ile Forex piyasalarında kullanılabilecek yapılandırılmış bir işlem yaklaşımı isteyen traderlar için geliştirilmiş profesyonel bir indikatördür. v3 sürümü; MIR Dashboard, Miraculous Confirmation Dashboard, GANN Law, Square of 9 seviyeleri, GANN açıları ve daha gelişmiş Forex modu ile daha güçlü bir piyasa analizi sunar. Öne çıkan özellikler Tek ind
TrendMaestro
Stefano Frisetti
4 (4)
Attention: beware of SCAMS, TRENDMAESTRO is only ditributed throught MQL5.com market place. note: this indicator is for METATRADER4, if you want the version for METATRADER5 this is the link:  https://www.mql5.com/it/market/product/108106 TRENDMAESTRO ver 2.5 TRENDMAESTRO recognizes a new TREND from the start, he never makes mistakes. The certainty of identifying a new TREND is priceless. DESCRIPTION TRENDMAESTRO identifies a new TREND in the bud, this indicator examines the volatility, volumes a
FFx Engulfing Setup Alerter gives trade suggestions with Entry, Target 1, Target 2 and StopLoss. Below are the different options available: Entry suggestion - pips to be added over the break for the entry 3 different options to calculate the SL - by pips, by ATR multiplier or at the pattern High/Low 3 different options to calculate the 2 TPs - by pips, by ATR multiplier or at Risk/Reward Offset the dashboard - any place on the chart Remove the suggestion once the price reached the SL line Lines
FFx InsideBar Setup Alerter gives trade suggestions with Entry, Target 1, Target 2 and StopLoss. Below are the different options available: Entry suggestion - pips to be added over the break for the entry Minimum candle size - to avoid too close buy/sell entry suggestions 3 different options to calculate the SL - by pips, by ATR multiplier or at the pattern High/Low 3 different options to calculate the 2 TPs - by pips, by ATR multiplier or at Risk/Reward Offset the dashboard - any place on the c
FFx OutsideBar Setup Alerter gives trade suggestions with Entry, Target 1, Target 2 and StopLoss. Below are the different options available: Entry suggestion - pips to be added over the break for the entry. 3 different options to calculate the SL - by pips, by ATR multiplier or at the pattern High/Low. 3 different options to calculate the 2 TPs - by pips, by ATR multiplier or at Risk/Reward. Offset the dashboard - any place on the chart. Remove the suggestion once the price reached the SL line.
FFx PinBar Setup Alerter gives trade suggestions with Entry, Target 1, Target 2 and StopLoss. Below are the different options available: Entry suggestion - pips to be added over the break for the entry Minimum candle size - to avoid too small candles 3 different options to calculate the SL - by pips, by ATR multiplier or at the pattern High/Low 3 different options to calculate the 2 TPs - by pips, by ATR multiplier or at Risk/Reward Offset the dashboard - any place on the chart Remove the sugges
The purpose of this new version of the MT4 standard indicator provided in your platform is to display in a sub-window multiple timeframes of the same indicator with its divergences. See the example shown in the picture below. But the display isn't like a simple MTF indicator. This is the real display of the indicator on its timeframe. Here's the options available in the FFx divergences indicator: Select the timeframes to be displayed (M1 to Monthly) Define the width (number of bars) for each tim
The purpose of this new version of the MT4 standard indicator provided in your platform is to display in a sub-window multiple timeframes of the same indicator with its divergences. See the example shown in the picture below. But the display isn't like a simple MTF indicator. This is the real display of the indicator on its timeframe. Here's the options available in the FFx divergences indicator: Select the timeframes to be displayed (M1 to Monthly). Define the width (number of bars) for each ti
The FFx Dashboard MTF alerter will show you on a single chart all the timeframes (M1 to Monthly) with their own status for the indicator. 2 Alert Options: Single timeframe: each selected timeframe alert separately when a signal occurs Multi timeframes: all selected timeframes must agree for an alert to be triggered Both options have an input to select the timeframes to be used for the alert(s). How to Understand the Status: Green/Red square: histogram above/below 0 line Green square + Red bord
The FFx Dashboard MTF alerter will show you on a single chart all the timeframes (M1 to Monthly) with their own status for the indicator. 2 Alert Options: Single timeframe: each selected timeframe alert separately when a signal occurs Multi timeframes: all selected timeframes must agree for an alert to be triggered Both options have an input to select the timeframes to be used for the alert(s). How to understand the status: Green/Red square: RSI above/below 50 line Green square + Red border: R
The FFx Dashboard MTF alerter will show you on a single chart all the timeframes (M1 to Monthly) with their own status for the indicator. 2 Alert Options: Single timeframe: each selected timeframe alert separately when a signal occurs Multi timeframes: all selected timeframes must agree for an alert to be triggered Both options have an input to select the timeframes to be used for the alert(s). How to understand the status: Green/Red square: Stoch above/below 50 line Green square + Red border:
The FFx Dashboard MTF alerter will show you on a single chart all the timeframes (M1 to Monthly) with their own status for the indicator. 2 Alert Options: Single timeframe: each selected timeframe alert separately when a signal occurs Multi timeframes: all selected timeframes must agree for an alert to be triggered Both options have an input to select the timeframes to be used for the alert(s). How to understand the status: Green/Red square: Price above/below Cloud (Kumo) Green square + Red bo
The FFx Dashboard MTF alerter will show you on a single chart all the timeframes (M1 to Monthly) with their own status for the indicator. 2 Alert Options: Single timeframe: each selected timeframe alert separately when a signal occurs Multi timeframes: all selected timeframes must agree for an alert to be triggered Both options have an input to select the timeframes to be used for the alert(s). How to understand the status: Green/Red square: MA pointing Up/Down Green square + Red border: MA po
The FFx Dashboard MTF alerter will show you on a single chart all the timeframes (M1 to Monthly) with their own status for the indicator. 2 Alert Options: Single timeframe: each selected timeframe alert separately when a signal occurs. Multi timeframes: all selected timeframes must agree for an alert to be triggered. Both options have an input to select the timeframes to be used for the alert(s). How to understand the status: Green square: Price above PSAR Red square: Price below PSAR Options
The FFx Dashboard MTF alerter will show you on a single chart all the timeframes (M1 to Monthly) with their own status for the indicator. 2 Alert Options: Single timeframe: each selected timeframe alert separately when a signal occurs Multi timeframes: all selected timeframes must agree for an alert to be triggered Both options have an input to select the timeframes to be used for the alert(s). How to understand the status: Green/Red square: CCI above/below levels (ie. 100/-100) Grey square: C
The FFx Dashboard MTF alerter will show you on a single chart all the timeframes (M1 to Monthly) with their own status for the indicator. 2 Alert Options: Single timeframe: each selected timeframe alert separately when a signal occurs Multi timeframes: all selected timeframes must agree for an alert to be triggered Both options have an input to select the timeframes to be used for the alert(s). How to understand the status: Green/Red square: ADX above level Grey square: ADX below level Red bor
The FFx Dashboard MTF alerter will show you on a single chart all the timeframes (M1 to Monthly) with their own status. 2 Alert Options: Single timeframe: each selected timeframe alert separately when a signal occurs Multi timeframes: all selected timeframes must agree for an alert to be triggered Both options have an input to select the timeframes to be used for the alert(s). How to understand the status: Green/Red square: bullish/bearish candle Options available in the FFx Dashboard Alerter
The [GRAFF] III manual trading system is based on multiple MetaTrader (MT4) indicators. Together, the entire PACK of GRAFF III indicators makes an advanced trading tool. The system consists of over 20 different custom-built indicators which have been carefully selected and tested in the long term to produce strong and efficient trading signals. The particular indicators are based on different mathematical formulas, so the entire system is calibrated to remove false signals from its own indicator
FFx Universal Strength Meter PRO is more than a basic strength meter. Instead of limiting the calculation to price, it can be based on any of the 19 integrated strength modes + 9 timeframes. With the FFx USM, you are able to define any period for any combination of timeframes. For example, you can set the dashboard for the last 10 candles for M15-H1-H4… Full flexibility! Very easy to interpret... It gives a great idea about which currency is weak and which is strong, so you can find the best pai
Pan PrizMA CD Phase is an analogue of the МetaТrader 5 indicator , and is an option based on the Pan PrizMA indicator. Details . Averaging by a quadric-quartic polynomial increases the smoothness of lines, adds momentum and rhythm. Extrapolation by the sinusoid function near a constant allows adjusting the delay or lead of signals. The value of the phase - wave status parameter (which is close in meaning to the trigonometric phase or the angle of the radius-vector rotation in the trigonometric p
Green Wall Arrows
Daniel Luchinger
1 (1)
The Name Green Wall : Arrows hits a lot of TP, by changing the idea of non using SL as something bad, but instead use Small TP and a lot of free Margin and Patience. Use micro TP and a lot of Free Margin with this indicator on Forex. It also can be used with Binary Options. This strategy is intended to be traded Manually. This Indicator runs on Open Bar, arrows will delete when price are against it. The only Indicator Parameter is Alerts true/false, all the rest is included inside the code. Arro
Golden Monowave is monowave indicator, the monowave theory is one of Elliott wave approach and one of most complicate and accurate method. Golden Monowave can shortcut many major steps to identify and describe the monowave. It works on any timeframe and with any trading instrument, including currencies, indices, futures, etc. Input Parameters initial_Bars - set the initial number of bars to calculate. wave_color - select the color of the wave. label_color - select the color of labels. temp_labe
Ticks Size
Viktor Kolmakov
This indicator displays in a separate window the difference between the number of points which increased the price, and the number of points that decreased the price during the time interval specified in the settings. The time interval for calculation is expressed as the number of bars of the chart the indicator is attached to. This approach allows you to evaluate the movement direction (growth or fall) of the instrument's price, the strength of the movement and the size of the movement in point
MetaTrader 5 version available here : https://www.mql5.com/en/market/product/24882 FFx Basket Scanner is a global tool scanning all pairs and all timeframes over up to five indicators among the 16 available. You will clearly see which currencies to avoid trading and which ones to focus on. Once a currency goes into an extreme zone (e.g. 20/80%), you can trade the whole basket with great confidence. Another way to use it is to look at two currencies (weak vs strong) to find the best single pairs
NostradamusMT4
Andrey Spiridonov
1 (1)
NostradamusMT4 is a powerful indicator from the set of professional trader. The indicator is based on Andrei Spiridonov's original price calculation method (ESTIMATED PRICE) for the current candle price. Advantages The indicator does not redraw. It works on any timeframes. Works with any trading instruments. Perfectly suitable for scalping and trading binary options. Parameters Color - color of the ESTIMATED PRICE FUTURE line. How to work with the indicator The indicator forms the ESTIMATED P
MetaTrader 5 version available here: https://www.mql5.com/en/market/product/25794 FFx Pivot SR Suite PRO is a complete suite for support and resistance levels. Support and Resistance are the most used levels in all kinds of trading. Can be used to find reversal trend, to set targets and stop, etc. The indicator is fully flexible directly from the chart 4 periods to choose for the calculation: 4Hours, Daily, Weekly and Monthly 4 formulas to choose for the calculation: Classic, Camarilla, Fibonac
BinaryIndicator is a highly accurate indicator for trading binary options. It shows excellent results in scalping. This indicator is based in multifactor analysis of trend indicators, as well as confirmation oscillators, which in the end gives an increased accuracy of signals. Advantages of the indicator Increased accuracy of signals. Excellent results when trading binary options with a short expiration time from M30 to M1 . It works on any timeframes. Works with any trade symbols. Parameters
Yazarın diğer ürünleri
Golden jungle
Takafumi Morishita
for xau/usd marthingale expert adviser. ・The initial lot is carefully selected for both buying and selling. ・When there is a large price movement, or there is a trend, we do not have a new position. ・Nanping also does not have a new  positions when there is a trend or there is a sudden change (when it rises or falls). ・Separately setting for buying and selling can use,(for example  Nanpin ratio, Nanpin Interval, Nanpin Interval_add,and profit take method.) «two type of profit take method» 1) s
Glacier Crown MT4
Takafumi Morishita
GLACIER CROWN — net sınırlar üzerine kurulmuş bir GBPCHF grid EA'sı. GLACIER CROWN, GBPCHF'de M5 grafiğinde işlem yapar. Giriş filtreleri uyuştuğunda küçük bir ilk pozisyon açar ve yalnızca fiyat ters giderse giderek artan aralıklarla pozisyon ekler. Sepetin tamamı ortalama fiyattan ölçülen bir iz süren stop ile kapatılır. Sepetlerin çoğu erken kapanır. Geriye dönük testte kârla kapanışların %96'sı 2 veya daha az pozisyonla gerçekleşti, medyan tutma süresi yaklaşık 3,4 saatti ve sepetlerin %77's
Alpine Mirror MT4
Takafumi Morishita
ALPINE MIRROR — sabit sınırları olan sakin bir EURCHF grid EA'sı. ALPINE MIRROR, EURCHF'de M5 grafiğinde işlem yapar. EURCHF sık sık dar aralıklarda hareket eder; bu, iz süren çıkışlı bir grid için uygundur. EA, giriş filtreleri uyuştuğunda küçük bir ilk pozisyon açar ve yalnızca fiyat ters giderse giderek artan aralıklarla pozisyon ekler. Sepetin tamamı ortalama fiyattan ölçülen bir iz süren stop ile kapatılır. Risk sınırları (varsayılan değerler) Her yönde en fazla 10 pozisyon; en büyük pozisy
Dual Aurora MT4
Takafumi Morishita
DUAL AURORA — geniş adımlı, sabırlı bir NZDCAD gridi. DUAL AURORA, NZDCAD'de M5 grafiğinde işlem yapar. NZDCAD, iki emtia para biriminden oluşan ve sıklıkla geniş bir aralıkta hareket eden bir paritedir. DUAL AURORA pozisyonlar arasında geniş mesafeler (yaklaşık 200 pip) kullanır; bu yüzden nadiren ekleme yapar ve fiyatın geri gelmesini bekler. Geriye dönük test (MT5, NZDCAD M5, her tik, 10.000 USD, 1:100) Dönem 2017.01 – 2026.10: net kâr +4.184 USD, kâr faktörü 2,28 2017'den 2026'ya her takvim
Golden Eclipse MT4
Takafumi Morishita
GOLDEN ECLIPSE — oynaklığa göre ayarlanan bir altın gridi. Altın sakin bir günde birkaç dolar, hareketli bir günde onlarca dolar hareket edebilir. Bir yıl işe yarayan sabit pip mesafeleri ertesi yıl çoğu zaman işe yaramaz. GOLDEN ECLIPSE günlük oynaklığı ölçer ve ekleme mesafelerini ve iz süren çıkışı buna göre belirler: altın oynakken grid genişler, sakinken daralır. Geriye dönük test (MT5, XAUUSD M5, her tik, 10.000 USD, 1:100, ilk lot 0,01) Dönem 2021.01 – 2026.10: net kâr +2.301 USD, kâr fak
Glacier Crown MT5
Takafumi Morishita
GLACIER CROWN — net sınırlar üzerine kurulmuş bir GBPCHF grid EA'sı. GLACIER CROWN, GBPCHF'de M5 grafiğinde işlem yapar. Giriş filtreleri uyuştuğunda küçük bir ilk pozisyon açar ve yalnızca fiyat ters giderse giderek artan aralıklarla pozisyon ekler. Sepetin tamamı ortalama fiyattan ölçülen bir iz süren stop ile kapatılır. Sepetlerin çoğu erken kapanır. Geriye dönük testte kârla kapanışların %96'sı 2 veya daha az pozisyonla gerçekleşti, medyan tutma süresi yaklaşık 3,4 saatti ve sepetlerin %77's
Alpine Mirror MT5
Takafumi Morishita
ALPINE MIRROR — sabit sınırları olan sakin bir EURCHF grid EA'sı. ALPINE MIRROR, EURCHF'de M5 grafiğinde işlem yapar. EURCHF sık sık dar aralıklarda hareket eder; bu, iz süren çıkışlı bir grid için uygundur. EA, giriş filtreleri uyuştuğunda küçük bir ilk pozisyon açar ve yalnızca fiyat ters giderse giderek artan aralıklarla pozisyon ekler. Sepetin tamamı ortalama fiyattan ölçülen bir iz süren stop ile kapatılır. Risk sınırları (varsayılan değerler) Her yönde en fazla 10 pozisyon; en büyük pozisy
Dual Aurora MT5
Takafumi Morishita
DUAL AURORA — geniş adımlı, sabırlı bir NZDCAD gridi. DUAL AURORA, NZDCAD'de M5 grafiğinde işlem yapar. NZDCAD, iki emtia para biriminden oluşan ve sıklıkla geniş bir aralıkta hareket eden bir paritedir. DUAL AURORA pozisyonlar arasında geniş mesafeler (yaklaşık 200 pip) kullanır; bu yüzden nadiren ekleme yapar ve fiyatın geri gelmesini bekler. Geriye dönük test (MT5, NZDCAD M5, her tik, 10.000 USD, 1:100) Dönem 2017.01 – 2026.10: net kâr +4.184 USD, kâr faktörü 2,28 2017'den 2026'ya her takvim
Golden Eclipse MT5
Takafumi Morishita
GOLDEN ECLIPSE — oynaklığa göre ayarlanan bir altın gridi. Altın sakin bir günde birkaç dolar, hareketli bir günde onlarca dolar hareket edebilir. Bir yıl işe yarayan sabit pip mesafeleri ertesi yıl çoğu zaman işe yaramaz. GOLDEN ECLIPSE günlük oynaklığı ölçer ve ekleme mesafelerini ve iz süren çıkışı buna göre belirler: altın oynakken grid genişler, sakinken daralır. Geriye dönük test (MT5, XAUUSD M5, her tik, 10.000 USD, 1:100, ilk lot 0,01) Dönem 2021.01 – 2026.10: net kâr +2.301 USD, kâr fak
LIGHTHOUSE — piyasa yapısını bir bakışta görün. Yeniden çizim yok. LIGHTHOUSE, fiyat yapısını onaylanmış salınım noktalarından okur ve grafikte sade, anlaşılır biçimde gösterir. Her takdire dayalı yatırımcının girişten önce sorduğu üç soruyu yanıtlar: Üst zaman dilimi hangi yöne gidiyor? Mevcut grafik hangi yöne gidiyor? Önemli fiyat seviyeleri nerede? Karar destek aracıdır. İşlem açmaz ve fiyat tahmini yapmaz. Neden "LIGHTHOUSE" (deniz feneri)? Deniz feneri gemilere yolu gösterir ve kayalıkları
Filtrele:
Değerlendirme yok
Değerlendirmeye yanıt