Lighthouse Market Structure MT4

LIGHTHOUSE — 相場の構造がひと目でわかる。リペイントなし。

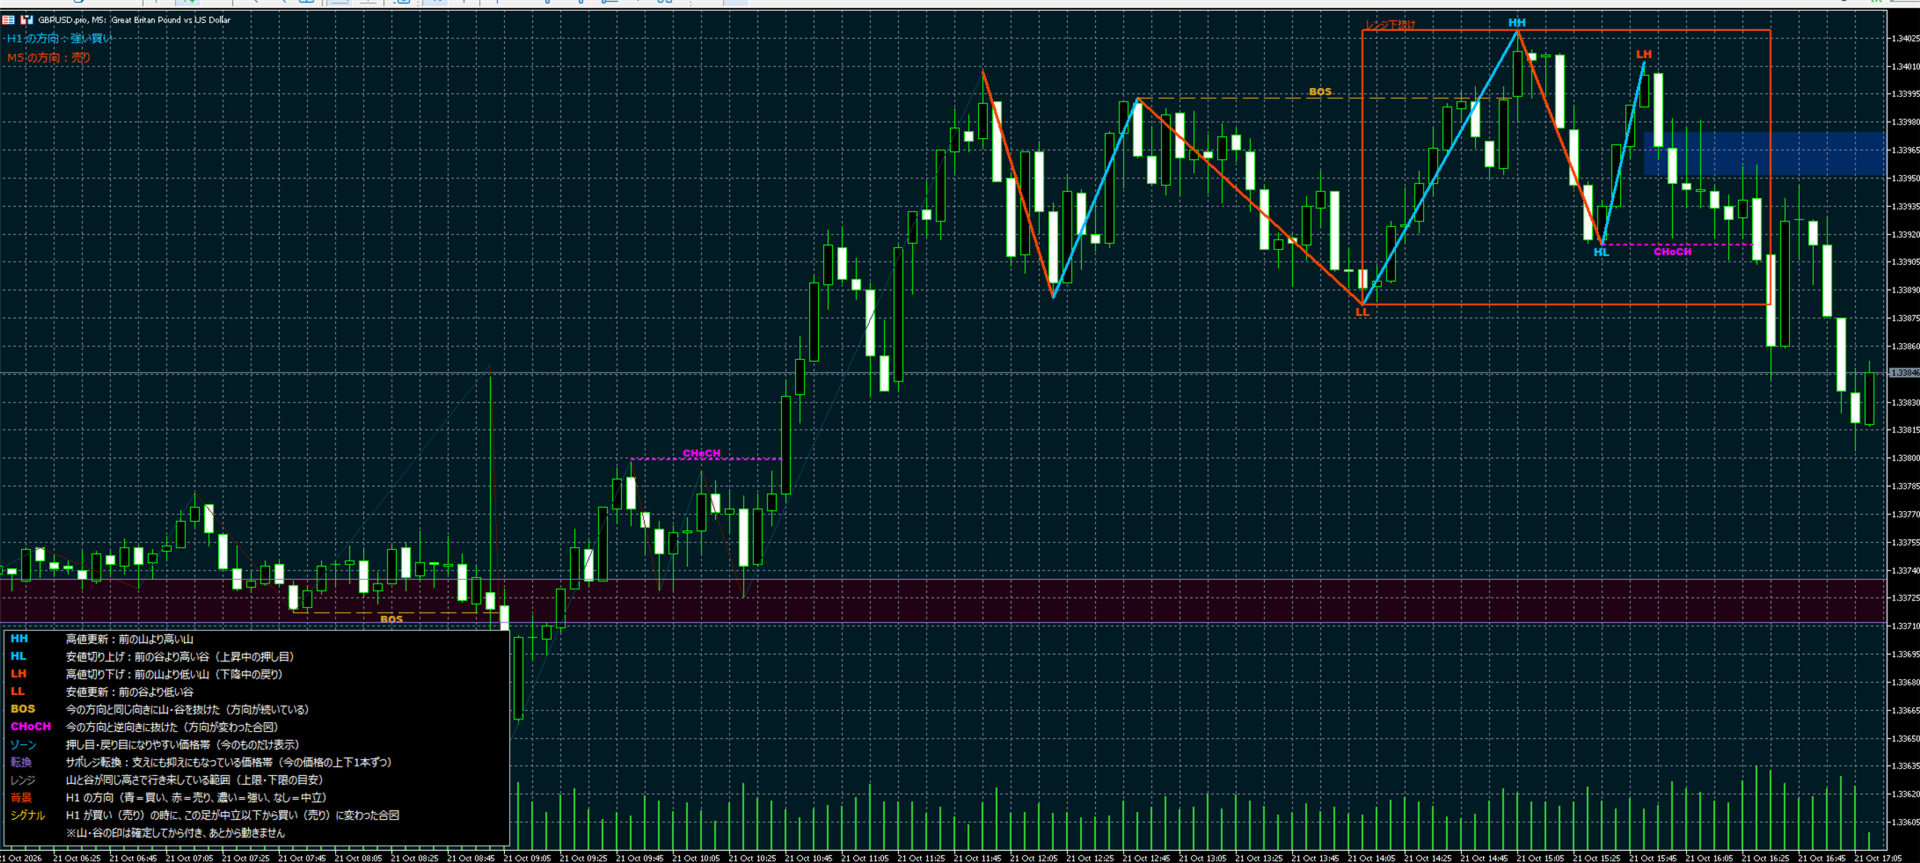
LIGHTHOUSE は、確定した山と谷から相場の構造を読み取り、チャートにすっきり表示します。エントリー前に誰もが確かめたい3つのこと、「上位足はどちら向きか」「今のチャートはどちら向きか」「大事な価格はどこか」に答えます。
裁量の判断を助けるツールです。売買はせず、価格の予想もしません。

なぜ「LIGHTHOUSE(灯台)」?
灯台は船に進む道と岩場を知らせますが、舵を取るのは船長です。LIGHTHOUSE もチャートの上で、相場の方向と反応しやすい価格帯を示します。判断はあなた自身のものです。

しくみ

  • 山・谷は足が確定してから付けます。一度付いた印は動いたり消えたりしません。
  • 構造の抜けはヒゲではなく終値で判定します。
  • 方向は「最後に終値で抜けた向き」と「直近2つの山・谷の並び」(ダウ理論)で決めます。
  • 同じ判定を上位足(初期値 H1)にも使います。

主な機能

  • 5段階の方向:強い買い・買い・中立・売り・強い売り(上位足と今のチャートの両方)。
  • HH・HL・LH・LL の印と2色のジグザグ。
  • BOS(方向の継続)と CHoCH(方向の転換)の線。
  • 今の波の押し目・戻り目ゾーンを1つ表示。
  • サポレジ転換帯:支えにも抑えにもなった狭い価格帯を、今の価格の上下に1本ずつ。抜けた帯は薄くなります。
  • レンジの箱:山と谷が同じ高さで続く時に表示し、抜けると色が変わります(上抜け青、下抜け赤)。
  • 方向がそろったサイン:上位足が買い以上の時に、今のチャートが中立以下から買い以上に変わると、パネルに時刻付きの「買いサイン」を表示。売りも同じです。
  • サイン・BOS・CHoCH のポップアップとプッシュ通知(それぞれON/OFF可)。
  • 用語ガイド付き、表示量は3段階(シンプル・標準・すべて)。
  • 軽い:過去分は1回だけ計算し、あとは新しい確定足だけを処理します。

使い方の例

  • 上位足に逆らうトレードを避ける。
  • サポレジ転換帯と合わせて、レンジの端を狙う。
  • 過去の BOS/CHoCH の線や帯で、利確の目安を決める。

おすすめの設定

  • M5 と上位足 H1 で開発・確認しました(EURUSD、GBPUSD、USDJPY、XAUUSD)。
  • どの銘柄・時間足でも使えます。M15 なら上位足 H4 が自然です。

主な設定

  • 上位足と本数、山・谷の確定本数、計算する本数、表示量
  • 太く描く波・印の数、色、線の太さ、文字サイズ、用語ガイド
  • サポレジ転換帯の設定、レンジの箱の設定
  • サイン・BOS・CHoCH の通知、プッシュ通知

ご注意

  • 分析ツールです。注文や決済はしません。
  • どのインジケーターも将来の結果を保証しません。まずデモ口座でお試しください。
  • ご質問はコメント欄か MQL5 のメッセージでどうぞ。
おすすめのプロダクト
POWER FLOW PRO — Binary Options Edition For the first time ever, the POWER FLOW PRO cumulative dominance logic is specially optimized for Binary Options trading. POWER FLOW PRO is a smart real-time pressure-flow indicator designed to detect aggressive market momentum and short-term directional dominance for fast Binary Options entries. The system analyzes: Real-time buying pressure Real-time selling pressure Momentum candle strength Cumulative dominance flow Continuation pressure to generate hig
Dear Trader It is my pleasure to introduce to you my tool called the " Forex Sniper Indicator" . The major aim of this tool is to help serious traders and investors in all type of Financial Markets to catch price next movement right at the moment the price direction is about to change. This tool can be used to snipe the price direction in both down trend, uptrend and ranging markets. This tool can be used as the stand alone tool though it may be combined with other tools as well. My goal is to h
フィボナッチ・トレンド・マーカー (Fibonacci Trend Marker) は、現在のローソク足が過去のローソク足の高値-安値(High-Low、HL)範囲に対してどのように振る舞うかを、フィボナッチ・リトレースメントレベルを用いて分析するトレンド指標です。トレンドの強さを視覚的に追跡し、ローソク足の色の変化を通じてトレンドの弱まりや反転の可能性を示します。 特徴: トレンド重視のトレーダーのために設計されており、フィボナッチレベルに基づいてトレンドの変化を素早く検出します。 市場のボラティリティが十分で、3~5本のローソク足が明確な動きを形成する場合、あらゆる時間枠で有効です。 ローソク足のサイズはチャートのスケールに自動的に適応し、ズーム時にも正確な表示を保証します。 現在のローソク足をリアルタイムで分析することでトレンド変化に高い感度を持ち、M1やM5の時間枠でのスキャルピングに最適です。 取引方法: エントリー: 前の閉じたローソク足の色が変化した後にポジションを開きます。例えば、赤いローソク足の後に青で閉じた場合、上昇トレンドのシグナルとなり、買い(Buy)の取引

Currency Strength Table HYBRID v1.33   - Professional Multi-Timeframe Currency Strength Analyzer (PRO) BREAKTHROUGH CURRENCY ANALYSIS SOLUTION FOR SERIOUS FOREX TRADERS!  *Note: Most suitable for Professionals, Advanced & Intermediate traders!   * ADDITIONAL BONUS:   Rent for 3months and get a free ex.4 dual switch momentum (RSI+Prcie/Bid Ratio) Currency Bar Meter . See attached screenshot 6 .  Limited offer (first 50 purchases). The Ultimate All-In-One Currency Strength Dashboard EXPLAINED. St
F ully automated Expert Advisor using the  advanced   algorithm for trading the EURUSD Designed for profit in a short period of time and big profit in a long run. Prefers EURUSD 1H. Principle of operation The SELL and BUY orders are opened (depending on the parameters set), guided by signals and the market situation.     Recommended parameter: Use an ECN broker account. minimum deposit of 100$ USD. use it in H1 time frame recommended symbol is EURUSD input parameter: TrendType                 
Expert.   Automatic and manual trading. Ready-made trading system based on   Elliott waves   and Fibonacci retracement levels . It is simple and affordable. Display of the marking of Elliott waves (main or alternative option) on the chart. Construction of horizontal levels, support and resistance lines, a channel. Superposition of Fibonacci levels on waves 1, 3, 5, A Alert system (on-screen, E-Mail, Push notifications).    visual panel for opening orders in manual trading. visual panel for sett
Alphabet AI は、平均回帰戦略を採用したアドバイザーです。これは、市場が大きな変動をした後、平均値に戻るという自然な性質を利用することを意味します。このアルゴリズムは、資産の現在の価格を常に分析し、計算された平均レベルと比較します。価格が平均値から大きく乖離すると、アドバイザーはこれを行動のシグナルと解釈します。上限を超えた場合は、価格の下落を期待してショートポジションを開き、下限を下回ると、上昇を期待してロングポジションを開きます。当社のアドバイザーの特徴は、チャネルの境界を決定し、誤ったシグナルをフィルタリングする適応型アプローチにあります。これにより、緩やかなトレンドの状況でも効果的に機能します。このアドバイザーは、価格チャネル内で顕著な変動を示す通貨ペアで特に優れたパフォーマンスを発揮します。 アドバイザーは 20 年以上にわたってデータに基づいてテストされており、その間、最も不安定な期間にも耐えることができます。 コンピュータを 24 時間 365 日稼働し続ける機会がない場合は、VPS サーバー サービスを使用することをお勧めします。 このアドバイザーは、ドロー
TPO Profile MT4
Kyra Nickaline Watson-gordon
5 (1)
Definition : TPO is a Time Price Opportunity. Instead of using bars or candles with an Open, High, Low, and Close price, each "bar" in a Market Profile is represented by horizontal bars against the price It is called Market Profile terminology. In other words time-price-opportunity (TPO) profiles are histograms of how much time was spent at each price within the span of the profile. By using a TPO chart, you are able to analyze the amount of trading activity, based on time, for each price level
Indicator which identifies Trend and also buy/sell opportunities. Use for entries aligned to the Trend.  Although Diamond Trend is very accurate identifying entry points, it is always recommended to use a support indicator in order to reconfirm the operation. Remind to look for those Assets and Timeframes which best fit to your trader behavior/need... Valid for Scalping and Long Term operations. Please, set up a Bars Chart to be able to visualize the indicator properly...  ...And remind to give
We are pleased to present to you, our new product, this is the next step in the development of automated trading in the Forex market. This is a revolutionary algorithm developed by our team of programmers. Here all the accumulated experience for 10 years of work in the Forex market is gathered. The adviser uses several strategies for different stages of the market (Trend, Flat, Volatile market or Very weak). The algorithm passed all testing with different brokers, at different quotes. Advisor is
Milch Cow Harmonic EA "Tool designed to trade 28 currency pairs according to 88 harmonic patterns plus one customized according to your parameters The expert graph interface guides you to the pattern names when passing over the pattern circle You can activate or disable any number of currency pairs and patterns for your trade by clicking on the currency pair circle or the harmonic pattern (green = activate    red = disable) You can set more than one time frame within which the expert will look f
This indicator is named so for a reason, because it will show the reverse side of the market. It has several math indicators built in that are tuned to show the best signals for currency pairs! Ideally proved to be in work on the M5-M15 no more and no less! Only at the same time it shows up to 86.5% of correct signals! The settings include the colors of the arrows, the alert, and the same parameters so that you can reconfigure the indicator and trade on cryptocurrency and raw materials! If
MQL4 LOWER ENTRY AND UPPER ENTRY IN ZIGZAG 1.- ENTRIES AT THE HIGHEST POINT OF THE ZIGZAG INDICATOR WHEN YOU BUY (EXTREMUM HIGH) AND AT THE LOWEST POINT OF THE ZIGZAG INDICATOR WHEN YOU SELL (EXTREMUM LOW), MANUALLY ADDING THE LOTS, SLIPPAGE, STOP LOSS AND TAKE PROFIT, IT COMES WITH AN ALERT AND A SOUND WHEN THE ROBOT ADD THE PENDING OPERATION. 2.- YOU CAN DECIDE BY TRUE OR FALSE IF YOU WANT THE PENDING ORDERS TO BE MODIFIED IF A NEW ZIGZAG IS MADE AT A HIGHER POINT WHEN YOU ARE SELLING OR A NEW
The arrows are calculated with: -     2 Parabolic  parameters -     2 ADX parameters -     4 Stochastic parameters We recommend to combine it with Parabolic, ZigZag or Elliot waves indicator. Always trade the trend! If you make sure to draw your trend lines and support/resistance zones you will just have to wait for the signal to appear. Take the trade. For Binary Options it is advisable to set the expiry time to 5-15 min in M1 chart. THIS INDICATOR IS ZERO REPAINT Best assets to trade: - EUR
New York AM Session Profile NY AM Session Profiling Framework | Non-Repainting | Real-Time | FX & Index Presets | MT5 Version Available Full Setup Guide & Strategy Playbook: https://www.mql5.com/en/blogs/post/771380 MT5 Version: https://www.mql5.com/en/market/product/180798 Indicator Overview The New York AM Session Profile framework is a   professional market-structure visualization tool   designed for traders who study liquidity, session behaviour, and institutional price delivery. Instead
Project IG MT4
Ruslan Pishun
1.78 (9)
The EA is not a scalper. The EA uses a strategy based on the breakdown of local support and resistance levels, also uses the reverse and rebound from support and resistance levels.  The EA is based on the original author's strategy. Real monitoring:   https://www.mql5.com/en/signals/author/profi_mql Detailed description of the strategy here:  https://www.mql5.com/ru/blogs/post/728430 This is a link for general discussion of the EA:  https://www.mql5.com/ru/blogs/post/728430 Hidden Take profit,
Rtc ML Ai | Predictor CORE MACHINE LEARNING ENGINE Adaptive ML Market Predictor – Multi-Bar Trend & Candle Forecast What This Indicator Does This indicator is a  real-time market prediction engine  designed to analyze price behavior and estimate  future market tendencies . Unlike conventional indicators, this system  does not rely on static parameters or historical curve-fitting , but adapts its internal state dynamically during live market operation. Instead of using static rules, the indic
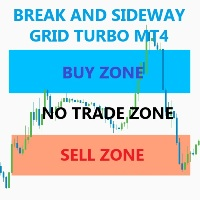
The EA trades when momentum reach more volume factor . Any pair, time frame any broker no limited, recommend minimum deposit 500$ SETTING Symbol - Name of pair (ex.EURUSD#) Breakout_factor - Volume peak factor (Recommend for forex use 0.5-1.5). Sideway_factor - Volume low factor ( Recommend for  forex use 0.1-0.5). Lots - start lot. Max_lots -    maximum lot. Grid_boost -  Frequency of opening position (Less more order). Grid_minimum_pips - Check distance grid from last order. TP_pips - take pr
FREE
Supply and Demand Tracker MT4  US PPI, Fed Interest Rates, and FOMC Trade Setup Time Lapse: U.S. dollar(DXY) and Australian dollar vs U.S. dollar(AUD/USD) https://youtu.be/XVJqdEWfv6s  May CPI Trade Setup Time Lapse: Gold, Euro/US dollar, US Tech 100, and USDX Experience the power of our cutting-edge supply and demand system as we delve into the captivating world of market dynamics surrounding the release of the consumer price index (CPI). Our system, built on the principles of supply and deman
The EA’s unique algorithm calculates the average price (reflected in the form of a trend line on the chart), which is the center of price attraction in the framework of the traded timeframe. At times of increasing volatility, the adviser begins work with the goal of fixing profit in the region of the center of attraction of the price. Advisor does not use dangerous trading methods. It is recommended to install a trading expert on a remote server (VPS). Recommended Trading Instruments (TF 5M)
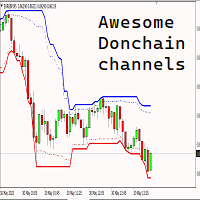
Introducing the Donchian Channels indicator for MQL4, a powerful technical analysis tool designed to boost your trading success. This indicator consists of four lines that represent the upper and lower boundaries of price movement over a specified period. With the Donchian Channels indicator, you can easily identify potential breakouts and reversals in the market. The upper line shows the highest high of the specified period, while the lower line represents the lowest low. The space between thes
Introducing the River Flow Divergence Indicator Are you ready to unlock your trading potential? Meet the River Flow Divergence Indicator, a powerful tool designed to help you navigate market trends and reversals with precision. This indicator is tailored for traders who are eager to fine-tune their strategies and take control of their success. Note: This indicator is not optimized out of the box. It’s crafted for you to customize and optimize according to your unique trading style and goals. Ho
Magic EA MT4
Kyra Nickaline Watson-gordon
3 (1)
Magic EA is an Expert Advisor based on Scalping, Elliot Waves and with filters such as RSI, Stochastic and 3 other strategies managed and decided with the robot smartly. Large number of inputs and settings are tested and optimized and embedded in the program thus inputs are limited and very simple. Using EA doesn't need any professional information or Forex Trading Knowledge. EA can trade on all symbols and all time frames, using special and unique strategies developed by the author. The EA wo
Gold Strike Predator
Ignacio Agustin Mene Franco
GoldStrike Predator – Professional Expert Advisor for XAUUSD GoldStrike Predator is an advanced, high-precision Expert Advisor (EA) designed exclusively for trading the XAUUSD pair (Gold vs. US Dollar) on the MetaTrader 4 platform. Developed with a sophisticated hybrid architecture, it combines multiple layers of technical and predictive analysis to identify high-probability opportunities in the gold market, one of the world's most volatile and profitable instruments. Trading Strategy The sys
QuantEx Pivot Indicator
Savia Forex Software Solutions
QuantEx Pivot Indicator is a practical MT4 technical analysis tool designed to help traders identify important Fibonacci-based pivot, support, and resistance levels directly on the chart. The indicator monitors price action and plots key levels using a structured calculation framework, giving traders a clearer view of potential reaction zones across different market conditions. QuantEx Pivot Indicator can be used on compatible currency pairs, indices, commodities, stocks, metals, and cryptocurre
HighScalpel
Ivan Simonika
5 (1)
Introducing the HighScalpel scalping system. It is enough to optimize once, for example, per month. After that, he shows excellent results on the forward period (several times larger), which can be seen in the screenshots. Be attentive to the spread indicators of your broker! The higher the spread, the less often the market entries. If the spread is above 20 pips, then the number of inputs falls by two orders of magnitude. It is ideal to use a broker with a floating spread of 6 pips. Such bro
Ruby Scalper EA MT4
Telio Ivan Ezequiel Macie
# Ruby Scalper EA – Automated Trading Robot Ruby Scalper EA is designed for traders who want an automated tool that follows structured trading rules with speed and precision. The system applies a multi-timeframe confirmation process, where entries are aligned across different timeframes for additional confluence. It can be applied to multiple markets, though it has been most frequently used on **Gold (XAU/USD)** on the 1-minute chart with the default settings. --- ### Key Features * **Multi
Indicator for binary options arrow is easy to use and does not require configuration works on all currency pairs, cryptocurrencies buy signal blue up arrow sell signal red down arrow tips do not trade during news and 15-30 minutes before their release, as the market is too volatile and there is a lot of noise it is worth entering trades one or two candles from the current period (recommended for 1 candle) timeframe up to m 15 recommended money management fixed lot or fixed percentage of the depo
Know the direction. Know the plan. Know when to stand aside. CS Trend Pro turns a busy chart into a clear decision. It shows which way the market is moving and marks the moment that changes. With every signal it gives you a complete plan: where to enter, where the idea is wrong, and where to take profit. It is built for swing traders and scalpers who move with the swing: take a part of the profit at each target, and stay in for as long as the move lasts. Built on volatility and on support and re
このプロダクトを購入した人は以下も購入しています
Miraculous Indicator Binary & Forex v3 StrategySafe Miraculous Indicator Binary & Forex v3 StrategySafe は、明確なシグナル、強力な確認ツール、そして Binary と Forex 市場で使える体系的な取引アプローチを求めるトレーダー向けのプロフェッショナル指標です。 v3 では、MIR Dashboard、Miraculous Confirmation Dashboard、GANN Law、Square of 9 レベル、GANN 角度、そしてより高度な Forex モードが搭載されています。 主な特徴 Binary と Forex の両方に対応。 MIR Dashboard による素早い市場分析。 Miraculous Confirmation Dashboard によるエントリー確認。 Forex 分析用の GANN Law drawing lines。 Square of 9 のライン、レベル、方向表示。 1x1 GANN Angle によるトレンド圧力の確認。 Entry I
TrendMaestro
Stefano Frisetti
4 (4)
Attention: beware of SCAMS, TRENDMAESTRO is only ditributed throught MQL5.com market place. note: this indicator is for METATRADER4, if you want the version for METATRADER5 this is the link:  https://www.mql5.com/it/market/product/108106 TRENDMAESTRO ver 2.5 TRENDMAESTRO recognizes a new TREND from the start, he never makes mistakes. The certainty of identifying a new TREND is priceless. DESCRIPTION TRENDMAESTRO identifies a new TREND in the bud, this indicator examines the volatility, volumes a
FFx Engulfing Setup Alerter gives trade suggestions with Entry, Target 1, Target 2 and StopLoss. Below are the different options available: Entry suggestion - pips to be added over the break for the entry 3 different options to calculate the SL - by pips, by ATR multiplier or at the pattern High/Low 3 different options to calculate the 2 TPs - by pips, by ATR multiplier or at Risk/Reward Offset the dashboard - any place on the chart Remove the suggestion once the price reached the SL line Lines
FFx InsideBar Setup Alerter gives trade suggestions with Entry, Target 1, Target 2 and StopLoss. Below are the different options available: Entry suggestion - pips to be added over the break for the entry Minimum candle size - to avoid too close buy/sell entry suggestions 3 different options to calculate the SL - by pips, by ATR multiplier or at the pattern High/Low 3 different options to calculate the 2 TPs - by pips, by ATR multiplier or at Risk/Reward Offset the dashboard - any place on the c
FFx OutsideBar Setup Alerter gives trade suggestions with Entry, Target 1, Target 2 and StopLoss. Below are the different options available: Entry suggestion - pips to be added over the break for the entry. 3 different options to calculate the SL - by pips, by ATR multiplier or at the pattern High/Low. 3 different options to calculate the 2 TPs - by pips, by ATR multiplier or at Risk/Reward. Offset the dashboard - any place on the chart. Remove the suggestion once the price reached the SL line.
FFx PinBar Setup Alerter gives trade suggestions with Entry, Target 1, Target 2 and StopLoss. Below are the different options available: Entry suggestion - pips to be added over the break for the entry Minimum candle size - to avoid too small candles 3 different options to calculate the SL - by pips, by ATR multiplier or at the pattern High/Low 3 different options to calculate the 2 TPs - by pips, by ATR multiplier or at Risk/Reward Offset the dashboard - any place on the chart Remove the sugges
The purpose of this new version of the MT4 standard indicator provided in your platform is to display in a sub-window multiple timeframes of the same indicator with its divergences. See the example shown in the picture below. But the display isn't like a simple MTF indicator. This is the real display of the indicator on its timeframe. Here's the options available in the FFx divergences indicator: Select the timeframes to be displayed (M1 to Monthly) Define the width (number of bars) for each tim
The purpose of this new version of the MT4 standard indicator provided in your platform is to display in a sub-window multiple timeframes of the same indicator with its divergences. See the example shown in the picture below. But the display isn't like a simple MTF indicator. This is the real display of the indicator on its timeframe. Here's the options available in the FFx divergences indicator: Select the timeframes to be displayed (M1 to Monthly). Define the width (number of bars) for each ti
The FFx Dashboard MTF alerter will show you on a single chart all the timeframes (M1 to Monthly) with their own status for the indicator. 2 Alert Options: Single timeframe: each selected timeframe alert separately when a signal occurs Multi timeframes: all selected timeframes must agree for an alert to be triggered Both options have an input to select the timeframes to be used for the alert(s). How to Understand the Status: Green/Red square: histogram above/below 0 line Green square + Red bord
The FFx Dashboard MTF alerter will show you on a single chart all the timeframes (M1 to Monthly) with their own status for the indicator. 2 Alert Options: Single timeframe: each selected timeframe alert separately when a signal occurs Multi timeframes: all selected timeframes must agree for an alert to be triggered Both options have an input to select the timeframes to be used for the alert(s). How to understand the status: Green/Red square: RSI above/below 50 line Green square + Red border: R
The FFx Dashboard MTF alerter will show you on a single chart all the timeframes (M1 to Monthly) with their own status for the indicator. 2 Alert Options: Single timeframe: each selected timeframe alert separately when a signal occurs Multi timeframes: all selected timeframes must agree for an alert to be triggered Both options have an input to select the timeframes to be used for the alert(s). How to understand the status: Green/Red square: Stoch above/below 50 line Green square + Red border:
The FFx Dashboard MTF alerter will show you on a single chart all the timeframes (M1 to Monthly) with their own status for the indicator. 2 Alert Options: Single timeframe: each selected timeframe alert separately when a signal occurs Multi timeframes: all selected timeframes must agree for an alert to be triggered Both options have an input to select the timeframes to be used for the alert(s). How to understand the status: Green/Red square: Price above/below Cloud (Kumo) Green square + Red bo
The FFx Dashboard MTF alerter will show you on a single chart all the timeframes (M1 to Monthly) with their own status for the indicator. 2 Alert Options: Single timeframe: each selected timeframe alert separately when a signal occurs Multi timeframes: all selected timeframes must agree for an alert to be triggered Both options have an input to select the timeframes to be used for the alert(s). How to understand the status: Green/Red square: MA pointing Up/Down Green square + Red border: MA po
The FFx Dashboard MTF alerter will show you on a single chart all the timeframes (M1 to Monthly) with their own status for the indicator. 2 Alert Options: Single timeframe: each selected timeframe alert separately when a signal occurs. Multi timeframes: all selected timeframes must agree for an alert to be triggered. Both options have an input to select the timeframes to be used for the alert(s). How to understand the status: Green square: Price above PSAR Red square: Price below PSAR Options
The FFx Dashboard MTF alerter will show you on a single chart all the timeframes (M1 to Monthly) with their own status for the indicator. 2 Alert Options: Single timeframe: each selected timeframe alert separately when a signal occurs Multi timeframes: all selected timeframes must agree for an alert to be triggered Both options have an input to select the timeframes to be used for the alert(s). How to understand the status: Green/Red square: CCI above/below levels (ie. 100/-100) Grey square: C
The FFx Dashboard MTF alerter will show you on a single chart all the timeframes (M1 to Monthly) with their own status for the indicator. 2 Alert Options: Single timeframe: each selected timeframe alert separately when a signal occurs Multi timeframes: all selected timeframes must agree for an alert to be triggered Both options have an input to select the timeframes to be used for the alert(s). How to understand the status: Green/Red square: ADX above level Grey square: ADX below level Red bor
The FFx Dashboard MTF alerter will show you on a single chart all the timeframes (M1 to Monthly) with their own status. 2 Alert Options: Single timeframe: each selected timeframe alert separately when a signal occurs Multi timeframes: all selected timeframes must agree for an alert to be triggered Both options have an input to select the timeframes to be used for the alert(s). How to understand the status: Green/Red square: bullish/bearish candle Options available in the FFx Dashboard Alerter
The [GRAFF] III manual trading system is based on multiple MetaTrader (MT4) indicators. Together, the entire PACK of GRAFF III indicators makes an advanced trading tool. The system consists of over 20 different custom-built indicators which have been carefully selected and tested in the long term to produce strong and efficient trading signals. The particular indicators are based on different mathematical formulas, so the entire system is calibrated to remove false signals from its own indicator
FFx Universal Strength Meter PRO is more than a basic strength meter. Instead of limiting the calculation to price, it can be based on any of the 19 integrated strength modes + 9 timeframes. With the FFx USM, you are able to define any period for any combination of timeframes. For example, you can set the dashboard for the last 10 candles for M15-H1-H4… Full flexibility! Very easy to interpret... It gives a great idea about which currency is weak and which is strong, so you can find the best pai
Pan PrizMA CD Phase is an analogue of the МetaТrader 5 indicator , and is an option based on the Pan PrizMA indicator. Details . Averaging by a quadric-quartic polynomial increases the smoothness of lines, adds momentum and rhythm. Extrapolation by the sinusoid function near a constant allows adjusting the delay or lead of signals. The value of the phase - wave status parameter (which is close in meaning to the trigonometric phase or the angle of the radius-vector rotation in the trigonometric p
The Name Green Wall : Arrows hits a lot of TP, by changing the idea of non using SL as something bad, but instead use Small TP and a lot of free Margin and Patience. Use micro TP and a lot of Free Margin with this indicator on Forex. It also can be used with Binary Options. This strategy is intended to be traded Manually. This Indicator runs on Open Bar, arrows will delete when price are against it. The only Indicator Parameter is Alerts true/false, all the rest is included inside the code. Arro
Golden Monowave is monowave indicator, the monowave theory is one of Elliott wave approach and one of most complicate and accurate method. Golden Monowave can shortcut many major steps to identify and describe the monowave. It works on any timeframe and with any trading instrument, including currencies, indices, futures, etc. Input Parameters initial_Bars - set the initial number of bars to calculate. wave_color - select the color of the wave. label_color - select the color of labels. temp_labe
This indicator displays in a separate window the difference between the number of points which increased the price, and the number of points that decreased the price during the time interval specified in the settings. The time interval for calculation is expressed as the number of bars of the chart the indicator is attached to. This approach allows you to evaluate the movement direction (growth or fall) of the instrument's price, the strength of the movement and the size of the movement in point
MetaTrader 5 version available here : https://www.mql5.com/en/market/product/24882 FFx Basket Scanner is a global tool scanning all pairs and all timeframes over up to five indicators among the 16 available. You will clearly see which currencies to avoid trading and which ones to focus on. Once a currency goes into an extreme zone (e.g. 20/80%), you can trade the whole basket with great confidence. Another way to use it is to look at two currencies (weak vs strong) to find the best single pairs
NostradamusMT4
Andrey Spiridonov
1 (1)
NostradamusMT4 is a powerful indicator from the set of professional trader. The indicator is based on Andrei Spiridonov's original price calculation method (ESTIMATED PRICE) for the current candle price. Advantages The indicator does not redraw. It works on any timeframes. Works with any trading instruments. Perfectly suitable for scalping and trading binary options. Parameters Color - color of the ESTIMATED PRICE FUTURE line. How to work with the indicator The indicator forms the ESTIMATED P
MetaTrader 5 version available here: https://www.mql5.com/en/market/product/25794 FFx Pivot SR Suite PRO is a complete suite for support and resistance levels. Support and Resistance are the most used levels in all kinds of trading. Can be used to find reversal trend, to set targets and stop, etc. The indicator is fully flexible directly from the chart 4 periods to choose for the calculation: 4Hours, Daily, Weekly and Monthly 4 formulas to choose for the calculation: Classic, Camarilla, Fibonac
BinaryIndicator is a highly accurate indicator for trading binary options. It shows excellent results in scalping. This indicator is based in multifactor analysis of trend indicators, as well as confirmation oscillators, which in the end gives an increased accuracy of signals. Advantages of the indicator Increased accuracy of signals. Excellent results when trading binary options with a short expiration time from M30 to M1 . It works on any timeframes. Works with any trade symbols. Parameters
作者のその他のプロダクト
for xau/usd marthingale expert adviser. ・The initial lot is carefully selected for both buying and selling. ・When there is a large price movement, or there is a trend, we do not have a new position. ・Nanping also does not have a new  positions when there is a trend or there is a sudden change (when it rises or falls). ・Separately setting for buying and selling can use,(for example  Nanpin ratio, Nanpin Interval, Nanpin Interval_add,and profit take method.) «two type of profit take method» 1) s
GLACIER CROWN — 上限をはっきり決めた GBPCHF のナンピンEA。 GLACIER CROWN は GBPCHF の M5 チャートで動きます。エントリー条件がそろうと小さなロットで1つ目を建て、逆行した時だけ、段ごとに広がる間隔で追加します。バスケット全体は、平均建値からのトレーリングストップで決済します。 多くのバスケットは早めに決済されます。バックテストでは、利確の96%が2段以内、保有時間の中央値は約3.4時間、77%のバスケットが24時間以内に決済されました。 リスクの上限(すべて初期値) 片側最大10段。間隔は入力で固定なので、最大ロットは事前に分かります。 バスケット損切り:片側の含み損が残高の8%に達したら、その側を決済します。 時間決済:買いは60日、売りは45日たってもマイナスのバスケットを決済し、長期保有のスワップを抑えます。 逆向きの強いトレンドの間はナンピンを止めます。 毎回の発注前に証拠金をチェック。余力が足りない時は発注しません。 最大スプレッド、サーバー0時直後の停止、エントリー禁止時間・禁止日。 売買の流れ 買いと売りのバスケットは別
ALPINE MIRROR — 上限を決めた、落ち着いた EURCHF のナンピンEA。 ALPINE MIRROR は EURCHF の M5 チャートで動きます。EURCHF は狭い値幅で動くことが多く、トレール決済のナンピンと相性が良い通貨ペアです。エントリー条件がそろうと小さなロットで1つ目を建て、逆行した時だけ、段ごとに広がる間隔で追加します。バスケット全体は平均建値からのトレーリングストップで決済します。 リスクの上限(すべて初期値) 片側最大10段。最大ロットは事前に分かります。 バスケット損切り:片側の含み損が残高の10%に達したら、その側を決済します。 時間決済:45日たってもマイナスの売りバスケットを決済します。 毎回の発注前に証拠金をチェック。余力が足りない時は発注しません。 最大スプレッド、サーバー0時直後の停止、エントリー禁止時間・禁止日。 売買の流れ 買いと売りのバスケットは別々に動きます。 新規は、直近のサポート・レジスタンスの範囲内で、エントリー条件がそろった時だけです。 次のポジションまでの間隔は、保有数に応じて広がります。 決済:平均建値からの利益が
DUAL AURORA — 広い間隔でじっくり待つ、NZDCAD のナンピンEA。 DUAL AURORA は NZDCAD の M5 チャートで動きます。NZDCAD は資源国通貨どうしのペアで、広いレンジの中で動くことが多い通貨ペアです。DUAL AURORA はポジション間の間隔を広く(約200pips)取るため、追加はまれで、価格が戻るのを待ちます。 バックテスト(MT5、NZDCAD M5、全ティック、10,000 USD、1:100) 2017.01 – 2026.10:純利益 +4,184 USD、プロフィットファクター 2.28 2017〜2026年のすべての年がプラス テスト中、バスケット損切りは一度もなし 最大ドローダウン 有効証拠金 12.15%(約1,215 USD/約18.2万円)、残高 2.88%(約288 USD/約4.3万円) バスケット数は年に約19回 バックテストの結果は将来の成績を保証するものではありません。 リスクの上限(初期値) 片側最大10段。最大ロットは事前に分かります。 バスケット損切り:片側の含み損が残高の16%に達したら、その側を決済
GOLDEN ECLIPSE — ボラティリティに合わせて幅を変える、ゴールドのナンピンEA。 ゴールドは静かな日なら数ドル、荒れた日なら数十ドル動きます。ある年に合っていた固定pipsの間隔が、翌年には合わないこともよくあります。GOLDEN ECLIPSE は日々のボラティリティを測り、それに合わせてナンピン間隔とトレール決済を決めます。荒れている時は広く、落ち着いている時は狭くなります。 バックテスト(MT5、XAUUSD M5、全ティック、10,000 USD、1:100、初期ロット0.01) 2021.01 – 2026.10:純利益 +2,301 USD、プロフィットファクター 1.44 勝率 90.4%(281回中254勝)、最大連勝 52回 最大ドローダウン 有効証拠金 14.2%(約1,420 USD/約21.3万円)、残高 12.3%(約1,230 USD/約18.45万円) テスト期間中のバスケット損切り 4回 バックテストの結果は将来の成績を保証するものではありません。 特長 ボラティリティ連動の間隔。ナンピン間隔、トレール開始、トレール幅はすべて日々のボラティ
LIGHTHOUSE — 相場の構造がひと目でわかる。リペイントなし。 LIGHTHOUSE は、確定した山と谷から相場の構造を読み取り、チャートにすっきり表示します。エントリー前に誰もが確かめたい3つのこと、「上位足はどちら向きか」「今のチャートはどちら向きか」「大事な価格はどこか」に答えます。 裁量の判断を助けるツールです。売買はせず、価格の予想もしません。 なぜ「LIGHTHOUSE(灯台)」? 灯台は船に進む道と岩場を知らせますが、舵を取るのは船長です。LIGHTHOUSE もチャートの上で、相場の方向と反応しやすい価格帯を示します。判断はあなた自身のものです。 しくみ 山・谷は足が確定してから付けます。一度付いた印は動いたり消えたりしません。 構造の抜けはヒゲではなく終値で判定します。 方向は「最後に終値で抜けた向き」と「直近2つの山・谷の並び」(ダウ理論)で決めます。 同じ判定を上位足(初期値 H1)にも使います。 主な機能 5段階の方向:強い買い・買い・中立・売り・強い売り(上位足と今のチャートの両方)。 HH・HL・LH・LL の印と2色のジグザグ。 BOS(方向の継続
フィルタ:
レビューなし
レビューに返信