Classic Candlestick Patterns Scanner

Classic Candlestick Patterns Scanner for MT5 

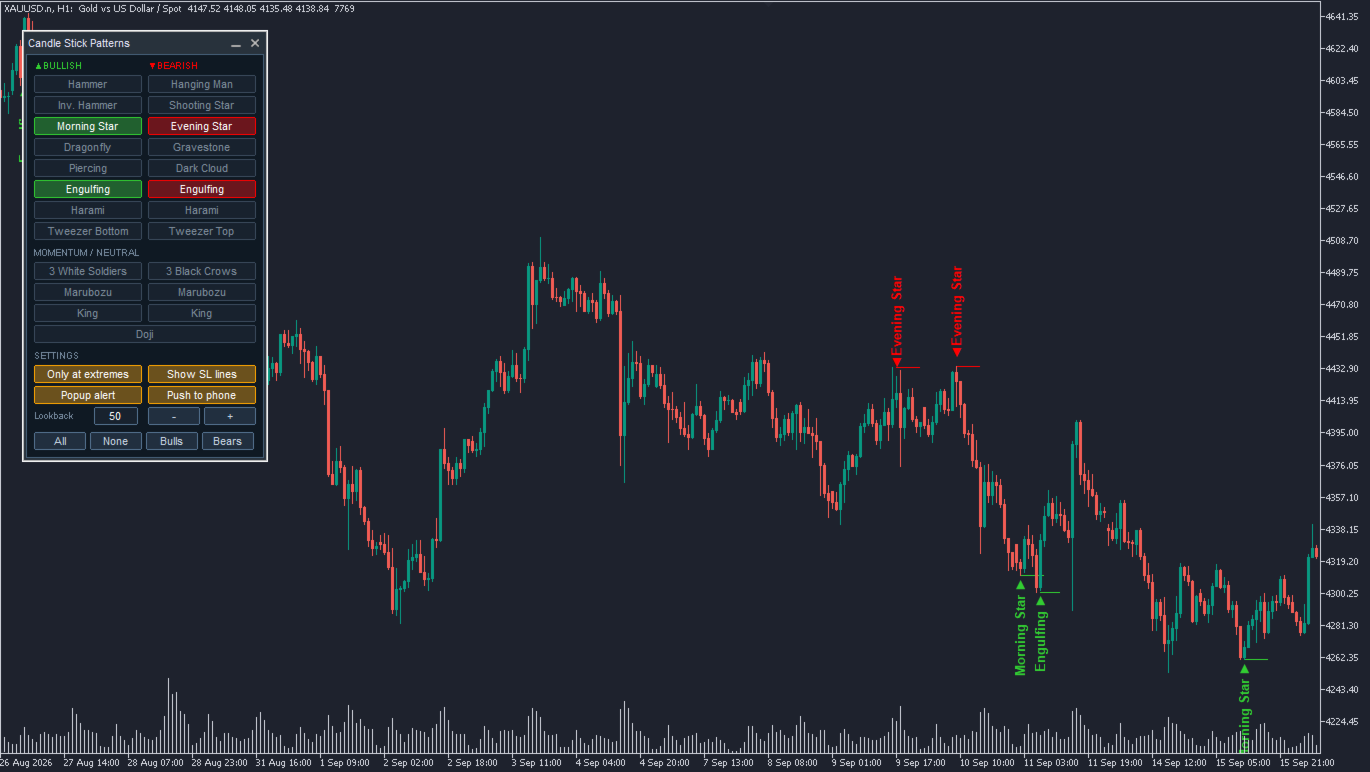
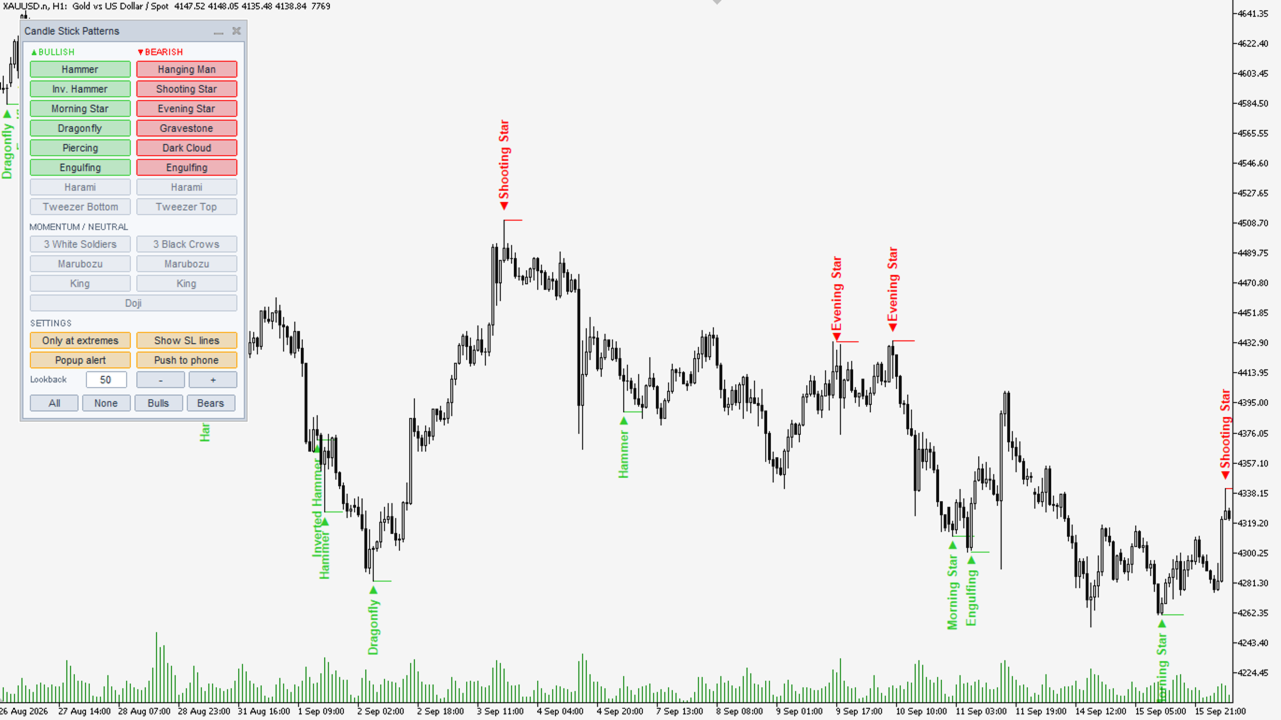
Classic Candlestick Patterns Scanner monitors closed bars on any symbol and timeframe and automatically identifies 23 classic candlestick formations, placing clear pattern markers directly on your MT5 chart.  
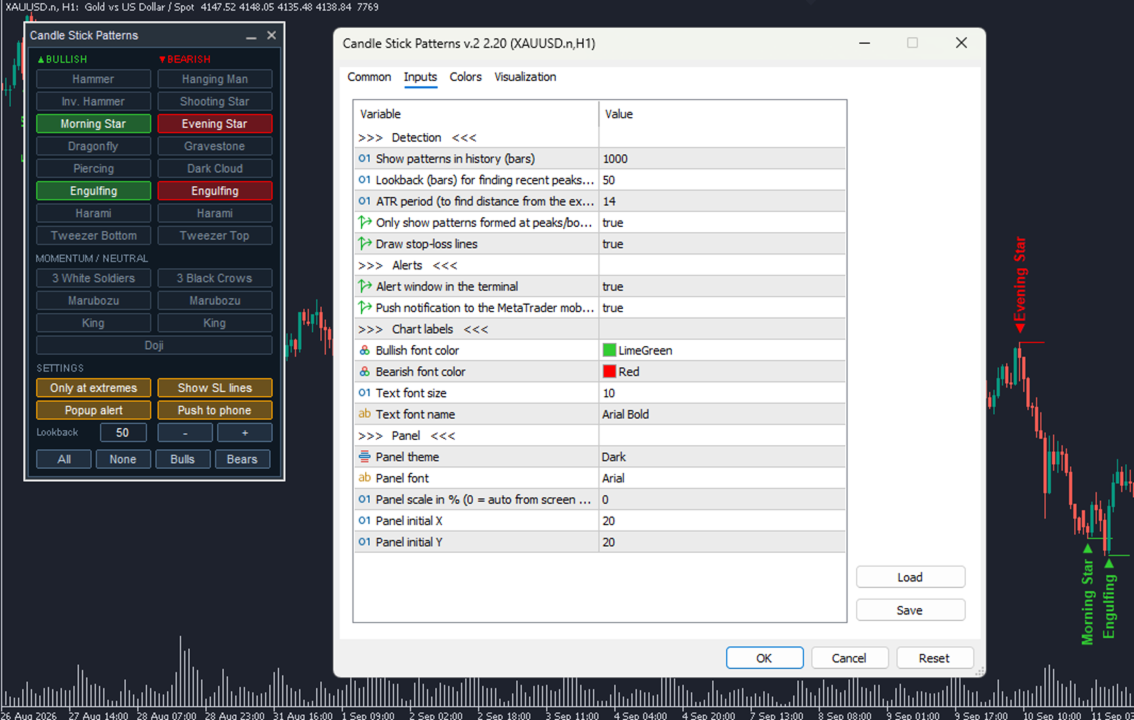
Each detected pattern is labeled with its name and direction, while an optional pattern-based stop-loss line shows the corresponding invalidation level. It can also send push notification on your mobile app at the moment a new pattern is formed.  
Everything is controlled from a compact interactive panel — no input-window editing, no recompiling. 


23 Candlestick Patterns 

Bullish Patterns 

  • Hammer 
  • Inverted Hammer 
  • Morning Star 
  • Dragonfly Doji 
  • Piercing Line 
  • Bullish Engulfing 
  • Bullish Harami 
  • Tweezer Bottom 
  • Three White Soldiers 
  • Bullish Marubozu 
  • Bullish King 

Bearish Patterns 

  • Hanging Man 
  • Shooting Star 
  • Evening Star 
  • Gravestone Doji 
  • Dark Cloud Cover 
  • Bearish Engulfing 
  • Bearish Harami 
  • Tweezer Top 
  • Three Black Crows 
  • Bearish Marubozu 
  • Bearish King 

Neutral 

  • Doji


Key features 

  • Per-pattern toggle panel with tooltips explaining each formation; bulk actions All / None / Bulls / Bears. 
  • Push notification on Mobile App and MT5 Terminal.
  • Dark & light panel themes, DPI-aware auto-scaling (or manual scale), draggable and collapsible dialog. 
  • Optional stop-loss lines at structurally meaningful levels (e.g., hammer low, engulfing extreme, 3-candle low for stars). 
  • No repainting, no lookahead: signals are calculated on closed bars using only the data available at that bar. Once printed, a marker never moves or disappears. 
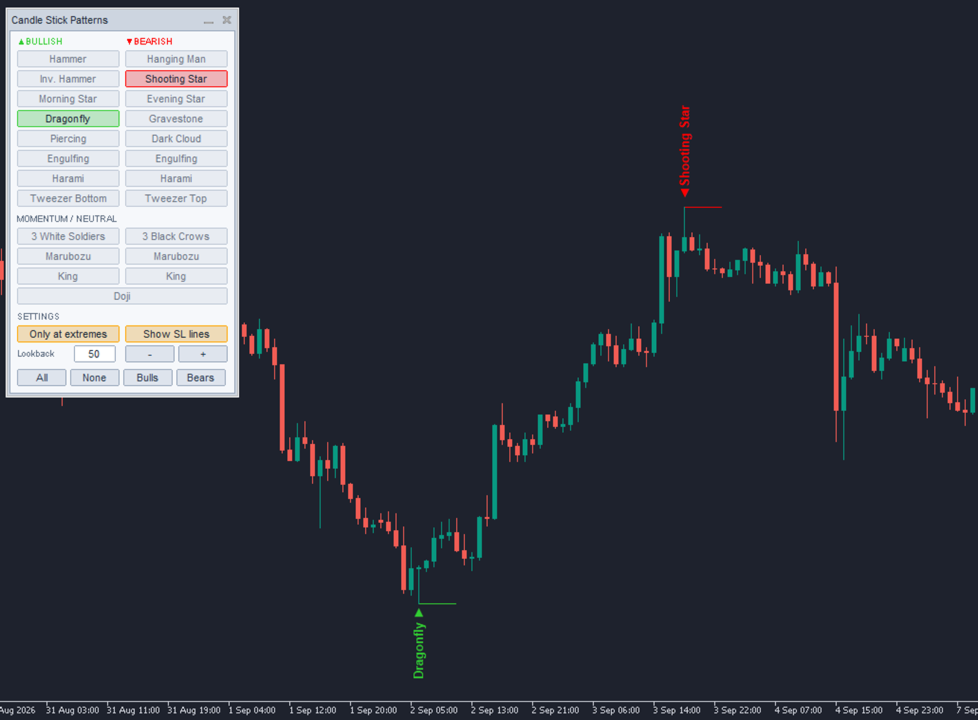
  • "Only at extremes" filter — reversal patterns are shown only near recent peaks and bottoms (lookback 2–500 bars, adjustable live from the panel). Switch it off to use trend-context rules instead. 
  • Adaptive, symbol-independent detection: candle bodies and shadows are measured against a 50-bar average, so rules scale automatically to any instrument and timeframe. 
  • Settings survive timeframe and symbol changes on the same chart. 
  • Lightweight: recalculates once per new bar or per settings change; no indicator buffers or plots, markers kept behind the panel and out of your way. 

How signals appear 

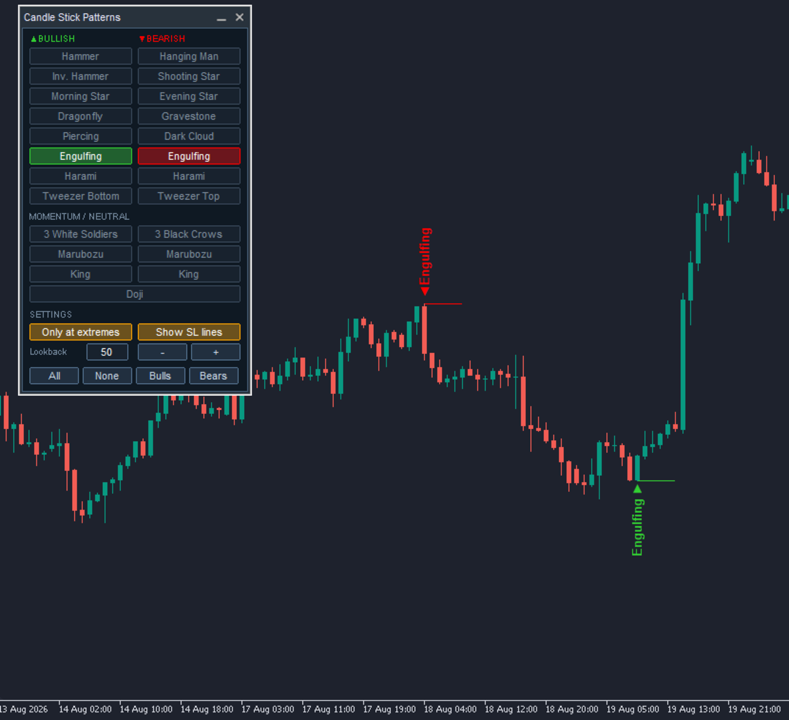
  • Bullish patterns: green vertical label with an up-arrow below the candle. 
  • Bearish patterns: red vertical label with a down-arrow above the candle. 
  • Stop-loss line (optional): horizontal line at the pattern's stop level, extended a few bars to the right. 

Important Notes 

  • Signals appear at the close of the confirming candle. The currently forming candle is never labeled. 
  • If multiple patterns are detected on the same candle, only the highest-priority match is displayed. 
  • All chart objects use a dedicated prefix and are automatically removed when the indicator is detached.
Yazarın diğer ürünleri
MACD Classic Smoothed
Shahabeddin Baset
4.81 (27)
Classic MACD It has MACD line, Signal line, and Histogram . The Histogram has 4 colors , showing its movement direction as simple as possible. The smoothing factor in the input helps to eliminate noisy signals. Besides different price types (hlc, hlcc, ohlc, ...), there is an option to use volume data as the source for MACD calculations (which is better to be used by real volume not unreliable tick volume). While the original MACD indicator uses Exponential Moving Average, this indicator provide
FREE
OBV macd
Shahabeddin Baset
5 (6)
OBV MACD Calculating MACD based on OBV data Features 3 outputs: MACD & Signal & Histogram 4 Colored Histogram Smoothing factor show/hide option for MACD & Signal lines Description Among the few indicators developed for working with volume data, OBV (On Balance Volume) is the simplest yet most informative one. Its logic is straightforward: when the closing price is above the previous close, today's volume is added to the previous OBV; conversely, when the closing price is below the previous close
FREE
ARC Ichimoku
Shahabeddin Baset
5 (2)
Combination of Ichimoku and Super Trend indicators. 1. ARC (Average Range times Constant) The concept of ARC or Volatility System was introduced by Welles Wilder Jr. in his 1978 book, New Concepts in Technical Trading Systems . It has since been adapted and modified into the popular Super Trend indicator. The fundamental idea behind ARC is simple: to identify support and resistance levels, you multiply a constant with the Average True Range (ATR) . Then, you either subtract or add the resulting
FREE
ADXW Cloud
Shahabeddin Baset
4.57 (7)
This is Wilder's ADX with cloud presentation of DI+ & DI- lines. Features 4 standard lines of the ADX indicator: DI+, DI-, ADX, ADXR cloud presentation of DI+/DI- lines with transparent colors applicable to all time-frames and all markets What Is ADX J. Welles Wilder Jr., the developer of well-known indicators such as RSI, ATR, and Parabolic SAR, believed that the Directional Movement System, which is partially implemented in ADX indicator, was his most satisfying achievement. In his 1978 book,
FREE
Combination of Ichimoku and Super Trend indicators, with Signals and live notifications on Mobile App and Meta Trader Terminal. Features: Display five reliable signals of ARC Ichimoku Filter signals by their strength level (strong, neutral, weak) Send live notifications on Mobile App and Meta Trader terminal S ignals remain consistent without repainting Applicable across all time-frames Suitable for all markets Notifications format: "ARC Ichimoku | XAUUSD | BUY at 1849.79 | Tenken-Kijun cross |
ADXW Cloud Pro
Shahabeddin Baset
5 (1)
Full implementation of Directional Movement System for trading, originally developed by Welles Wilder, with modifications to improve profitability, to reduce the number of unfavorable signals, and with Stop Loss lines. No re-paint Features Buy/sell signals displayed on the chart Stop levels visually indicated on the chart Profit-taking points presented in the indicator window Exit points for unfavorable positions presented in the indicator window Signal confirmation through high/low swing cros
High Low Swing
Shahabeddin Baset
High Low Swing (HLS) Indicator The HLS indicator is a technical analysis tool designed to identify swing highs and lows in the market, aiding swing traders in making informed decisions. It offers an adjustable "degree" parameter, allowing you to customize the sensitivity to strong price movements based on current market conditions. Features: •    Clear Buy/Sell Signals: The indicator plots signals directly on the chart, simplifying trade identification. •    Adjustable Swing Strength: The "degr
FREE
Features All Ichimoku Signals (Selectable) : Display all reliable signals generated by the Ichimoku indicator. You can choose which signals to view based on your preferences. Filter by Signal Strength : Sort signals by their strength—whether they are weak, neutral, or strong. Live Notifications : Receive real-time notifications for Ichimoku signals. Transparent Cloud : Visualize the Ichimoku cloud in a transparent manner. Available Signals Tenkensen-Kijunsen Cross Price-Kijunsen Cross Price-C
Includes almost all the concepts related to Volume Profile: POC , Value Area , Developing POC , Anchored VWAP , Volume Delta ; since the “Total” in its name. It is fast in its calculations and simple to work with. Features: 1.    Selectable calculation timeframe to find most traded levels. 2.    Capable of calculating Volume Profile based on tick data 3.    Adjustable histogram bars by their count. 4.    Adjustable histogram bars by their height (price range). 5.    Showing Value Area (VA
Filtrele:
Değerlendirme yok
Değerlendirmeye yanıt