ARC Ichimoku Signals

Combination of Ichimoku and Super Trend indicators, with Signals and live notifications on Mobile App and Meta Trader Terminal.

Features:

  • Display five reliable signals of ARC Ichimoku
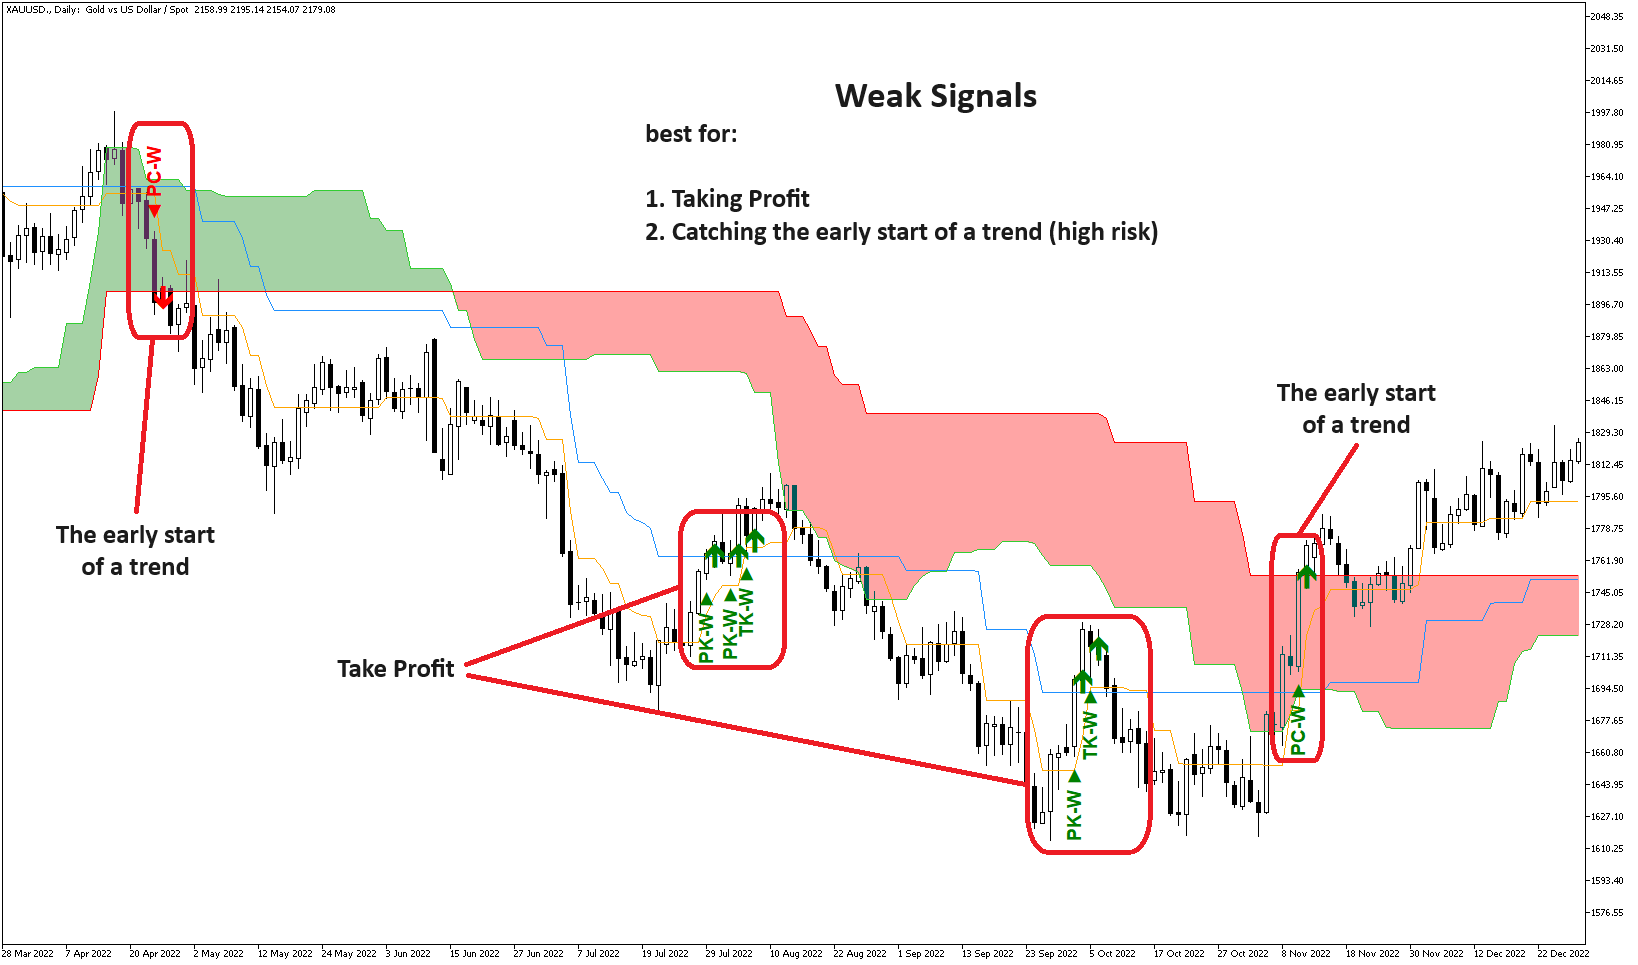
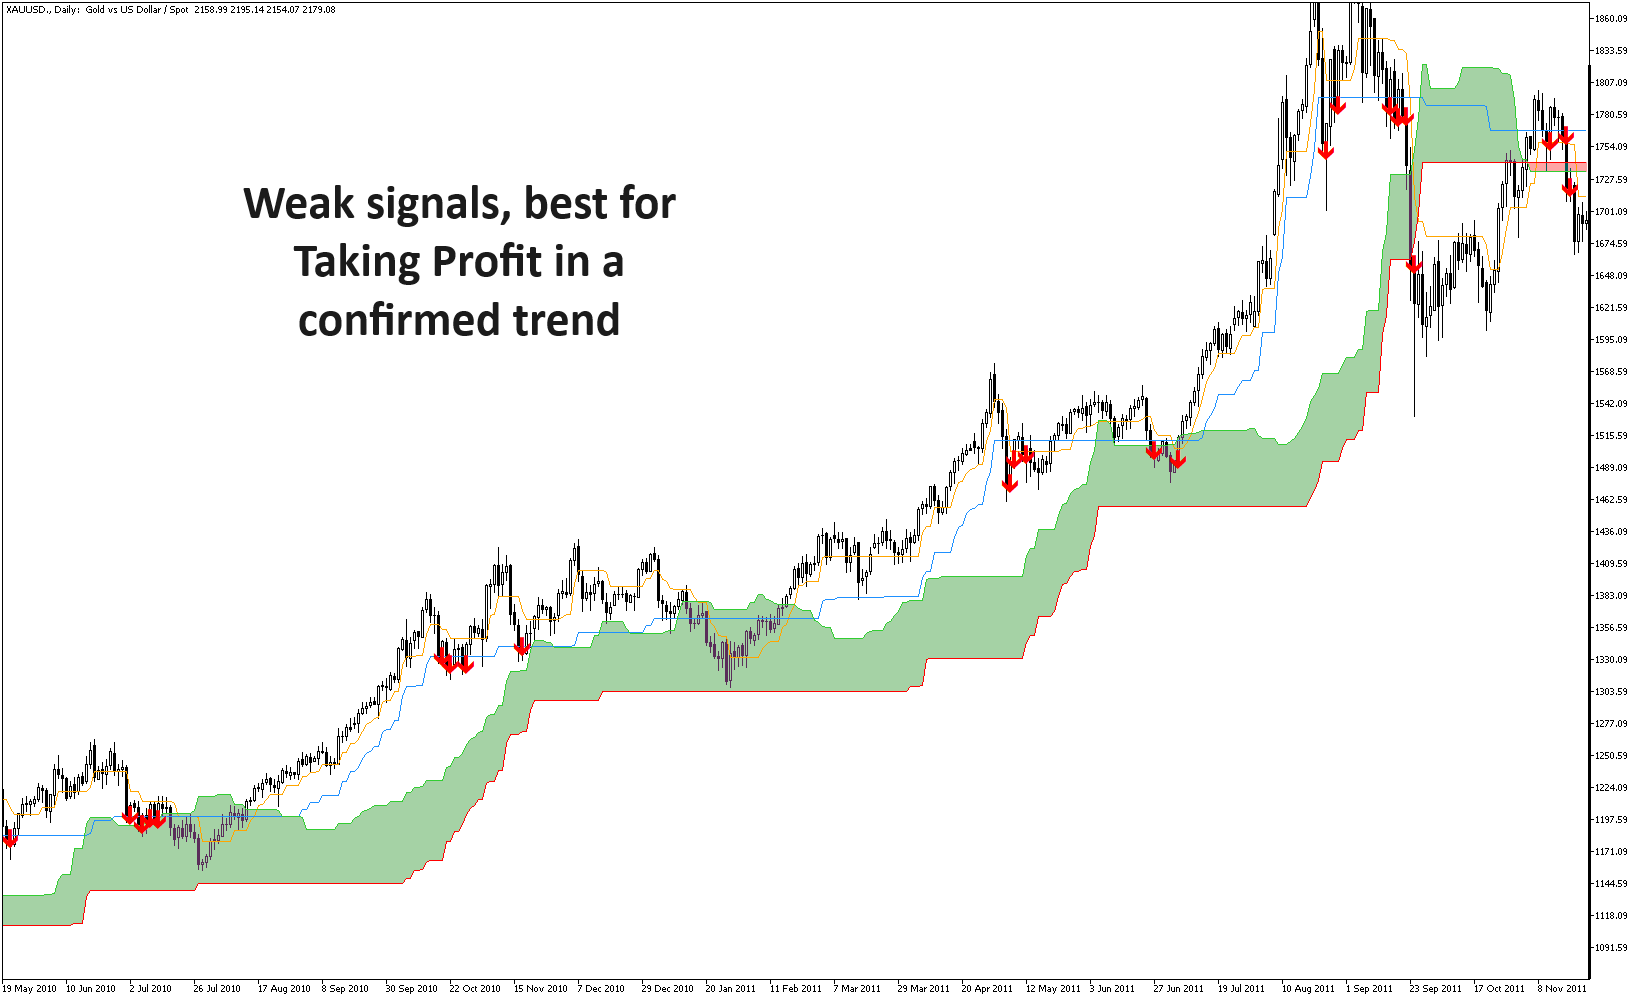
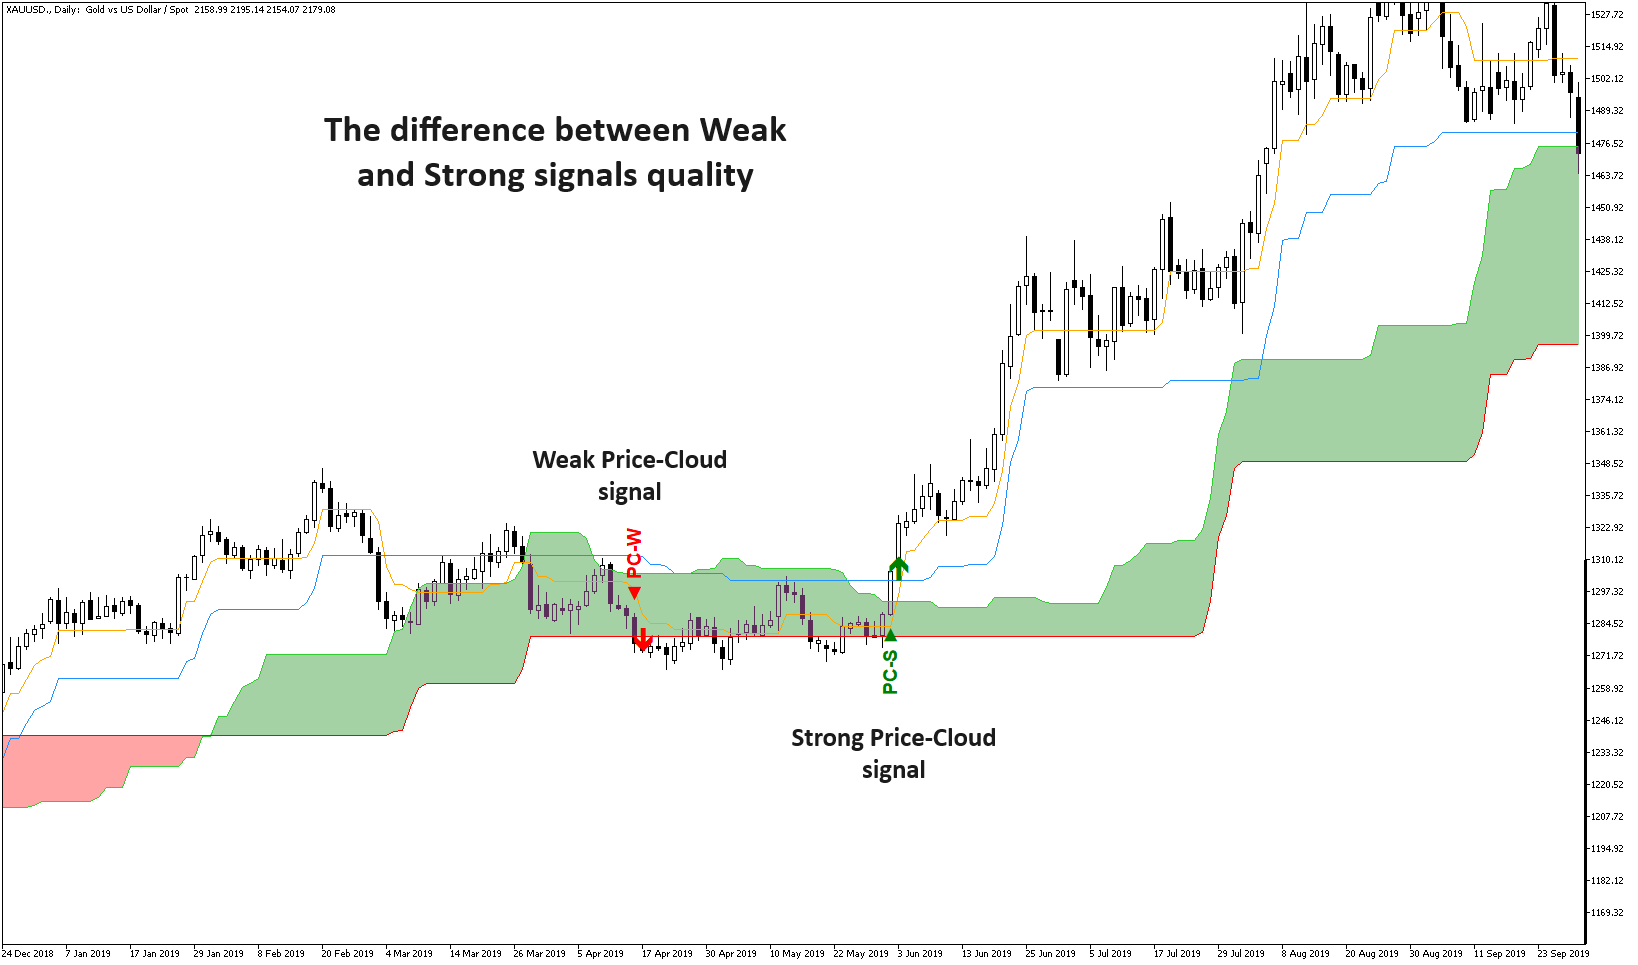
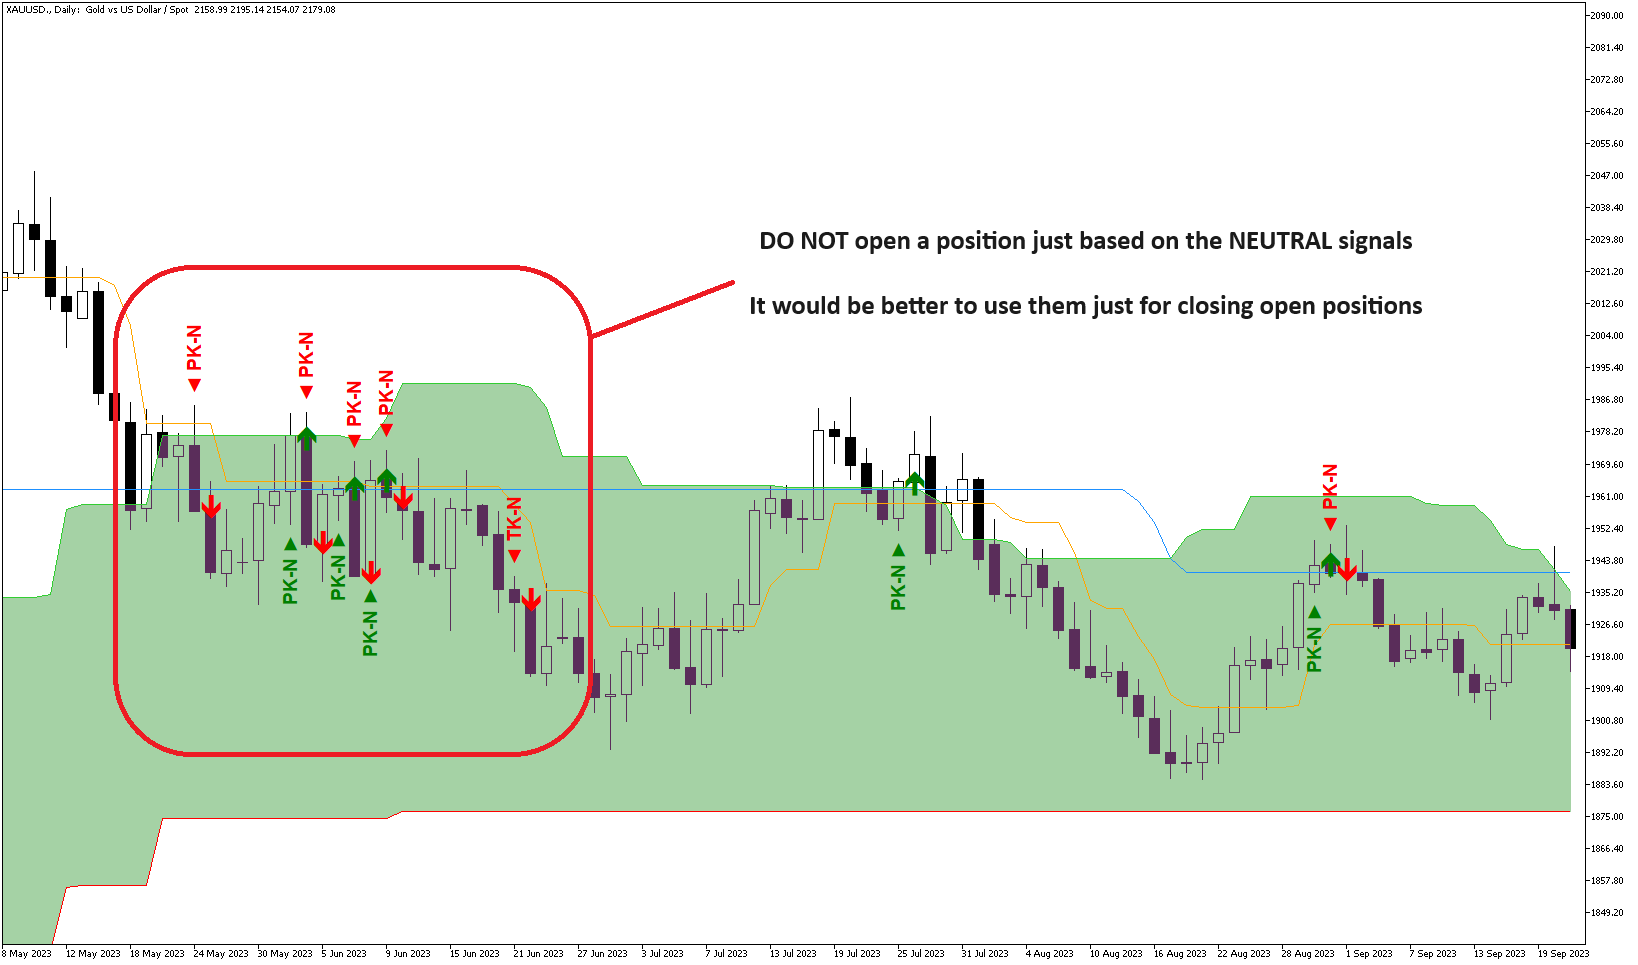
  • Filter signals by their strength level (strong, neutral, weak)
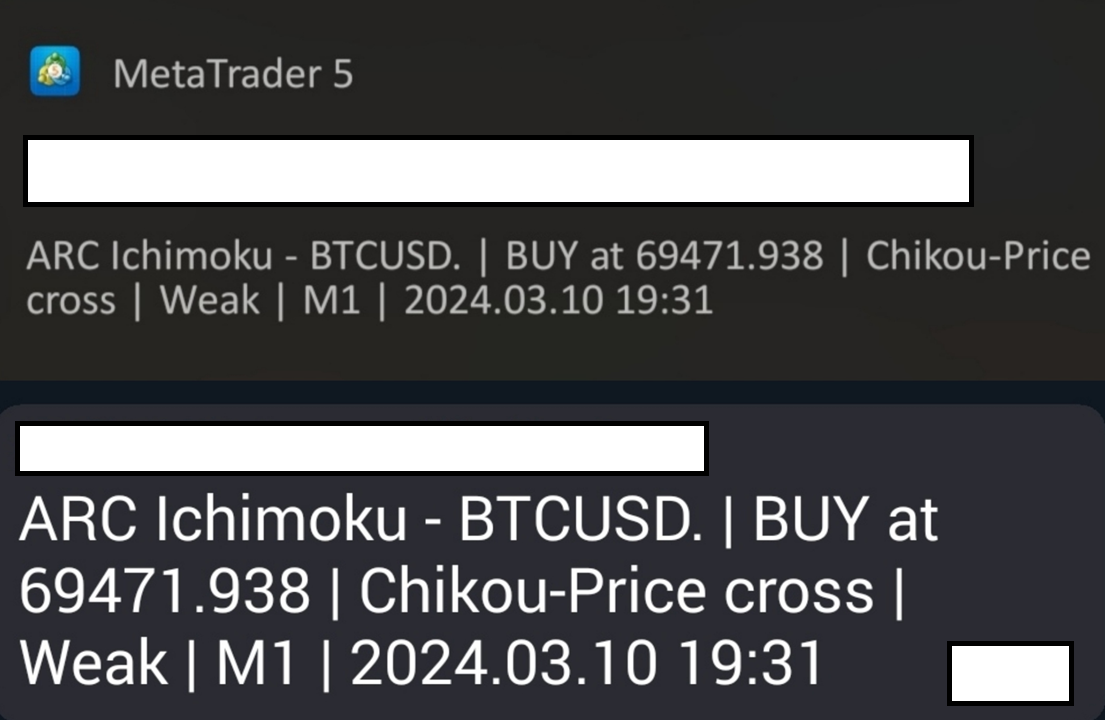
  • Send live notifications on Mobile App and Meta Trader terminal
  • Signals remain consistent without repainting
  • Applicable across all time-frames
  • Suitable for all markets
  • Notifications format: "ARC Ichimoku | XAUUSD | BUY at 1849.79 | Tenken-Kijun cross | Strong | H1 | 2023.10.09 02:00"
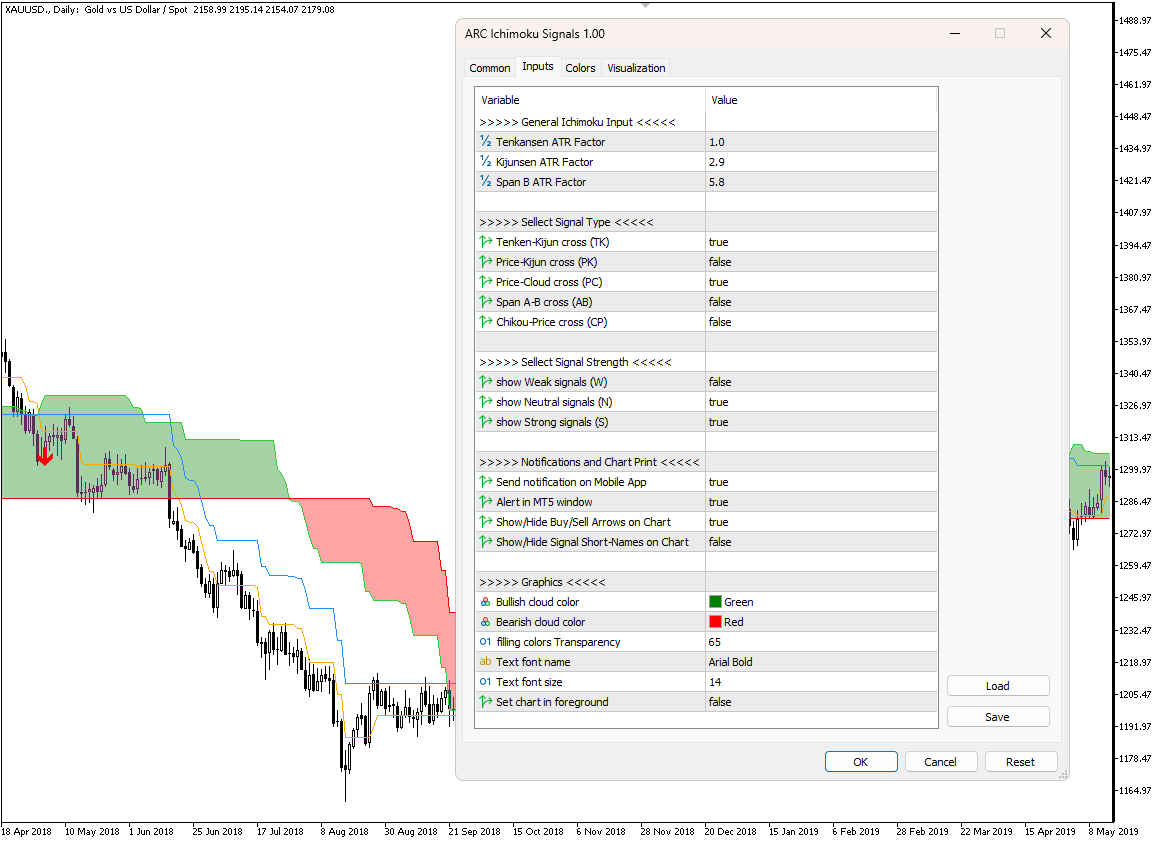
How to Use

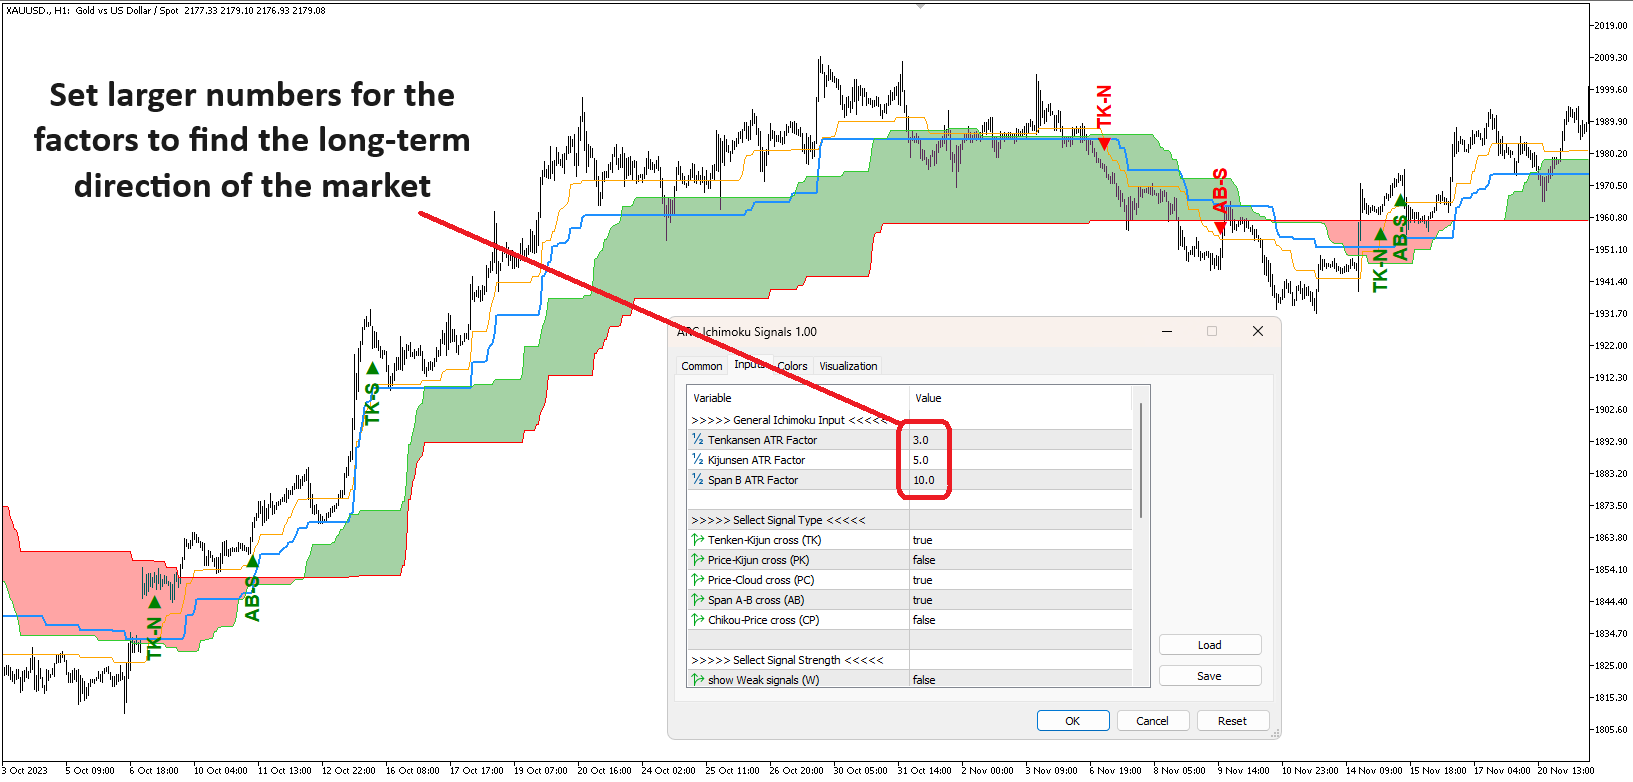
  1. Set the factors for Tenkensen, Kijunsen, and Span B (default: 1.0, 2.9, 5.8).

  2. Choose your desired signal types.

  3. Select the preferred signal strength (strong, neutral, weak).

  4. Enable or disable notification alerts and Meta Trader alert.

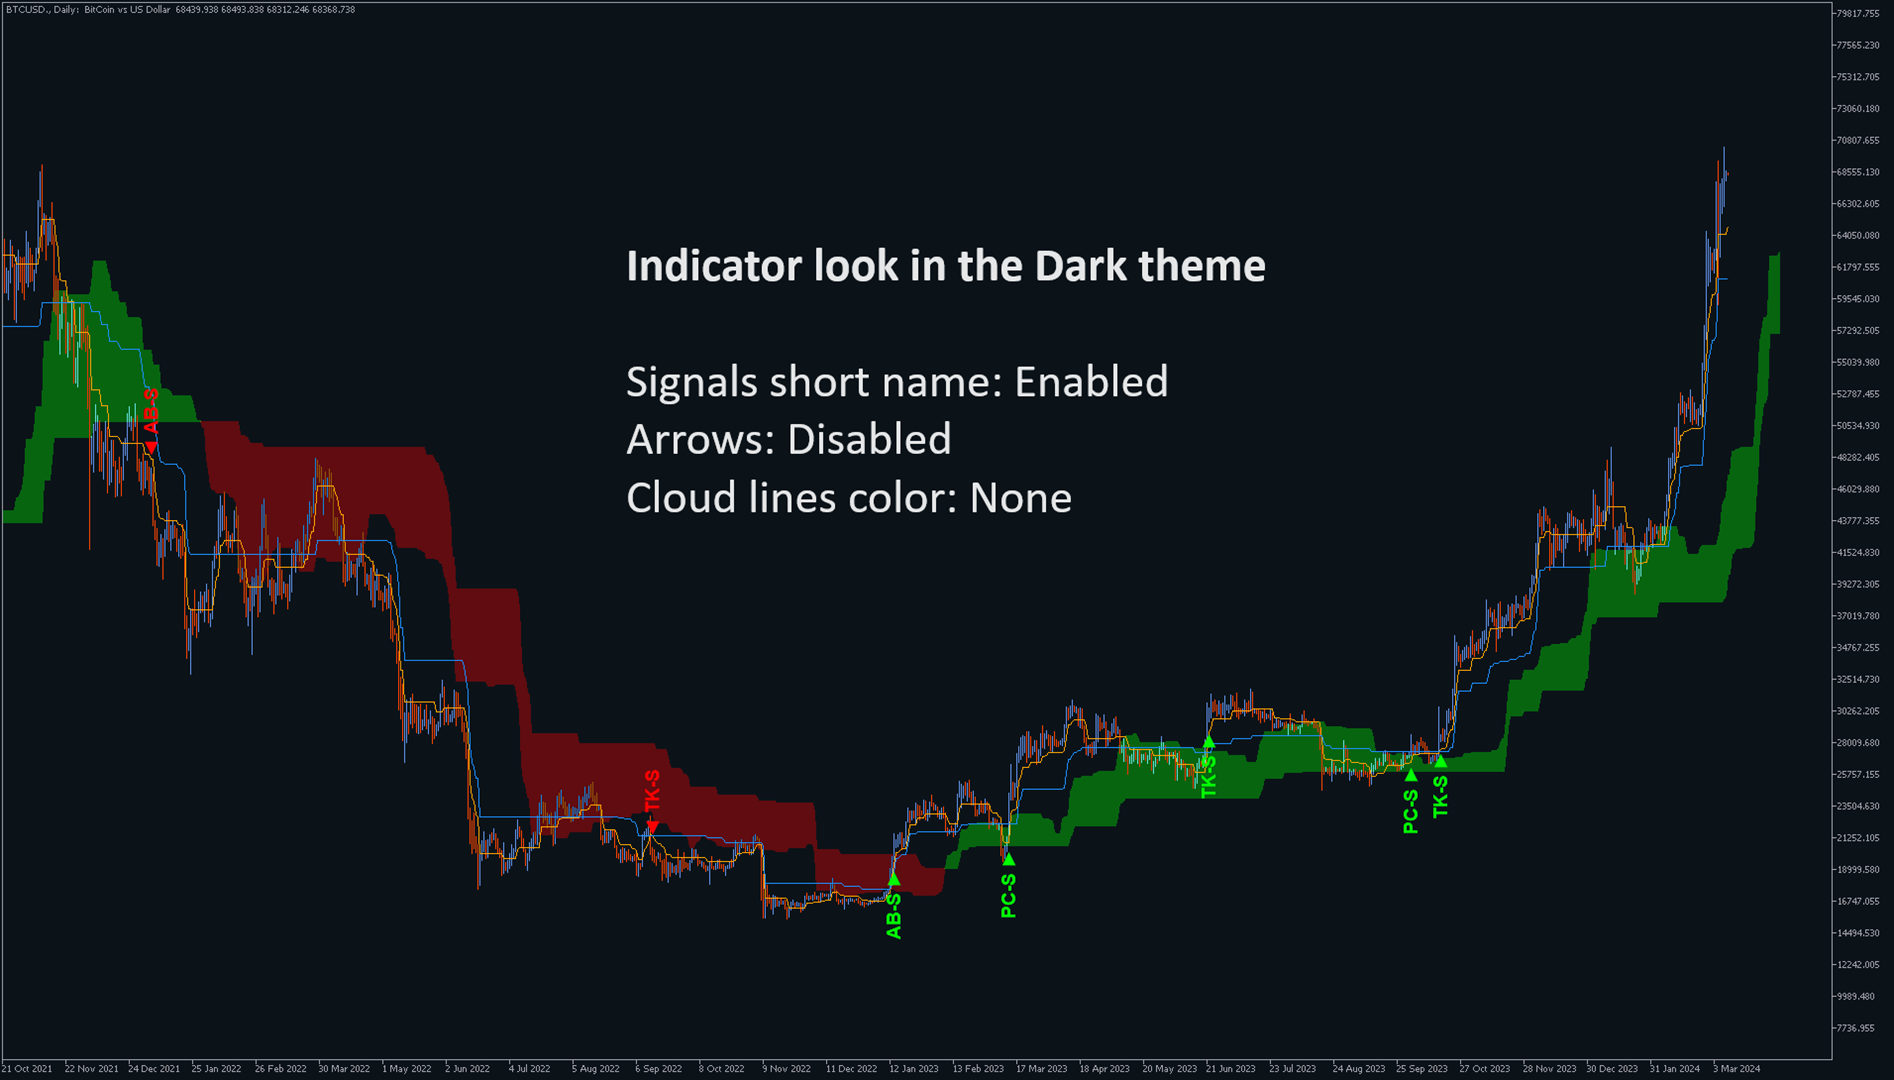
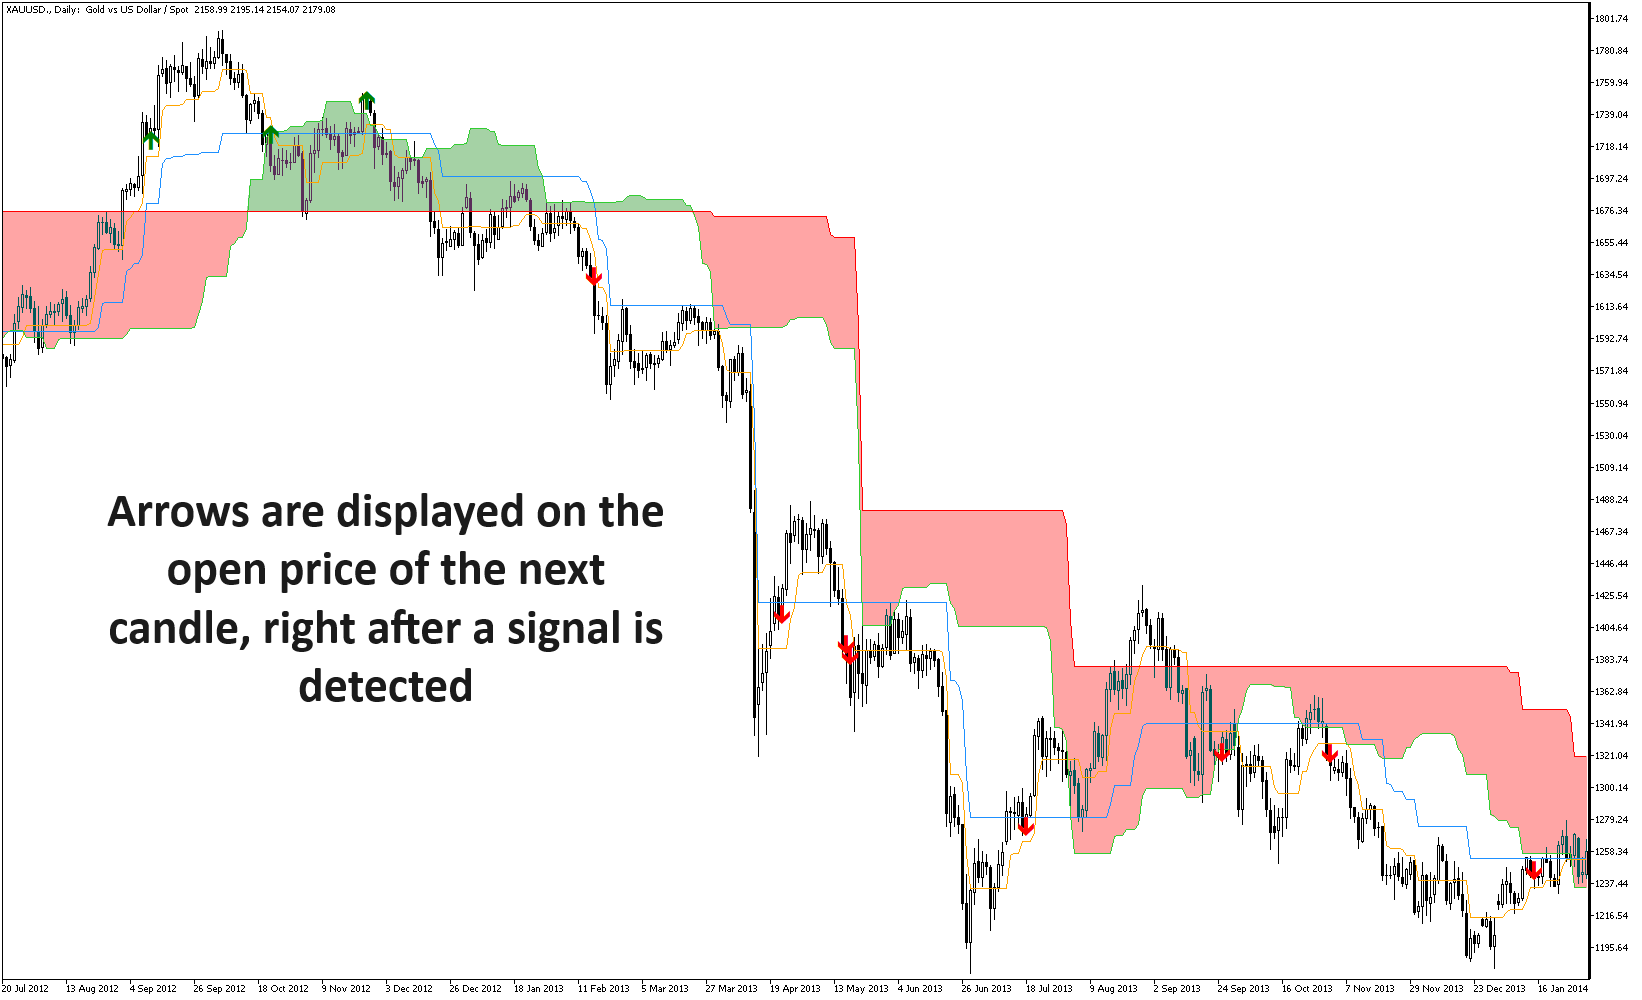
  5. Select Show/Hide arrows on the chart (arrows will be drawn right at the price that you can enter a position or take any other action, i.e. the open price of the next candle after the signal)
  6. Select Show/Hide signal short-names on the chart (short-names will be written right at the candle that the signal has been formed)
  7. Fix the graphical options (cloud colors, short names font and size, ...)
  8. Take a look at the 'colors tab' and change the lines and arrows colors as you wish.

1. ARC (Average Range times Constant)

ARC is the original concept used in the Super Trend indicator:  
•    multiply a constant (factor) with the Average True Range (ATR), then, based on trend direction, either subtract or add the resulting value to the last extremum point on the price chart. 
•    In an uptrend, ignore any support level lower than the previous day’s support level, and during a downtrend, ignore any support level higher than the previous support level.
 

2. ARC Ichimoku 

ARC Ichimoku is a variation of the classic Ichimoku indicator, which instead of using chart Max/Min values over fixed periods (e.g., 9, 26, 52) to find Ichimoku lines, employs the ARC with adjustable factors (constants) for the same periods to find those lines.
 

  •     Tenkensen: This line represents an ARC (Super Trend) calculated using an adjustable factor (default, 1.0) based on a 9-period ATR.
  •     Kijunsen: Kijunsen is also an ARC (Super Trend) calculated using an adjustable factor (default, 2.9), but based on a 26-period ATR.
  •     Span A (faster cloud edge): It is the average of Tenkensen and Kijunsen, shifted forward by 26 candles.
  •     Span B (slower cloud edge): It is another ARC (Super Trend) calculated using an adjustable factor (default, 5.8) based on a 52-period ATR. It is then shifted forward by 26 periods.
  •     Chikou: Chikou represents the close price shifted backward by 26 candles.

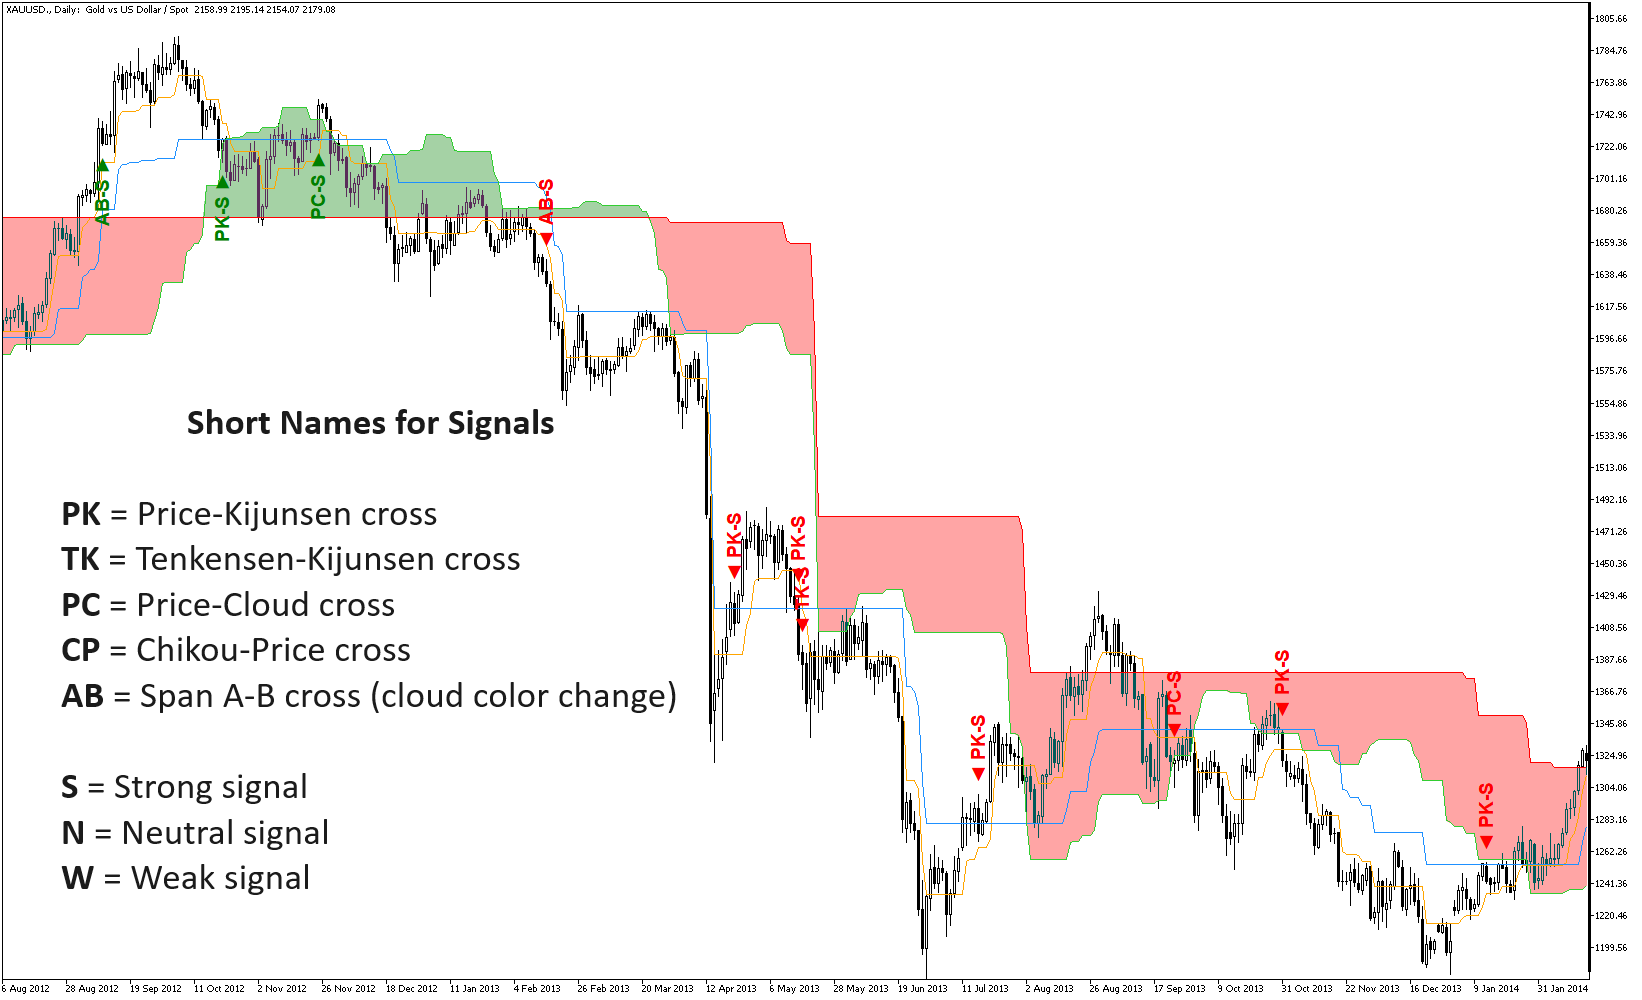
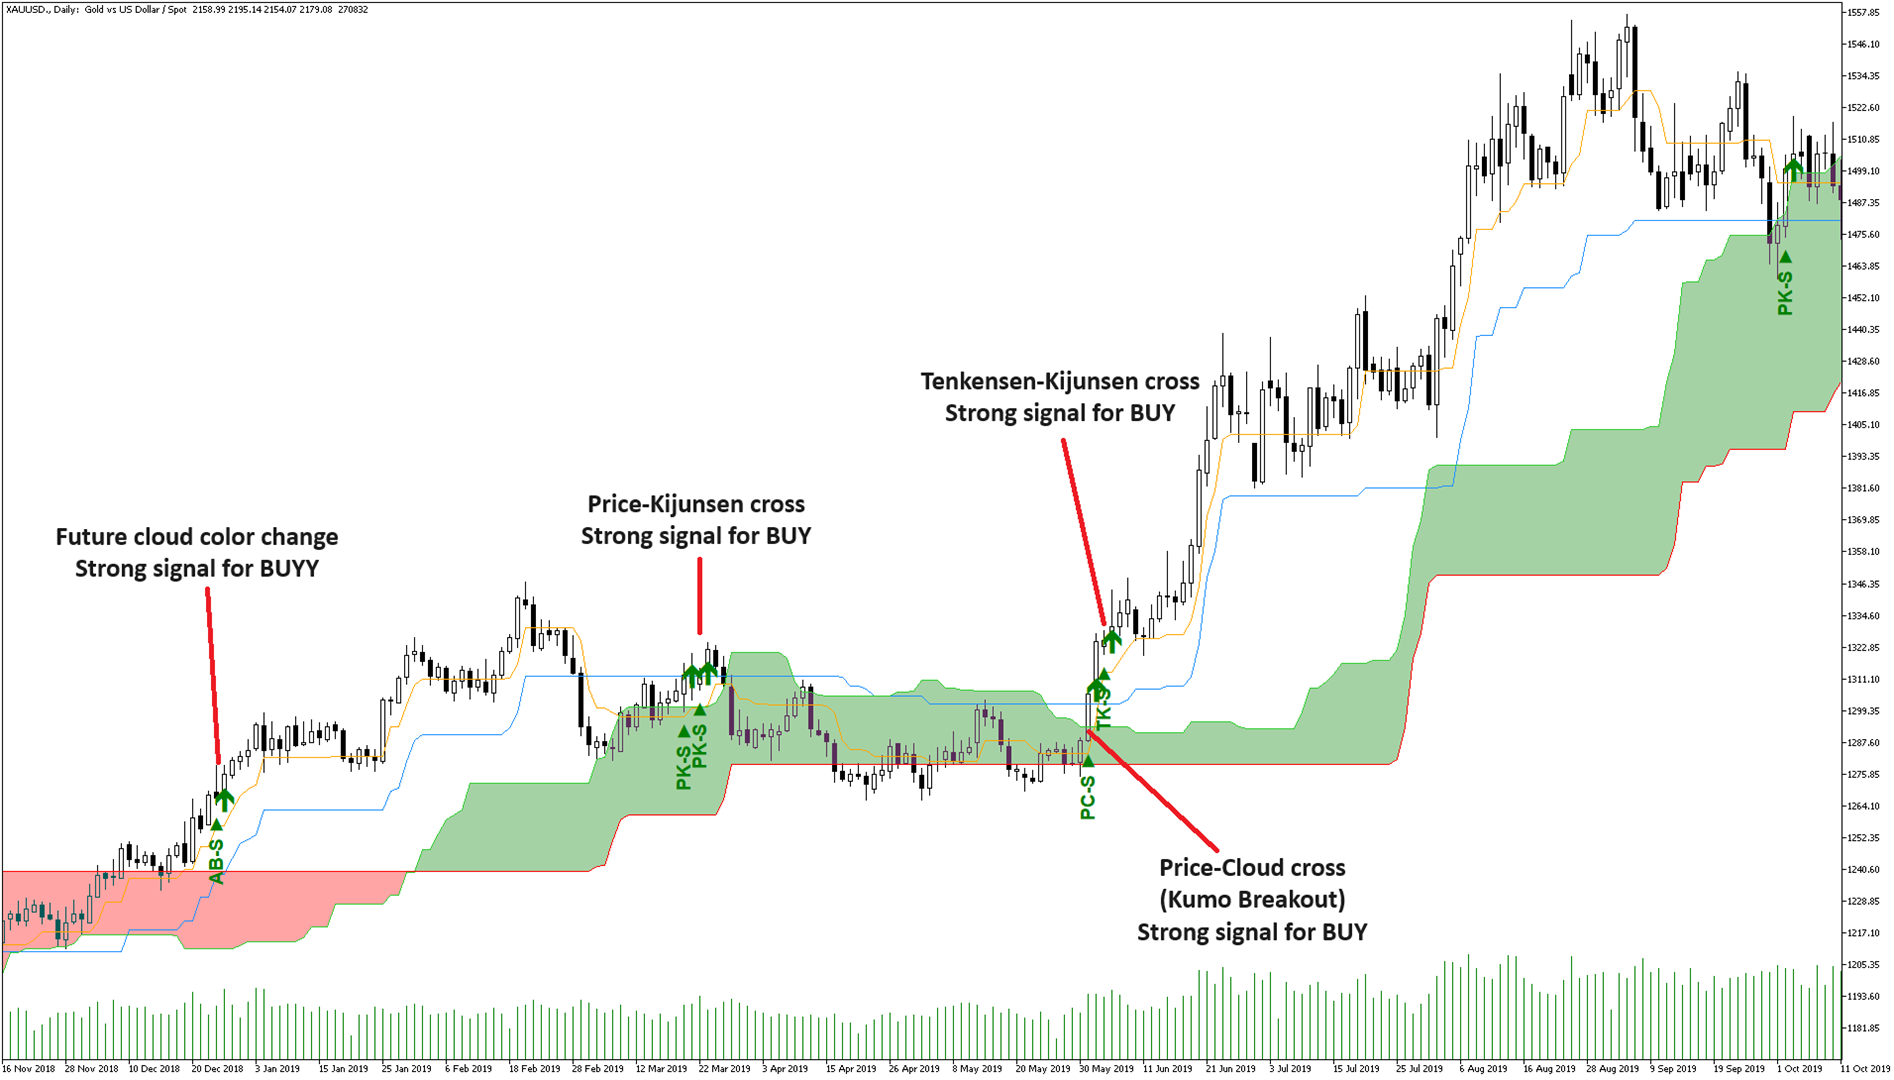
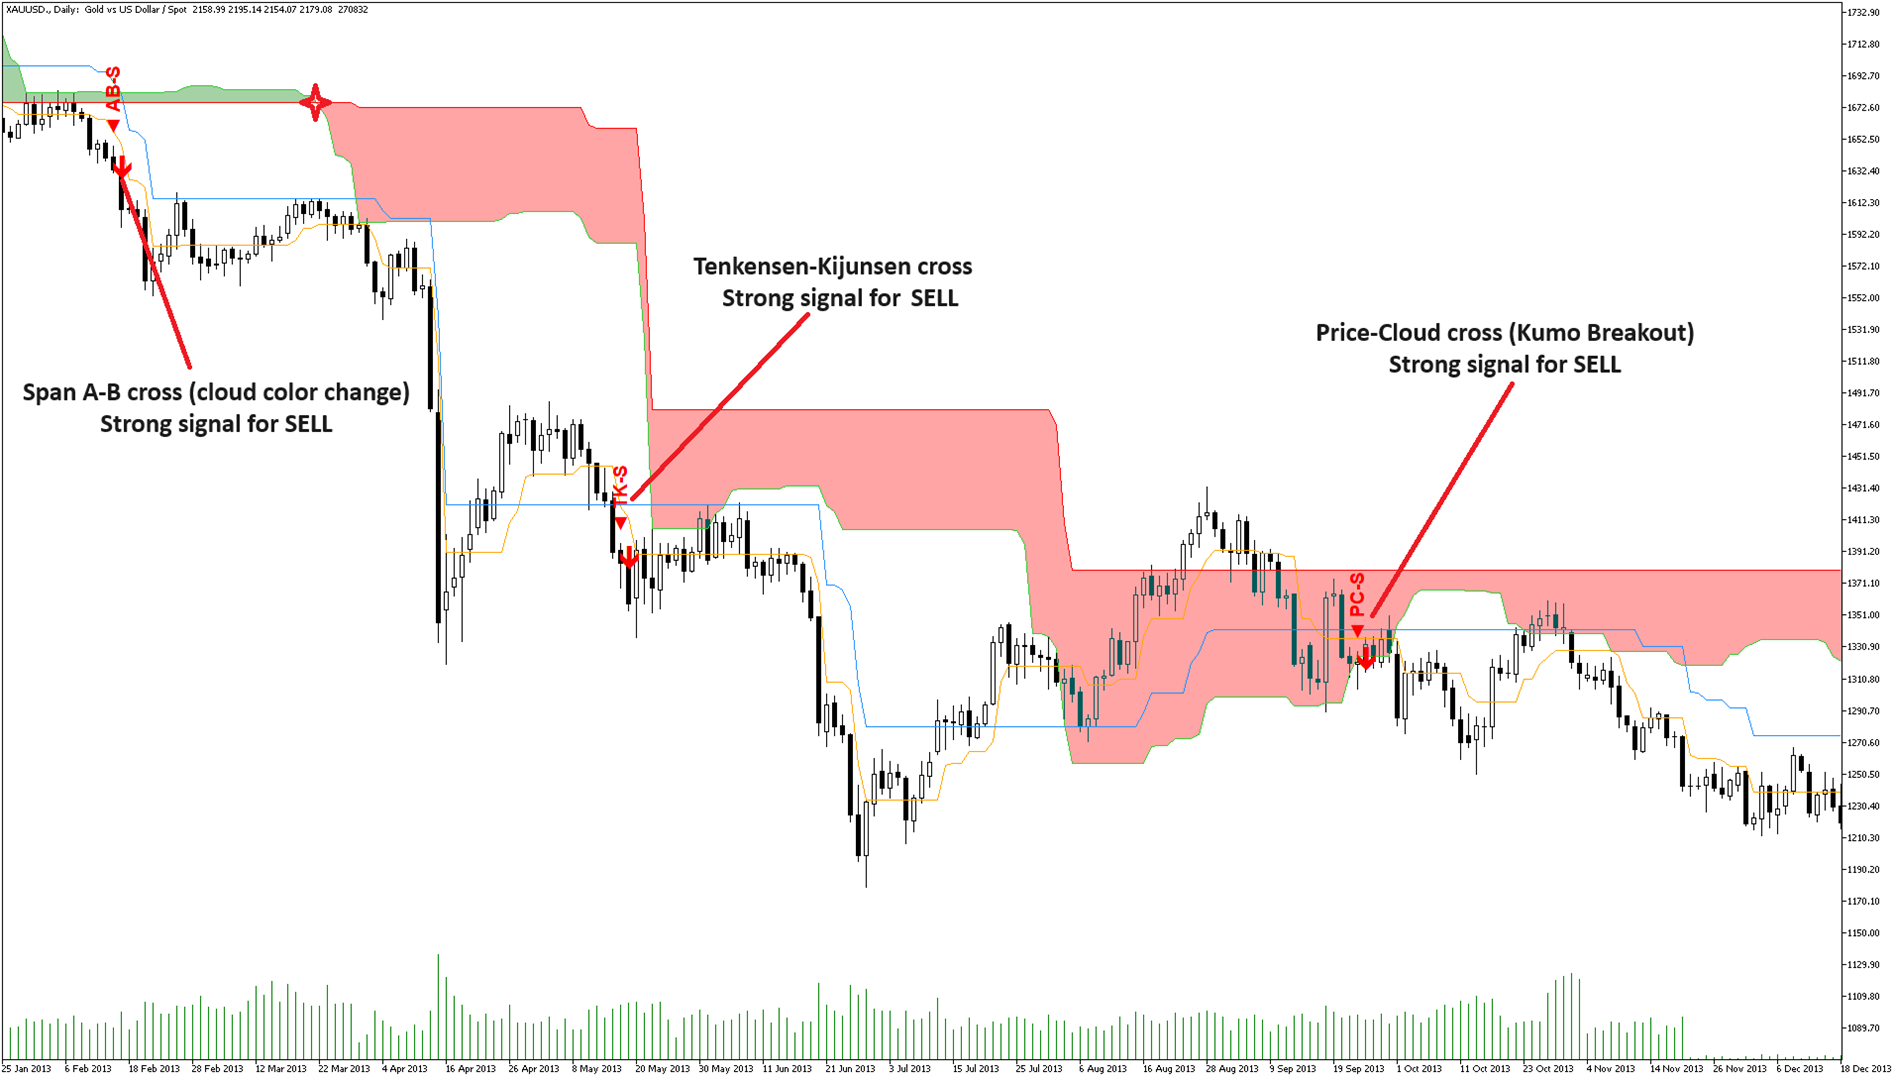
 3. Available Signals in the indicator 

There are five reliable signals in the classic Ichimoku, which have difference in their strength mostly based on their relationship with the cloud, and you can see all of them in this indicator, too. These include:
 

  •     Tenkan-Kijun Cross: When Tenkensen crosses above/below Kijunsen, it signals a potential bullish/bearish trend.
  •     Price-Kijun Cross: This signal occurs most frequently and when the price crosses above or below the Kijunsen line.
  •     Kumo Breakout: A breakout above or below the Kumo (cloud) indicates a potential trend reversal.
  •     Kumo color change: When the cloud color changes from red to green, or vice versa, it signals a potential trend reversal.
  •     Chikou Span Confirmation: When the Chikou (lagging span) crosses above or below the price, it confirms the prevailing trend direction.

 
If you believe that there are more reliable signals for Ichimoku trading system, I’m ready to hear and implement them in this indicator for the next updates.

If you find any problems or errors in the indicator, or any complexity that you can not understand, don’t hesitate to tell me (through comment, review, or DM) and I will fix the problem or explain the complexity as soon as possible.
 

related topics:  Trading signal, Ichimoku, Tenkensen, Kijunsen, Kumo, Senkou Span, Chikou Span, Conversion Line, Base Line, Lagging Span, ATR, ARC, Volatility System, Super Trend, trend trading, support and resistance levels

Önerilen ürünler
Matrix Currency
Augusto Martins Lopes
Matrix Currency – Multi-Timeframe Analysis Tool The Matrix Currency is an advanced indicator designed to analyze currency strength in the Forex market. It provides efficient monitoring and strategic support for traders seeking clear and actionable insights. Key Features Multi-Timeframe Analysis : Simultaneously monitors multiple timeframes (from M1 to MN1) with real-time updates, displayed in an intuitive matrix format. Alert System : Customizable notifications via pop-up, email, and mobile devi
FREE
Indicator MTF Qristalium Arrows is a semi - automatic trading system. It works on all currency pairs.  The indicator uses three rules: 1) we trade only on the trend, 2)"buy when everyone sells and sell when everyone buys", 3) the Price always goes against the crowd.  Indicator MTF Arrows Qristalium filter rules across multiple time frames using the built-in indicators. If the trend matches on the selected time intervals, the indicator will give an arrow to enter the market. Then you make you
Prime Power ML , sinyalleri görüntülemeden önce kazanma olasılığına göre filtreleyen iki ONNX sinir ağı modeli ile geliştirilmiş gelişmiş bir Currency Strength Meter'dır. Dövizler arasındaki her ayrışmayı gösteren geleneksel CSM göstergelerinin aksine, Prime Power ML yalnızca AI'nin istatistiksel bir avantaj onayladığı sinyalleri öne çıkarır. Nasıl çalışır Gösterge, tüm 28 döviz çifti üzerinde RSI skorlaması kullanarak 8 ana dövizin (USD, EUR, GBP, JPY, AUD, CAD, CHF, NZD) gerçek zamanlı gücünü
RSI Currency Strength Meter is a powerful and elegant multi-currency indicator that measures the real-time relative strength of the 8 major currencies using RSI logic. By calculating the smoothed performance of each currency across its major pairs and applying the RSI formula, it delivers clean and responsive strength lines that make it easy to spot which currencies are truly strong or weak at any moment. This indicator is particularly useful for visualizing currency correlations and divergence
This Volume Delta Profile is an advanced MetaTrader 5 indicator that visualizes   volume delta (order flow imbalance)   using a volume profile-style histogram. It shows the difference between buying and selling pressure at specific price levels, helping traders identify supply and demand zones. This indicator provides a unique perspective on market dynamics by visualizing the imbalance between buying and selling pressure, offering insights beyond traditional volume analysis. Core Concept Positiv
Visual Crocodile Pulse Indicator
AL MOOSAWI ABDULLAH JAFFER BAQER
Visual Crocodile Pulse Indicator Unlock the Market's True Momentum and Trade with Confidence Are you tired of lagging indicators and noisy charts that lead to false signals? The Visual Crocodile Pulse Indicator is a sophisticated, professional-grade trend analysis tool designed to give you a clear and decisive edge. By cutting through market noise, it identifies the powerful beginnings of new trends, helping you enter trades with higher precision and avoid choppy, unpredictable conditions. For
Was: $249  Now: $99   Market Profile defines a number of day types that can help the trader to determine market behaviour. A key feature is the Value Area, representing the range of price action where 70% of trading took place. Understanding the Value Area can give traders valuable insight into market direction and establish the higher odds trade. It is an excellent addition to any system you may be using. Inspired by Jim Dalton’s book “Mind Over Markets”, this indicator is designed to suit the
The GGP SuperTrend MT5  Indicator is a technical analysis tool that can assist investors in identifying market trends. The indicator is based on ATR and is very useful for capturing the direction of an asset’s momentum and is widely employed when looking at stocks, currencies, and commodities. It plots a line on the price chart, which acts as a dynamic level of support or resistance, helping traders and investors make informed decisions about entry and exit points. This indicator is MT5 conversi
Utraspikedetector
Odete Argelio Simbine
UltraSpikeDETECTOR for MQL5 is a professional market indicator designed to detect sudden price spikes and market trends efficiently. It provides real-time alerts, clear visual signals, and full integration with the MQL5 platform. Fully customizable and adaptable to various trading strategies, it helps traders monitor market movements more effectively. This tool is intended to support informed decision-making and improve trading analysis. No profit guarantees are provided, ensuring compliance wit
Crash 1000 Scalping Indicator for the Crash 1000 Deriv Synthetic Index. Introduction The Crash 1000 Scalping Indicator is a specialized tool designed for the Crash 1000 index on the Deriv Synthetic market. This indicator is particularly useful for scalping on the M1 timeframe, helping traders to identify precise entry and exit points for buy positions. It is designed to be non-repainting, providing clear signals with audible alerts and push notifications, and is compatible with mobile devices th
Sayı dizilerinden birine "Orman Yangını Dizisi" denir. En güzel yeni dizilerden biri olarak kabul edildi. Başlıca özelliği, bu dizinin lineer trendlerden, hatta en kısa olanlardan kaçınmasıdır. Bu göstergenin temelini oluşturan bu özelliktir. Bir finansal zaman serisini analiz ederken, bu gösterge tüm olası trend seçeneklerini reddetmeye çalışır. Ve ancak başarısız olursa, bir trendin varlığını tanır ve uygun sinyali verir. Bu yaklaşım, yeni trendlerin başladığı anların doğru bir şekilde belirl
Aura Smc Quantum H4
Chaibadee Dechtanankul
AURA SMC QUANTUM V1.01 code in English, structured for a professional presentation or MQL5 Market description: AURA SMC QUANTUM V1.01 | Logic Breakdown The Aura SMC Quantum is an advanced automated trading system (EA) specifically engineered for Gold (XAUUSD) on the H4 timeframe. It combines high-probability Smart Money Concepts (SMC) with a sophisticated Hybrid Grid management system. 1. Market Analysis Strategy (SMC & Trend Filter) The core "intelligence" of the EA relies on a dual-layer confi
Visual CrossPulse Dynamics Indicator
AL MOOSAWI ABDULLAH JAFFER BAQER
Visual CrossPulse Dynamics: Trade with the Market's True Rhythm Unlock a new level of market insight with Visual CrossPulse Dynamics, a sophisticated trading indicator designed to adapt to ever-changing volatility and reveal the true direction of the trend. Are you tired of indicators that lag in fast-moving markets or give false signals during consolidation? The Visual CrossPulse Dynamics indicator solves this problem by using an advanced, adaptive algorithm that intelligently adjusts to the m
This indicator is the mql5 version of the   SSLHybrid   indicator. MT4 Version Find out more here:  https://www.mql5.com/en/users/rashedsamir/seller Description of TradingView version: This script is designed for the NNFX Method, so it is recommended for Daily charts only. Tried to implement a few VP NNFX Rules This script has a SSL / Baseline (you can choose between the SSL or MA), a secondary SSL for continiuation trades and a third SSL for exit trades. Alerts added for Baseline entries, SSL
Max Min Delta Indicator - Market Volume Imbalance Analysis Gain Deeper Insights into Market Volume Imbalance with Delta Analysis What is the Max Min Delta Indicator? The Max Min Delta Indicator is a powerful market volume analysis tool that visually represents maximum and minimum delta values using a histogram. It helps traders identify market strength, weakness, absorption, and aggressive buying/selling activity with precision. Key Features Histogram Visualization: Displays Max Delta (Green) an
1. NeuroResonance v13.2 - Advanced Multi-Mode Analysis Indicator NeuroResonance is a sophisticated, multi-faceted trading indicator for MetaTrader 5 designed to provide non-repainting signals based on advanced market analysis. The indicator goes beyond traditional methods by integrating cycle analysis, market regime detection (trending vs. mean-reversion), and a proprietary Quantum State Collapse (QSC) engine to identify trading opportunities. It is designed as a comprehensive trading framework
ETE Detector v4.0 (Head & Shoulders) Author: KOUAME N’DA LEMISSA Version: 4.0 Platform: MetaTrader 5 Indicator Type: Chart / Visual Trading Signals Overview The ETE Detector v4.0 is a technical indicator designed to automatically detect classic and inverse Head & Shoulders patterns (H&S) on MT5 charts. These patterns are widely used to anticipate trend reversals. With this tool, traders can: Detect sell signals (classic H&S) and buy signals (inverse H&S) with accuracy. Easily visualize patterns
ALGOTRIBE Volatility Filter (GVZ + ATR) Institutional Volatility Intelligence for Smart Risk Control Category: Volatility & Risk Management Platform: MetaTrader 5 Type: Indicator (Chart Window) Overview ALGOTRIBE Volatility Filter is a next-generation volatility intelligence tool engineered to help traders anticipate, interpret, and manage market volatility with precision. By combining the CBOE Gold Volatility Index (GVZ) with a dynamic ATR-based engine , the indicator identifies real-ti
Gann Kutusu (veya Gann Meydanı), W.D. Gann'ın "Piyasa tahminleri için matematiksel formül" makalesine dayanan bir pazar analiz yöntemidir. Bu gösterge üç Kare modelini çizebilir: 90, 52(104), 144. Altı ızgara çeşidi ve iki yay çeşidi vardır. Bir grafik üzerinde aynı anda birden fazla kare çizebilirsiniz Parametreler Square — Gann kare modelinin seçimi: 90 — 90'ın karesi (veya dokuzun karesi); 52 (104) — 52'nin karesi (veya 104); 144 — 144'ün evrensel karesi; 144 (full) — karenin "tam" versiyo
TRI Visualizer
Yoshimi Mon 三 Ura
TRI Visualizer MT5 – Thermodynamic Market Analysis Overview The TRI (Thermal Range Indicator) Visualizer Enhanced is a rare market analysis indicator that goes beyond conventional technical analysis, applying principles of thermodynamics from physics. It interprets market price fluctuations as “thermodynamic energy,” enabling the highly accurate detection of subtle market changes that are often overlooked. Innovative Mechanisms 1. Dual Calculation Engines Classic TRI Mode Formula: |Close
The Supernova Momentums indicator simplifies the visual perception of the price chart and reduces the time for analysis: if there is no signal, the deal is not opened, and if an opposite signal appears, it is recommended to close the current position. This arrow indicator is designed to determine the trend. Supernova Momentums implements a trend trading strategy, filters out market noise, and includes all the necessary features in one tool. Its work is based on automatically determining the cu
Automate your ICT Analysis with the Accumulation, Manipulation, and Distribution (AMD) Indicator. This advanced trading tool is designed for Smart Money Concepts (SMC) traders who want to automate the tedious process of marking up charts. It automatically identifies the Asian Range (Accumulation), detects Liquidity Sweeps (Manipulation), and signals high-probability reversals confirmed by Fair Value Gaps (Distribution). Stop staring at the charts waiting for a sweep. Let the indicator alert you
DYJ TRADINGVIEW, küresel pazarlara giriş fırsatlarını bulmak için derecelendirme sinyalleri sayımlarını ve analiz araçlarını kullanan çok göstergeli bir derecelendirme sistemidir. DYJ TRADINGVIEW, pazar analizi için 10 yerleşik göstergeye sahiptir. Göstergeye dayalı analiz, birçok tüccar tarafından hangi işlemlerin yapılacağı ve bunlara nereden girilip çıkılacağı konusunda karar vermelerine yardımcı olmak için kullanılır. Birbirini iyi tamamlayabilecek birkaç farklı tür kullanıyoruz. Pazarı
PULLBACK HUNTER What is every trader's cherished dream? To see without delay the places where the reversal will happen. This, of course, is from the category of magic, though... nothing is impossible. But for now I've prepared for you an indicator that marks in real time the end of corrections to the current movement or in short - catches pullbacks.What is the main point? Many people practice rebounds when the price moves in the direction of the open position. And they do them on the formation o
Level Volume Pro
John Samfel Bucton Josol
HAT IT DOES   MONTHLY HIGH & LOW — AUTO-DRAWN EVERY MONTH Draws the High and Low of every month for the current year (or any year you set). Each level extends as a horizontal ray into the future so you always see where price is reacting to historical monthly extremes. Color-coded (blue = high, red = low), labeled (JAN HIGH, FEB LOW etc.), fully customizable width and style. Toggle individual months on or off.   WEEKLY HIGH & LOW
Range Directional Force Indicator – Designed for You to Optimize! The Range Directional Force Indicator is a cutting-edge tool designed to empower traders by visualizing market dynamics and directional strength. Built to offer insights into market trends and reversals, this indicator is an invaluable asset for traders seeking precision in their strategies. However, it is important to note that this indicator is not optimized, leaving room for you to tailor it to your unique trading preferences.
Moving Average Multicurrency Scanner MT5'ı tanıtıyoruz, çeşitli zaman dilimlerinde birden fazla döviz çiftini izleyerek ticaret deneyiminizi geliştirmek için tasarlanmış son teknoloji bir göstergedir. Bu araç, trendleri belirlemek ve bilinçli ticaret kararları almak için hareketli ortalamalara güvenen tüccarlar için idealdir. Moving Average Multicurrency Scanner MT5 ile piyasa hareketlerini zahmetsizce analiz edebilir ve zamanında sinyaller alarak gerçek zamanlı ticaret fırsatlarından yararlanab
Stroben
Samuel Alfred Preston
The StrobeIndicatorDynamic is the indicator counterpart to the Strobe Expert Advisor, delivering a sophisticated trading strategy that generates precise entry signals through the integration of multiple technical indicators. Designed for MetaTrader 5, this advanced tool combines robust analytical capabilities with a streamlined user experience, catering to traders seeking both performance and ease of use. Key Features: Optimized Input Presets : Features a simplified input structure with five dis
Fibo Channels
Jeffrey Quiatchon
Fibo Daily Channel Indicator The  Indicator is a powerful tool for traders, providing precise daily support and resistance levels based on Fibonacci retracement and extension calculations. This indicator automatically draws key pivot points (PP, R1, R2, S1, S2) as well as additional extension levels (R3, R4, S3, S4), helping traders identify potential reversal and breakout zones with ease. It includes customizable alerts and push notifications, allowing traders to receive updates whenever the pr
Bollinger Bantları Kontrol Paneli göstergesi, tek bir panel (Kontrol Paneli) kullanarak Bollinger Bantları gösterge sinyallerini farklı zaman dilimlerinde takip etmenin kullanışlı ve bilgilendirici bir yolunu sunar. Bu araç, yatırımcıların ihtiyaç duydukları bilgileri hızlı ve kolay bir şekilde elde etmelerine olanak tanıyarak piyasada etkili karar almalarına olanak tanır. Temel özellikleri: 1. **Sinyaller Paneli**: Kontrol Paneli, seçilen zaman dilimleri için Bollinger Bantları sinyallerini
Bu ürünün alıcıları ayrıca şunları da satın alıyor
ARIPoint
Temirlan Kdyrkhan
ARIPoint is a powerful trading companion designed to generate high-probability entry signals with dynamic TP/SL/DP levels based on volatility. Built-in performance tracking shows win/loss stats, PP1/PP2 hits, and success rates all updated live. Key Features: Buy/Sell signals with adaptive volatility bands Real-time TP/SL/DP levels based on ATR Built-in MA Filter with optional ATR/StdDev volatility Performance stats panel (Success, Profit/Loss, PP1/PP2) Alerts via popup, sound, push, or email Cu
SuperScalp Pro
Van Minh Nguyen
4.57 (21)
SuperScalp Pro – Gelişmiş Çoklu Filtre Scalping Gösterge Sistemi SuperScalp Pro, işlem fırsatlarını belirlemeye yardımcı olmak için klasik Supertrend ile birden fazla akıllı onay filtresini birleştiren gelişmiş bir scalping göstergesidir. M1’den H4’e kadar farklı zaman dilimlerinde verimli şekilde çalışır ve XAUUSD, BTCUSD ile majör Forex pariteleri için optimize edilmiştir. Gösterge, net Al ve Sat sinyalleri sunar ve ATR tabanlı otomatik giriş fiyatı, stop loss ve take profit seviyeleri hesapla
Divergence Bomber
Ihor Otkydach
4.9 (87)
Bu göstergeyi satın alan herkese aşağıdaki ekstra içerikler ücretsiz olarak sunulmaktadır: Her işlemi otomatik olarak yöneten, Stop Loss ve Take Profit seviyelerini ayarlayan ve işlemleri strateji kurallarına göre kapatan özel yardımcı araç: "Bomber Utility" Göstergenin farklı varlıklar üzerinde kullanılmasına yönelik ayar dosyaları (set dosyaları) Bomber Utility için 3 farklı modda kullanım sunan ayar dosyaları: "Minimum Risk", "Dengeli Risk" ve "Bekle-Gör Stratejisi" Bu ticaret stratejisini hı
Entry In The Zone and SMC Multi Timeframe is a real-time 2-in-1 market analysis tool that combines market structure analysis and a No Repaint BUY / SELL signal system into a single indicator, built on Smart Money Concepts (SMC) — a widely adopted framework used by professional traders to understand market structure. This indicator helps you see the market more clearly, make decisions based on structure rather than guesswork, and focus on high-probability zones where price is more likely to react
Power Candles MT5
Daniel Stein
4.75 (8)
Power Candles V3 - İlk Kendi Kendini Optimize Eden Güç Göstergesi Power Candles V3 , güç analizini doğrudan işlem yapılabilir bir sisteme dönüştürür. Gösterge artık grafiğinizi yalnızca piyasa gücüne göre renklendirmekle kalmaz; arka planda canlı bir otomatik optimizasyon çalıştırır ve sembolünüz için en iyi Stop Loss, Take Profit ve sinyal eşiğini size sunar. Tek tıklama ile bu ayar canlı işlem için devreye girer. Bu araç Stein Investments ekosisteminin bir parçasıdır.  18 aracın tümünü keşfed
Quantum TrendPulse
Bogdan Ion Puscasu
5 (23)
SuperTrend   ,   RSI   ve   Stochastic'in   gücünü tek bir kapsamlı göstergede birleştirerek işlem potansiyelinizi en üst düzeye çıkaran nihai işlem aracı olan   Quantum TrendPulse'u   tanıtıyoruz. Hassasiyet ve verimlilik arayan yatırımcılar için tasarlanan bu gösterge, piyasa trendlerini, momentum değişimlerini ve en uygun giriş ve çıkış noktalarını güvenle belirlemenize yardımcı olur. Temel Özellikler: SuperTrend Entegrasyonu:   Güncel piyasa trendlerini kolayca takip edin ve karlılık dalgası
Azimuth Pro
Ottaviano De Cicco
5 (7)
Azimuth Pro V2: Synthetic Fractal Structure and Confirmed Entries for MT5 Overview Azimuth Pro is a multi-level swing structure indicator by Merkava Labs . Four nested swing layers, swing-anchored VWAP, ABC pattern detection, three-timeframe structural filtering, and closed-bar confirmed entries — one chart, one workflow from micro-swings to macro-cycles. This is not a blind signal product. It is a structure-first workflow for traders who care about location, context, and timing. V2 Launch Offe
Grabber System MT5
Ihor Otkydach
4.83 (23)
Size mükemmel bir teknik gösterge olan Grabber’ı tanıtıyorum. Bu araç, kullanıma hazır bir “her şey dahil” işlem stratejisi olarak çalışır. Tek bir yazılım kodu içinde güçlü piyasa teknik analiz araçları, işlem sinyalleri (oklar), uyarı işlevleri ve push bildirimleri entegre edilmiştir. Bu göstergeyi satın alan herkes aşağıdaki hediyeleri ücretsiz olarak alır: Açık emirleri otomatik yönetmek için Grabber Yardımcı Aracı Kurulum, yapılandırma ve nasıl işlem yapılacağını adım adım anlatan video kıl
Bu indikatörü satın alırsanız, Profesyonel Trade Manager’ımı  + EA ÜCRETSİZ olarak alacaksınız. Öncelikle, bu Ticaret Sistemi'nin Non-Repainting, Non-Redrawing ve Non-Lagging Göstergesi olduğunu vurgulamak önemlidir, bu da hem manuel hem de robot ticareti için ideal hale getirir. Online kurs, kılavuz ve ön ayarları indir. "Smart Trend Trading System MT5", yeni ve deneyimli tüccarlar için özelleştirilmiş kapsamlı bir ticaret çözümüdür. 10'dan fazla premium göstergeyi birleştiriyor ve 7'den fazla
SignalTech MT5 is a trading system for EURUSD, USDCHF, USDJPY, AUDUSD, NZDUSD, EURJPY, AUDJPY, NZDJPY, CADJPY H2 and H3 Timeframe.  It can generate signals with Buy/Sell Arrows and Pop-Up/Sound Alerts. Each signal has clear Entry and Stop Loss levels, which should be automatically flagged on the chart, as well as potential Targets 1, 2, and 3. The Entry and TP levels are fixed after the trade is taken. The exit level is dynamic. If there are signs of a potential short-term trend reversal, the
Gann Made Easy , bay teorisini kullanarak ticaretin en iyi ilkelerine dayanan, profesyonel ve kullanımı kolay bir Forex ticaret sistemidir. WD Gann. Gösterge, Zararı Durdur ve Kâr Al Seviyeleri dahil olmak üzere doğru SATIN AL ve SAT sinyalleri sağlar. PUSH bildirimlerini kullanarak hareket halindeyken bile işlem yapabilirsiniz. Satın alma işleminden sonra, alım satım talimatlarını ve harika ek göstergeleri ücretsiz olarak almak için lütfen benimle iletişime geçin! Muhtemelen Gann ticaret yöntem
FX Trend MT5 NG
Daniel Stein
5 (4)
FX Trend NG: Yeni Nesil Çoklu Piyasa Trend Zekâsı Genel Bakış FX Trend NG , çoklu zaman dilimlerinde çalışan profesyonel bir trend analiz ve piyasa izleme aracıdır. Piyasanın yapısını saniyeler içinde anlamanızı sağlar. Birden fazla grafik arasında geçiş yapmak yerine, hangi enstrümanların trendde olduğunu, momentumun nerede zayıfladığını ve hangi zaman dilimlerinin uyumlu olduğunu anında görebilirsiniz. Lansman Teklifi – FX Trend NG sadece $30 (6 Ay) veya $80 Ömür Boyu Lisans ile edinin. Zate
Meravith MT5
Ivan Stefanov
5 (1)
Göstergе, herhangi bir noktadan hacmi analiz eder ve bu hacim için piyasanın tükeniş seviyelerini hesaplar. Meravith’in ana çizgileri: Boğa hacim tükeniş çizgisi – hedef olarak kullanılır. Ayı hacim tükeniş çizgisi – hedef olarak kullanılır. Trend çizgisi – piyasa trendini gösterir. Piyasanın boğa mı ayı mı olduğuna bağlı olarak rengi değişir ve trend desteği görevi görür. Nasıl kullanılır: Mor dikey çizgiye çift tıklayın ve istediğiniz konuma taşıyın. Her şeyi analiz edebilirsiniz – trendleri v
Atomic Analyst MT5
Issam Kassas
3.94 (31)
Öncelikle belirtmek gerekir ki bu Ticaret Göstergesi Yeniden Çizim Yapmaz, Gecikmez ve Gecikme Göstermez, bu da hem manuel hem de robot ticareti için ideal hale getirir. Kullanıcı kılavuzu: ayarlar, girişler ve strateji. Atom Analisti, Piyasada Daha İyi Bir Avantaj Bulmak İçin Fiyatın Gücünü ve Momentumunu Kullanan PA Fiyat Hareketi Göstergesidir. Gürültüleri ve Yanlış Sinyalleri Kaldırmaya ve Ticaret Potansiyelini Artırmaya Yardımcı Olan Gelişmiş Filtrelerle Donatılmıştır. Birden fazla katmanl
Bill Williams Advanced
Siarhei Vashchylka
5 (11)
Bill Williams Advanced is designed for automatic chart analysis using Bill Williams' "Profitunity" system. The indicator analyzes four timeframes at once. Manual (Be sure to read before purchasing) Advantages 1. Analyzes the chart using Bill Williams' "Profitunity" system. Signals are displayed in a table in the corner of the screen and on the price chart. 2. Finds all known AO and AC signals, as well as zone signals. Equipped with a trend filter based on the Alligator. 3. Finds "Divergence Bar
Trend Screener Pro MT5
STE S.S.COMPANY
4.85 (104)
Trend Göstergesi, Trend Alım Satım ve Filtreleme için Çığır Açan Benzersiz Çözüm, Tüm Önemli Trend Özellikleriyle Tek Bir Araç İçinde Yerleştirildi! Forex, emtialar, kripto para birimleri, endeksler ve hisse senetleri gibi tüm sembollerde/araçlarda kullanılabilen %100 yeniden boyamayan çoklu zaman çerçevesi ve Çoklu para birimi göstergesidir. Trend Screener, grafikte noktalarla ok trend sinyalleri sağlayan etkili bir trend trend göstergesidir. Trend analizörü göstergesinde bulunan özellikler: 1.
Önce dürüst olalım. Hiçbir gösterge tek başına sizi kârlı yapmaz. Eğer biri size aksini söylüyorsa, size bir hayal satıyordur. Mükemmel al/sat okları gösteren her gösterge, kusursuzmuş gibi görünecek şekilde yapılabilir — sadece geçmişin doğru bir bölümünü yakınlaştırıp kazanan işlemleri ekran görüntüsü almanız yeterlidir. Biz bunu yapmıyoruz.  SMC Intraday Formula bir araçtır. Piyasa yapısını sizin için okur, en yüksek olasılıklı fiyat bölgelerini belirler ve şu anda akıllı paranın izinin nası
Top indicator for MT5   providing accurate signals to enter a trade without repainting! It can be applied to any financial assets:   forex, cryptocurrencies, metals, stocks, indices .  Watch  the video  (6:22) with an example of processing only one signal that paid off the indicator! MT4 version is here It will provide pretty accurate trading signals and tell you when it's best to open a trade and close it. Most traders improve their trading results during the first trading week with the help of
Tanıtım       Quantum Breakout PRO   , Breakout Bölgeleri ile ticaret yapma şeklinizi değiştiren çığır açan MQL5 Göstergesi! 13 yılı aşkın ticaret tecrübesine sahip deneyimli tüccarlardan oluşan bir ekip tarafından geliştirilmiştir.       Kuantum Breakout PRO       yenilikçi ve dinamik koparma bölgesi stratejisiyle ticaret yolculuğunuzu yeni zirvelere taşımak için tasarlanmıştır. Kuantum Breakout Göstergesi, size 5 kar hedefi bölgesi ile kırılma bölgelerinde sinyal okları ve kırılma kutusuna da
Hangi stratejinin sizin sembolunuzde gercekten calistigini gorun - gercek paranizi riske atmadan once. Power Bar, herhangi bir sembol ve herhangi bir zaman diliminde asiri fiyat barlarini tespit eder, ardindan 3 farkli islem stratejisini aninda geriye donuk test eder. Boylece kazanma oranlarini, kar faktorlerini ve P&L'yi yan yana karsilastirabilirsiniz. Tek bir interaktif panelde. Tahmin yok. Esriye uydurma yok. Sadece veri. Power Bar'i benzersiz yapan nedir? Cogu indikator size bir sinyal ver
FX Power MT5 NG
Daniel Stein
5 (31)
FX Power: Daha Akıllı Ticaret Kararları için Para Birimlerinin Gücünü Analiz Edin Genel Bakış FX Power , her piyasa koşulunda başlıca para birimlerinin ve altının gerçek gücünü anlamak için vazgeçilmez bir araçtır. Güçlü para birimlerini alıp zayıf olanları satarak, FX Power ticaret kararlarınızı basitleştirir ve yüksek olasılıklı fırsatları ortaya çıkarır. İster trendlere sadık kalın ister Delta'nın aşırı değerlerini kullanarak tersine dönüşleri öngörün, bu araç ticaret tarzınıza mükemmel bir
Btmm state engine pro
Garry James Goodchild
5 (4)
BTMM State Engine Pro is a MetaTrader 5 indicator for traders who use the Beat The Market Maker approach: Asian session context, kill zone timing, level progression, peak formation detection, and a multi-pair scanner from a single chart. It combines cycle state logic with a built-in scanner dashboard so you do not need the same tool on many charts at once. What it does Draws the Asian session range; session times can follow broker server offset or be set in inputs. Tracks level progression (L
OmniSync Projection
Antonio-alin Teculescu
5 (1)
Chronos Fractal Engine is an innovative price projection indicator for MetaTrader 5, designed to transform your technical analysis by intelligently identifying and projecting historical price patterns. Built upon an advanced correlation algorithm and the fractal principles of the market, this powerful tool visualizes potential future price movements, giving you a unique edge in your trading decisions. What is Chronos Fractal Engine? At its core, the Chronos Fractal Engine employs a sophisticat
Crystal Heikin Ashi Signals
Muhammad Jawad Shabir
5 (2)
Crystal Heikin Ashi Signals - Professional Trend & Signal Detection Indicator Advanced Heikin Ashi Visualization with Intelligent Signal System for Manual & Automated Trading Final Price: $149 ---------> Price goes up $10 after every 10 sales . Limited slots available — act fast . Overview Crystal Heikin Ashi Signals is a professional-grade MetaTrader 5 indicator that combines pure Heikin Ashi candle visualization with an advanced momentum-shift detection system. Designed for both manual traders
Market Structure Order Block Dashboard MT5, piyasa yapısını ve ana fiyat reaksiyon bölgelerini doğrudan grafikte okumak isteyen traderlar için tasarlanmış bir MT5 göstergesidir. BOS, ChoCH, Order Blocks, Fair Value Gaps (FVG), Likidite, Kill Zones, Volume Profile ve hızlı analiz için kompakt bir paneli bir araya getirir. Bu gösterge, piyasa yapısını, ICT ve Smart Money kavramlarını karar çerçevesi olarak kullanan traderlara yöneliktir. Trend devamlarını, olası tersine dönüşleri, fiyat dengesizli
Berma Bands
Muhammad Elbermawi
5 (8)
Berma Bantları (BB'ler) göstergesi, piyasa trendlerini belirlemeyi ve bunlardan yararlanmayı amaçlayan yatırımcılar için değerli bir araçtır. Fiyat ile BB'ler arasındaki ilişkiyi analiz ederek, yatırımcılar bir piyasanın trend veya aralıklı fazda olup olmadığını ayırt edebilir. Daha fazla bilgi edinmek için [ Berma Home Blog ] adresini ziyaret edin. Berma Bantları üç belirgin çizgiden oluşur: Üst Berma Bandı, Orta Berma Bandı ve Alt Berma Bandı. Bu çizgiler fiyatın etrafına çizilir ve genel tren
Gartley Hunter Multi
Siarhei Vashchylka
5 (11)
Gartley Hunter Multi - An indicator for searching for harmonic patterns simultaneously on dozens of trading instruments and on all possible timeframes. Manual (Be sure to read before purchasing) | Version for MT4 Advantages 1. Patterns: Gartley, Butterfly, Shark, Crab. Bat, Alternate Bat, Deep Crab, Cypher 2. Simultaneous search for patterns on dozens of trading instruments and on all possible timeframes 3. Search for patterns of all possible sizes. From the smallest to the largest 4. All fou
Auto Optimized Parabolic RSI: Gelişmiş 3D Momentum Motoru Çoğu perakende indikatörü, piyasa volatilitesi değiştiği an çöken statik girdilere dayandığı için başarısız olur. Auto Optimized Parabolic RSI, kendi matematiksel avantajını sürekli olarak yeniden hesaplayarak "indikatör körelmesi" (indicator decay) sorununu çözer ve kurumsal düzeyde kantitatif adaptasyonu doğrudan MT5 terminalinize getirir. Temel Avantaj: Özel Bellek İçi (In-Memory) 3D Optimizasyon Standart otomatik optimize ediciler, te
FX Levels MT5
Daniel Stein
5 (13)
FX Levels: Tüm Piyasalar İçin Son Derece Hassas Destek ve Direnç Hızlı Bakış Döviz kurları, endeksler, hisseler veya emtialar gibi herhangi bir piyasada güvenilir destek ve direnç seviyeleri belirlemek mi istiyorsunuz? FX Levels geleneksel “Lighthouse” yöntemini ileri düzey bir dinamik yaklaşımla birleştirerek neredeyse evrensel bir doğruluk sağlar. Gerçek broker deneyimimize ve otomatik günlük güncellemeler ile gerçek zamanlı güncellemelerin birleşimine dayalı olarak, FX Levels size dönüş nok
IX Power MT5
Daniel Stein
4.92 (13)
IX Power: Endeksler, Emtialar, Kripto Paralar ve Forex Piyasaları için İçgörüler Genel Bakış IX Power , endeksler, emtialar, kripto paralar ve forex sembollerinin gücünü analiz etmek için tasarlanmış çok yönlü bir araçtır. FX Power , tüm kullanılabilir döviz çiftlerinin verilerini kullanarak döviz çiftleri için maksimum doğruluk sağlarken, IX Power yalnızca temel sembolün piyasa verilerine odaklanır. Bu, IX Power 'ı forex dışındaki piyasalar için ideal ve daha basit forex analizleri için güven
Yazarın diğer ürünleri
MACD Classic Smoothed
Shahabeddin Baset
4.83 (24)
Classic MACD It has MACD line, Signal line, and Histogram . The Histogram has 4 colors , showing its movement direction as simple as possible. The smoothing factor in the input helps to eliminate noisy signals. Besides different price types (hlc, hlcc, ohlc, ...), there is an option to use volume data as the source for MACD calculations (which is better to be used by real volume not unreliable tick volume). While the original MACD indicator uses Exponential Moving Average, this indicator provide
FREE
OBV macd
Shahabeddin Baset
5 (5)
OBV MACD Calculating MACD based on OBV data Features 3 outputs: MACD & Signal & Histogram 4 Colored Histogram Smoothing factor show/hide option for MACD & Signal lines Description Among the few indicators developed for working with volume data, OBV (On Balance Volume) is the simplest yet most informative one. Its logic is straightforward: when the closing price is above the previous close, today's volume is added to the previous OBV; conversely, when the closing price is below the previous close
FREE
ADXW Cloud Pro
Shahabeddin Baset
Full implementation of Directional Movement System for trading, originally developed by Welles Wilder, with modifications to improve profitability, to reduce the number of unfavorable signals, and with Stop Loss lines. No re-paint Features Buy/sell signals displayed on the chart Stop levels visually indicated on the chart Profit-taking points presented in the indicator window Exit points for unfavorable positions presented in the indicator window Signal confirmation through high/low swing cros
ADXW Cloud
Shahabeddin Baset
4.5 (6)
This is Wilder's ADX with cloud presentation of DI+ & DI- lines. Features 4 standard lines of the ADX indicator: DI+, DI-, ADX, ADXR cloud presentation of DI+/DI- lines with transparent colors applicable to all time-frames and all markets What Is ADX J. Welles Wilder Jr., the developer of well-known indicators such as RSI, ATR, and Parabolic SAR, believed that the Directional Movement System, which is partially implemented in ADX indicator, was his most satisfying achievement. In his 1978 book,
FREE
ARC Ichimoku
Shahabeddin Baset
5 (2)
Combination of Ichimoku and Super Trend indicators. 1. ARC (Average Range times Constant) The concept of ARC or Volatility System was introduced by Welles Wilder Jr. in his 1978 book, New Concepts in Technical Trading Systems . It has since been adapted and modified into the popular Super Trend indicator. The fundamental idea behind ARC is simple: to identify support and resistance levels, you multiply a constant with the Average True Range (ATR) . Then, you either subtract or add the resulting
FREE
High Low Swing
Shahabeddin Baset
High Low Swing (HLS) Indicator The HLS indicator is a technical analysis tool designed to identify swing highs and lows in the market, aiding swing traders in making informed decisions. It offers an adjustable "degree" parameter, allowing you to customize the sensitivity to strong price movements based on current market conditions. Features: •    Clear Buy/Sell Signals: The indicator plots signals directly on the chart, simplifying trade identification. •    Adjustable Swing Strength: The "degr
FREE
Features All Ichimoku Signals (Selectable) : Display all reliable signals generated by the Ichimoku indicator. You can choose which signals to view based on your preferences. Filter by Signal Strength : Sort signals by their strength—whether they are weak, neutral, or strong. Live Notifications : Receive real-time notifications for Ichimoku signals. Transparent Cloud : Visualize the Ichimoku cloud in a transparent manner. Available Signals Tenkensen-Kijunsen Cross Price-Kijunsen Cross Price-C
Includes almost all the concepts related to Volume Profile: POC , Value Area , Developing POC , Anchored VWAP , Volume Delta ; since the “Total” in its name. It is fast in its calculations and simple to work with. Features: 1.    Selectable calculation timeframe to find most traded levels. 2.    Capable of calculating Volume Profile based on tick data 3.    Adjustable histogram bars by their count. 4.    Adjustable histogram bars by their height (price range). 5.    Showing Value Area (VA
Filtrele:
Değerlendirme yok
Değerlendirmeye yanıt