AstraWave Probability Forecast
- Göstergeler
- Sürüm: 1.0
- Etkinleştirmeler: 5

AstraWave Probability Forecast
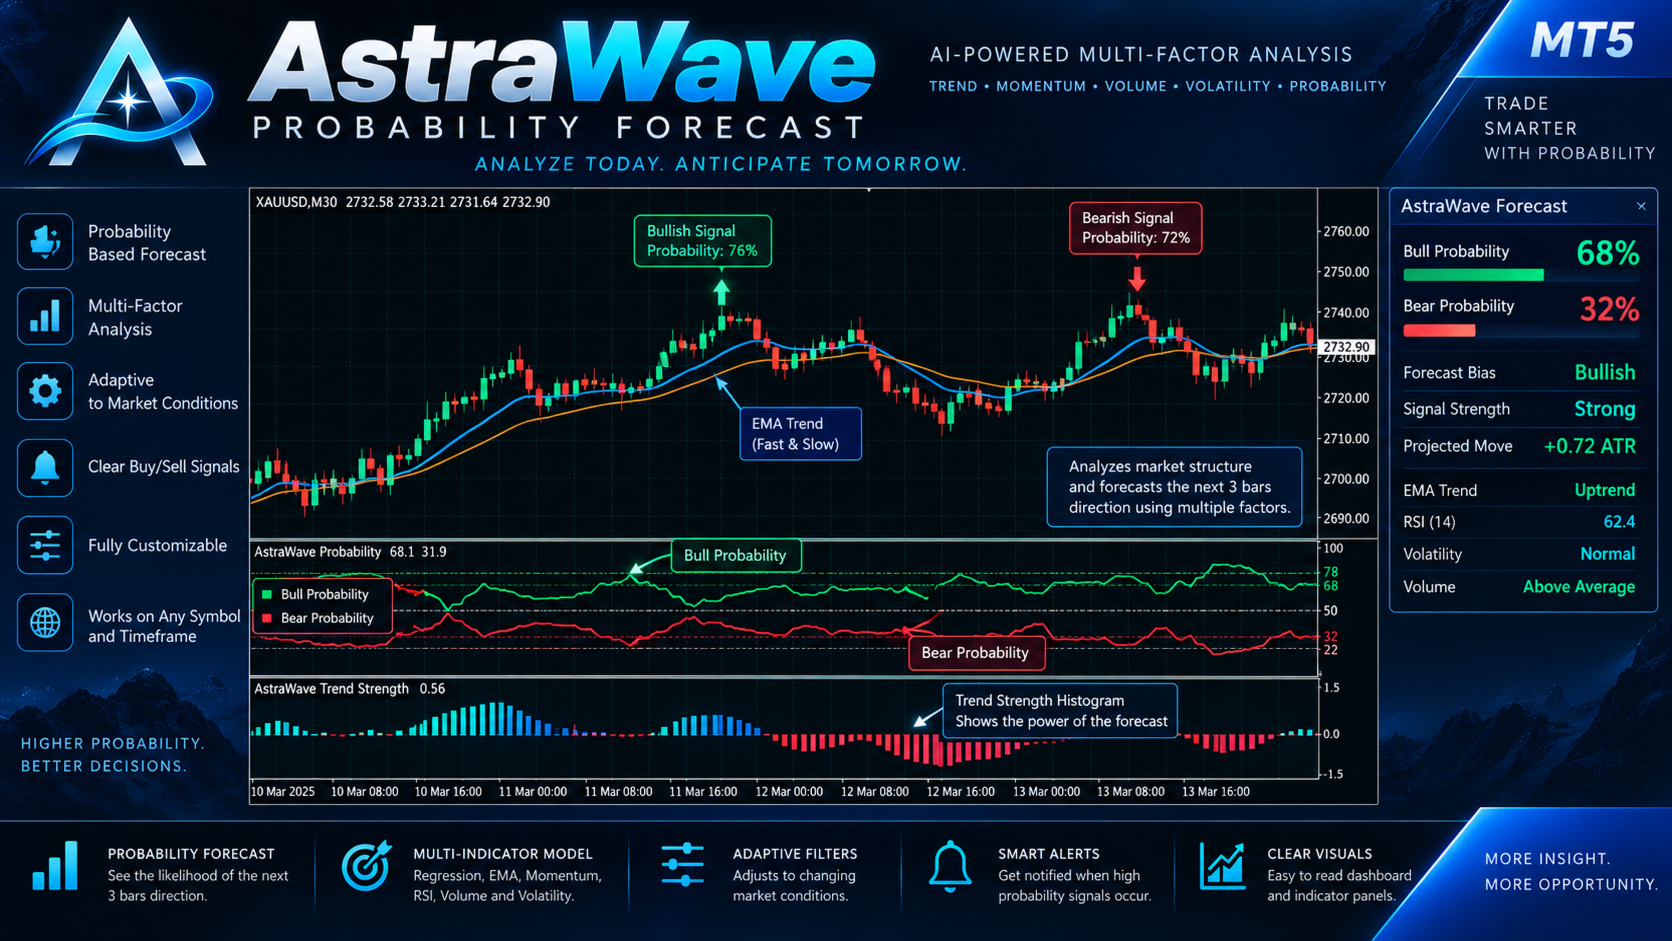
AstraWave Probability Forecast is a probabilistic market direction indicator designed for MetaTrader 5.
The indicator analyzes several market components at the same time and converts them into a forward-looking bullish or bearish probability estimate.
Instead of displaying only current momentum or trend direction, AstraWave evaluates recent market structure and produces a probability-based forecast for the next several bars.
The indicator does not guarantee future market direction. It provides a statistical bias based on current and recent market conditions.
MAIN FEATURES
- Bullish Probability calculation
- Bearish Probability calculation
- Forward market bias estimation
- Multi-factor market analysis
- Linear regression trend analysis
- Fast and Slow EMA trend structure
- Momentum analysis
- RSI confirmation
- ATR volatility analysis
- Tick-volume behavior
- Adaptive volatility reliability filter
- Closed-bar signal confirmation
- Bullish and bearish forecast signals
- Strong bullish / bearish classification
- Estimated forward move in ATR terms
- On-chart forecast dashboard
- Optional popup alerts
- Optional push notifications
- Configurable probability thresholds
- Configurable component weights
PROBABILITY FORECAST
AstraWave converts the combined model output into two probability-style readings:
Bull Probability
Bear Probability
For example:
Bull Probability: 74%
Bear Probability: 26%
This means the indicator currently detects a stronger bullish bias based on the analyzed market factors.
The percentages represent the internal model's directional confidence and should not be interpreted as guaranteed real-world probabilities.
FORWARD BIAS
By default, AstraWave evaluates the expected directional bias for the next 3 bars.
The number of forecast bars can be adjusted in the indicator settings.
Possible dashboard states include:
Strong Bullish
Bullish
Neutral
Bearish
Strong Bearish
DEFAULT SIGNAL LEVELS
The default probability thresholds are:
Signal Probability: 68%
Strong Probability: 78%
A bullish signal can appear when Bull Probability crosses above the configured signal threshold.
A bearish signal can appear when Bear Probability crosses above the configured signal threshold.
Signals are evaluated using completed candles to reduce changes caused by unfinished bar movement.
MULTI-FACTOR MODEL
AstraWave combines several independent components.
1. Linear Regression
The indicator calculates the slope of recent price movement using linear regression.
The slope is normalized using ATR to make the calculation more adaptive across different volatility environments.
2. EMA Trend Structure
A Fast EMA and Slow EMA are used to evaluate the underlying market trend.
Default values:
Fast EMA: 12
Slow EMA: 34
The distance between both averages contributes to the final forecast score.
3. Momentum
Recent price change is compared with current ATR.
This helps the model identify whether directional movement has enough strength relative to current volatility.
4. RSI
RSI is used as an additional momentum and directional confirmation component.
Values above the neutral area can contribute to bullish probability, while values below the neutral area can contribute to bearish probability.
Default RSI Period: 14
5. Tick Volume
Current tick volume is compared with its recent average.
Volume expansion can strengthen the directional model when price movement is supported by increased market activity.
ADAPTIVE VOLATILITY FILTER
AstraWave uses ATR to evaluate the current volatility regime.
When volatility is unusually low, the model can automatically reduce its confidence level.
This adaptive behavior helps prevent weak market movement from being interpreted as a high-confidence directional forecast.
PROJECTED MOVE
AstraWave also provides an estimated forward movement expressed in ATR.
Example:
Projected 3-bar move: +0.65 ATR
A positive value represents an estimated bullish move.
A negative value represents an estimated bearish move.
This is a model-based estimate and not a guaranteed price target.
FORECAST DASHBOARD
The indicator includes a compact dashboard displaying:
- Forecast Bias
- Bull Probability
- Bear Probability
- Projected multi-bar move
- EMA trend direction
- RSI value
- Current model confidence
This allows traders to review the most important forecast information quickly.
CUSTOMIZABLE MODEL
Advanced users can adjust how strongly each component contributes to the final calculation.
Available weights include:
- Regression Weight
- Trend Weight
- Momentum Weight
- RSI Weight
- Volume Weight
Users can also configure:
- Regression Lookback
- EMA periods
- RSI period
- ATR period
- Volume lookback
- Momentum period
- Number of forecast bars
- Signal Probability
- Strong Probability
- Minimum volatility requirement
ALERT SYSTEM
Optional alerts can notify the user when a new probability threshold is crossed.
Available alert options include:
- MetaTrader popup alerts
- Push notifications
- One alert per completed bar
Alerts are disabled by default and can be enabled from the indicator inputs.
WHO CAN USE ASTRAWAVE?
AstraWave Probability Forecast can be used by:
- Forex traders
- Gold traders
- Index traders
- Intraday traders
- Swing traders
- Momentum traders
- Trend traders
- Manual traders
- Traders looking for directional confirmation
The indicator can be attached to different symbols and timeframes available in MetaTrader 5.
HOW TO USE
1. Attach AstraWave Probability Forecast to a chart.
2. Observe Bull Probability and Bear Probability.
3. Review the Forecast Bias on the dashboard.
4. Watch for probability readings above the configured signal threshold.
5. Check trend, RSI and projected ATR movement.
6. Use the forecast together with your own trading strategy and risk management rules.
IMPORTANT
AstraWave Probability Forecast is a technical analysis and probabilistic forecasting tool.
It does not guarantee future market direction.
It does not guarantee profitable trades.
It does not automatically open or close positions.
A high Bull or Bear Probability does not mean the market will certainly move in that direction.
Financial markets are uncertain and can change rapidly.
The probability readings are generated from the indicator's internal mathematical model using historical and current market data.
Past indicator behavior does not guarantee future results.
AstraWave Probability Forecast is designed to help traders evaluate directional market bias and incorporate that information into their own independent trading decisions.