ICT Pro for MT5
- Göstergeler
- Sürüm: 1.0
- Etkinleştirmeler: 20

This draws fewer zones than the free order block indicators do. That's the whole point, and it's worth saying before you look at a screenshot and decide something is broken.
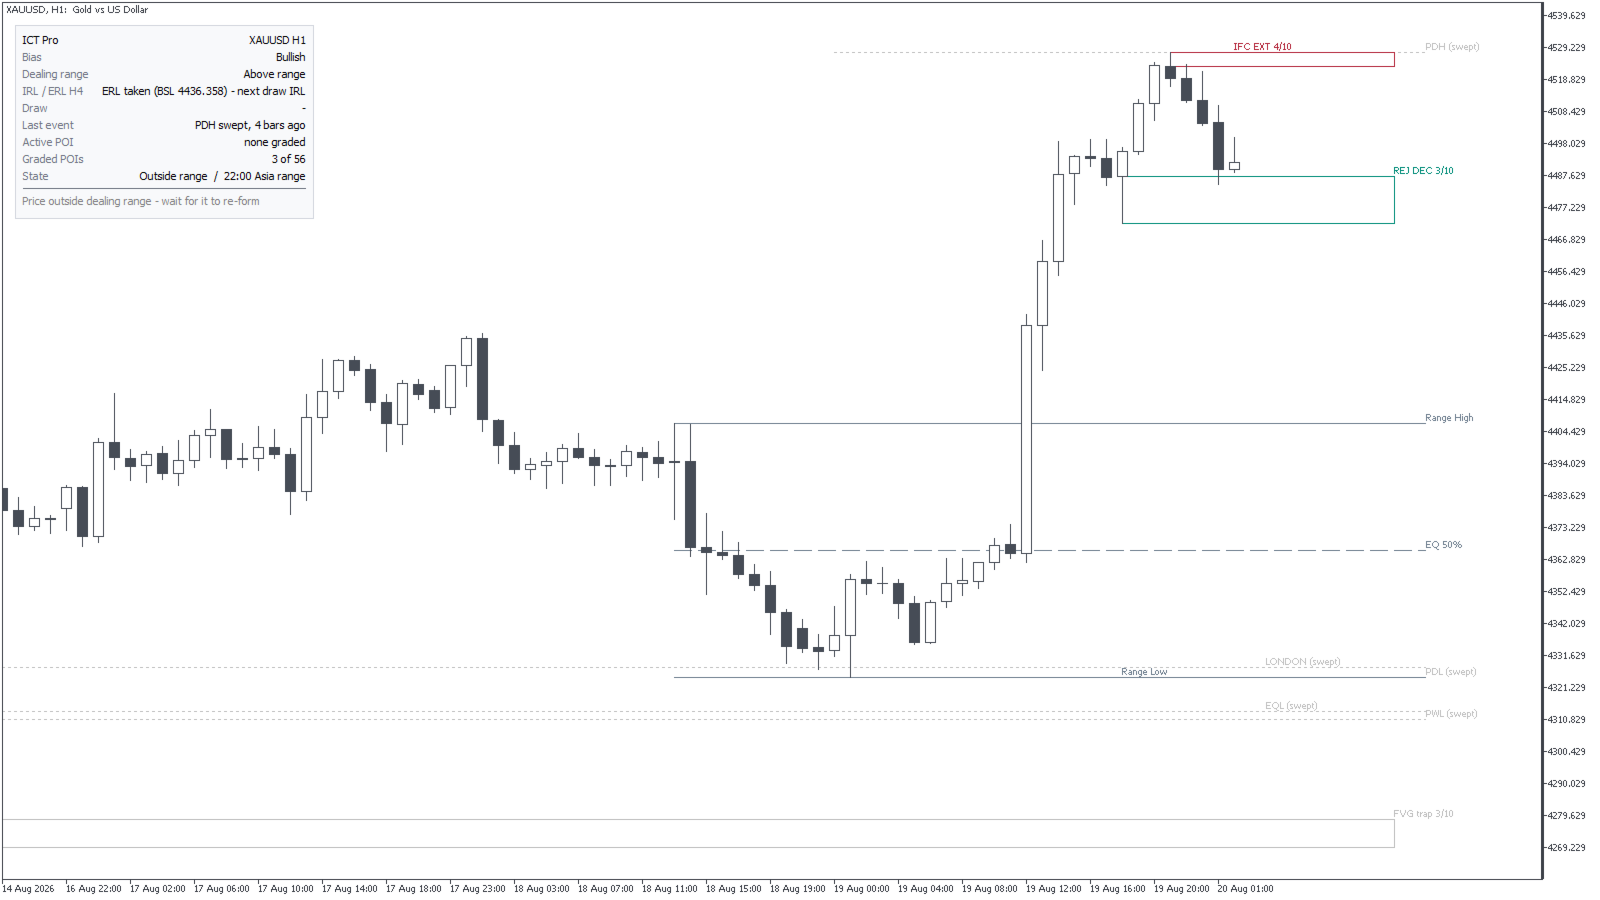
On the gold chart I grabbed while writing this, the engine found 54 points of interest and marked 2 as tradeable. The other 52 sit on the chart only if you ask for them, greyed out and labelled what the material calls them: traps.
Why it draws less than everything else
Every order block tool I've used marks every block. Scroll back and the chart is a wall of rectangles, and since price eventually touches most of them, the tool always looks right in hindsight and never helps you in advance.
The source material doesn't say that. It says a leg has a decisional block, where price first turns after the inducement is taken, and an extreme block at the origin of the move. Those two are where you do business. Everything of the same colour sitting between them exists to get you in early and stopped out.
So the job isn't finding blocks. Finding blocks is trivial. The job is throwing almost all of them away, and that's what this is built to do.
Where the shortcut version goes wrong
| What the material says | What most tools implement | What ICT Pro does |
|---|---|---|
| An order block is the biggest opposite-body candle that took liquidity and left an imbalance | "The last opposite candle before the move" | Both conditions checked, or it isn't a block |
| A fair value gap only counts after a run on liquidity | Every three-candle gap | Requires a break of the preceding window's extreme first |
| Breaker and mitigation differ by one point: the middle pullback makes a lower low, or it doesn't | Used as synonyms, or only breakers exist | Four-point sequence, two separate labels |
| An inversion FVG needs the original gap to have sat on the wrong side of equilibrium | Any gap that gets closed through | Equilibrium condition enforced |
| A volume imbalance is the gap from one candle's close to the next one's open, wicks overlapping | Measured off the candle bodies | Close to open, and the two ranges must overlap |
That last row is the one people get wrong most often, and it matters more than it sounds. Measure from the body extreme instead of the close and you miss every imbalance where the earlier candle closed against its own body, and you understate the zone in the cases you do catch.
How a zone earns its way onto the chart
Every candidate gets scored out of ten, and the score is visible on the box so you can argue with it.
It starts from what kind of zone it is: a unicorn, which is a fair value gap sitting inside a breaker, opens at 5; a breaker at 4; an order block or propulsion block at 3; rejection, mitigation, balanced price range, inversion FVG and single-candle blocks at 2; a bare fair value gap at 1.
Then four adjustments:
- +2 if it came from a higher timeframe than your chart
- +2 if there's unswept liquidity resting on the far side of it, close enough to be the reason price would go there
- +1 if price hasn't already eaten into it
- +1 if it sits on the correct half of the dealing range for its direction
And one more that almost nothing else does: for each pool of liquidity, only the single nearest zone gets the bonus. Ten blocks stacked near one previous-day low can't all claim it, because only one is what price is actually reaching for.
Anything under 5 is hidden by default.
Decisional, Extreme, and the ones in between
Of what survives, the nearest unmitigated zone on the correct side of price is tagged DEC and the furthest is tagged EXT. Same-direction zones between them are tagged as traps and hidden unless you switch them on.
I'll be straight about the limit: that pick is geometric. It takes the nearest and furthest unmitigated zone on the right side of price, rather than tracing the inducement leg to find which block price actually turned from. On a clean impulse the two agree. On a messy range they don't, and you should trust your own read over the tag.
The panel
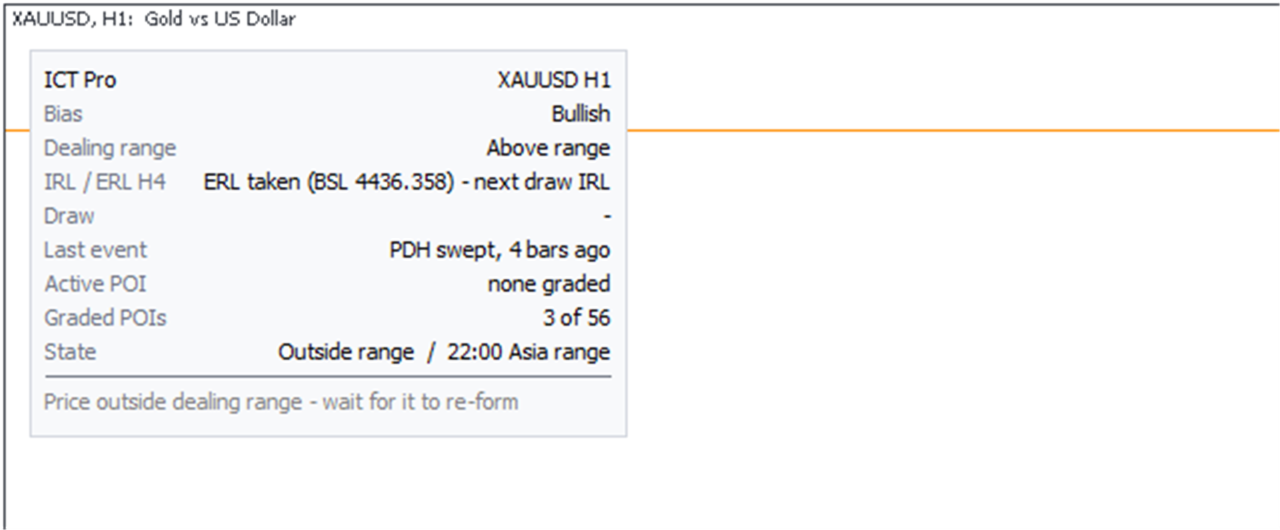
ICT Pro         XAUUSD H1
Bias            Bullish
Dealing range   Discount 14%
IRL / ERL H4    IRL tapped (FVG 4397.670) - next draw ERL
Draw            ASIA 4436.358  (3.3 ATR)
Last event      ASIA swept, 8 bars ago
Active POI      Decisional FVG 4273.847 (3/10)
Graded POIs     2 of 54
State           POI ahead  /  08:00 New York killzone
──────────────────────────────────────────────────────
ASIA swept - buy at Decisional FVG 4273.847 (3/10), then
BUY on confirmation
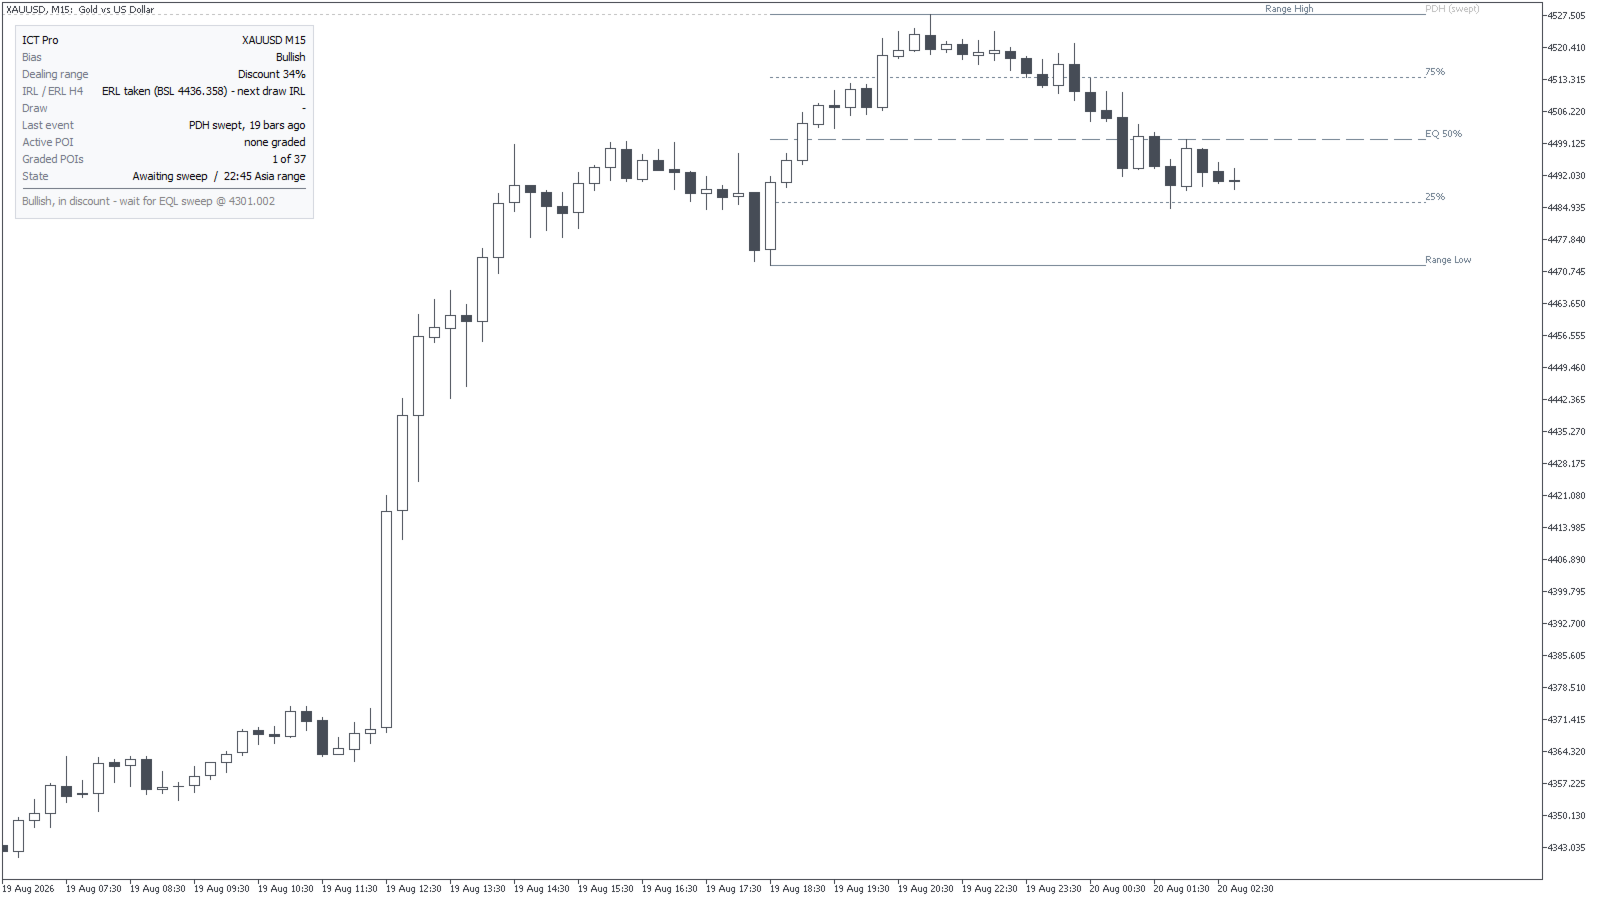
The bottom line walks the sequence the material insists on: bias, then location in the range, then the liquidity grab, then the clock, then the zone. It reports whichever step is still missing rather than jumping to an entry, and it only takes colour once all of them are met.
Graded POIs 2 of 54 is the number I'd look at first. It tells you how hard the filter is working, and when it reads 0 of 41 you know to leave the chart alone.
What it finds
Order blocks, fair value gaps, breakers, mitigation blocks, rejection blocks, propulsion blocks, inversion FVGs, balanced price ranges, unicorns, single-candle blocks, volume imbalances. Eleven types, each switchable, each with the conditions above enforced rather than assumed.
Zones fade as price mitigates them and drop off once half has been traded through.
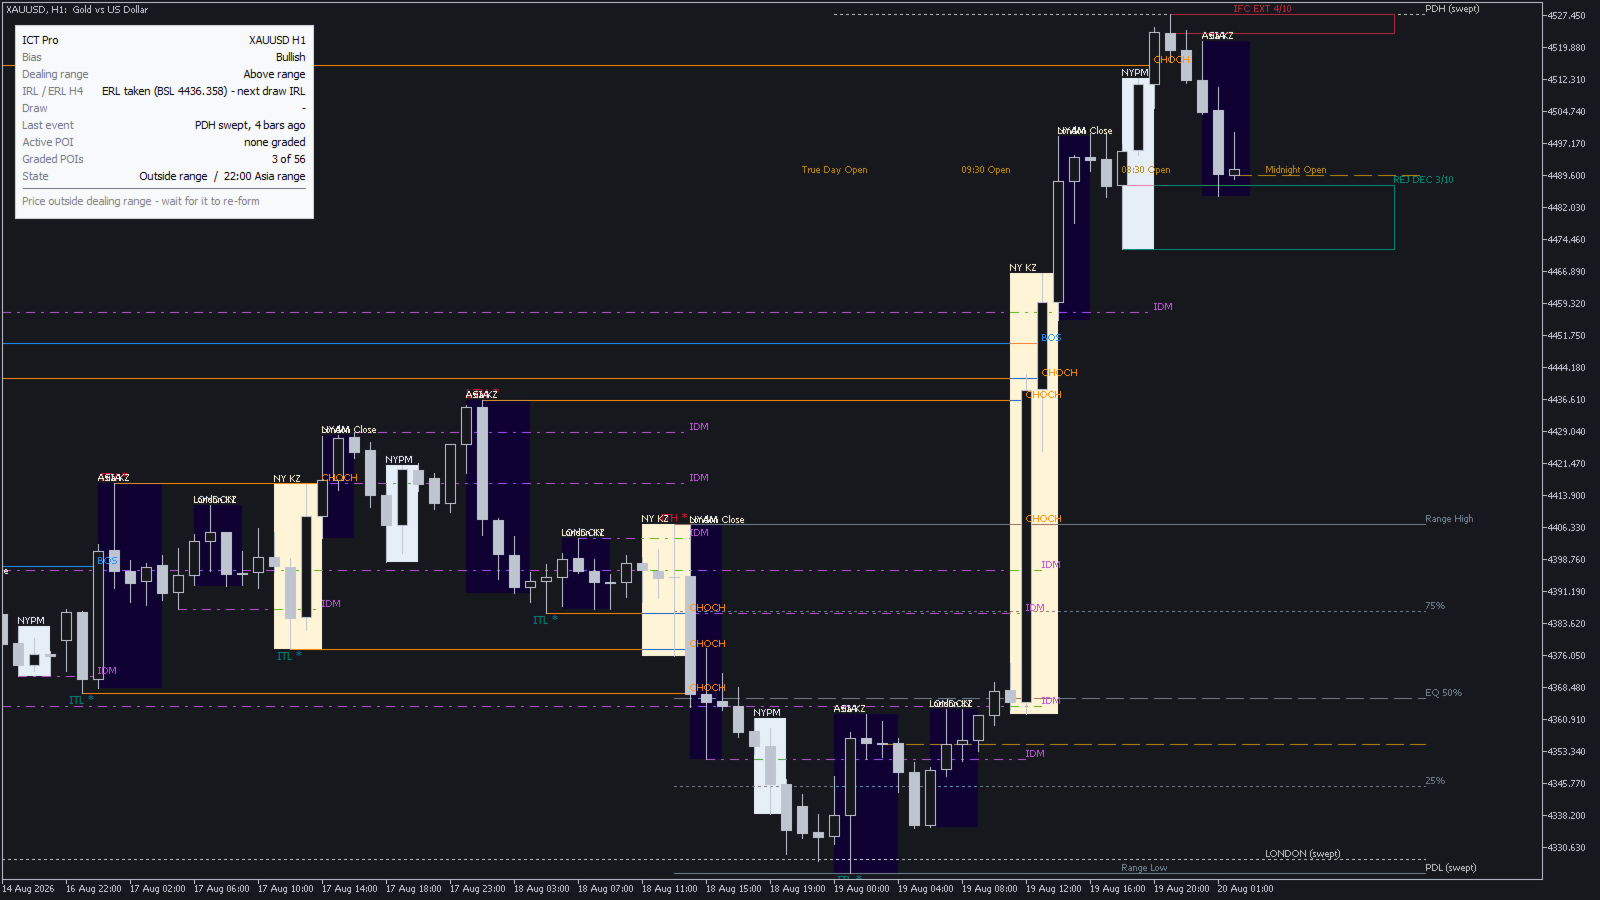
Everything in ICT Core is in here too, unchanged: the three-tier structure grading, body-close BOS and CHOCH kept separate from wick-only sweeps, inducement, liquidity pools in three states, the internal-versus-external liquidity line, sessions, killzones and opening prices in New York time with daylight saving handled. Those parts aren't a cut-down preview of anything. They're the same engine, and for a lot of traders they're the part that does the work.
Four alerts, at most one per bar: a pool swept, a structure break, price tapping a graded zone, and a killzone opening.
How to trade with it
Wait for Graded POIs to be non-zero and the plan line to name a zone. Check the liquidity that gives the zone its reason to exist is still unswept. Let price come to it. Then drop to your execution chart and take your own confirmation.
The plan line ends in "on confirmation" every time, and that isn't hedging. It knows your bias, where you sit in the range, which pool went, the time, and where the zone is. It can't see the market structure shift on your 1-minute chart, and saying BUY without that qualifier would be selling you something it doesn't measure.
What this version can't do
There are long stretches where nothing is graded and the panel just says none graded. That's the filter working, but if you want a tool that always has an opinion, this will frustrate you. And when there is a graded zone it's often far enough from price to sit off the bottom of your screen, so expect some scrolling.
The score is a ranking, not a probability. A 9 out of 10 is not "90% likely to hold" and I won't pretend otherwise. It sorts zones against each other so you start with the strongest one on the chart, and that is the whole of what it does. You won't find a win rate table in this listing either.
Honestly, the thing that unsettled me most was finding I'd had bullish and bearish fair value gaps the wrong way round. It compiles either way. It draws boxes either way. Every box points at the wrong side of the market and nothing complains. I only caught it by checking a gap by hand against the candles. That's the reason I don't trust the free ones any more, and the reason each condition above is spelled out here instead of just listed.
Questions you'll have
Do I need ICT Core as well? No, Pro has all of it inside. The two aren't really competing though. Core is the whole tool if you read structure and liquidity and then choose your own zone by eye, which is how plenty of people trade this and it works fine. What you're paying the difference for here is having that choice made and argued for. If Core already covers how you work, buy Core and keep the money.
Higher timeframe zones on a lower chart? Yes, that's what the POI timeframe input is for. H4 zones on an M15 chart is the usual setup, and it scores those zones higher.
Why is my chart nearly empty? Because the score filter is at 5 and traps are hidden. Drop the filter to 3 and switch traps on if you'd rather see the workings.
M1? You can, but I wouldn't. Below M5 the intermediate structure points churn too fast to give you a bias, and the zones follow the bias.
MT4? There's a build for it. Same engine, same inputs, sold separately because MetaQuotes keeps the two platforms apart.
Support
Message me on MQL5 with a screenshot showing the panel, plus symbol and timeframe. That's usually enough for me to work out what you're seeing. Updates are free.
Analysis tool. It places no trades and makes no profitability claim. Past price behaviour is not a guide to future price behaviour.