Auction Delta Profiler
- Göstergeler
- Sürüm: 1.0
- Etkinleştirmeler: 7

OrderFlow Matrix PRO for MT5
Institutional Volume Profiler, Bid/Ask Footprint Ladder & Predictive Auction Engine
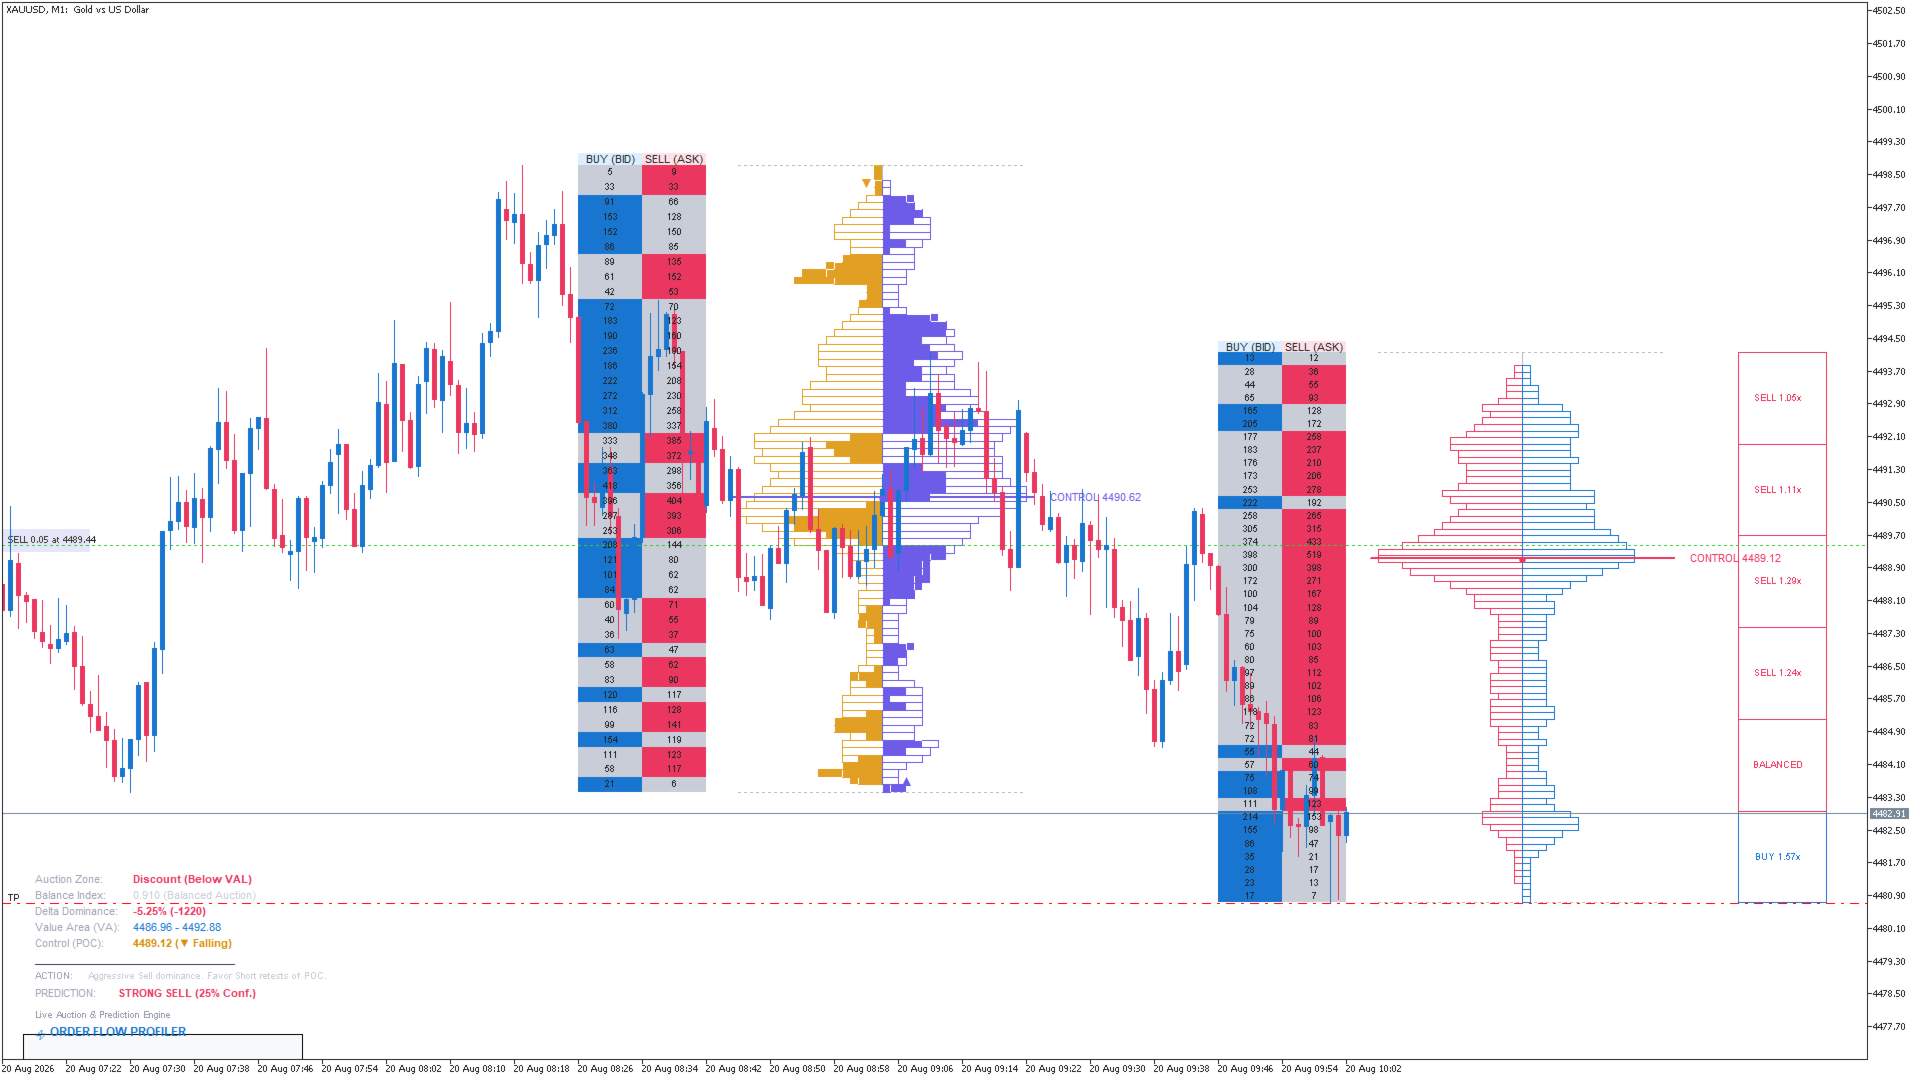
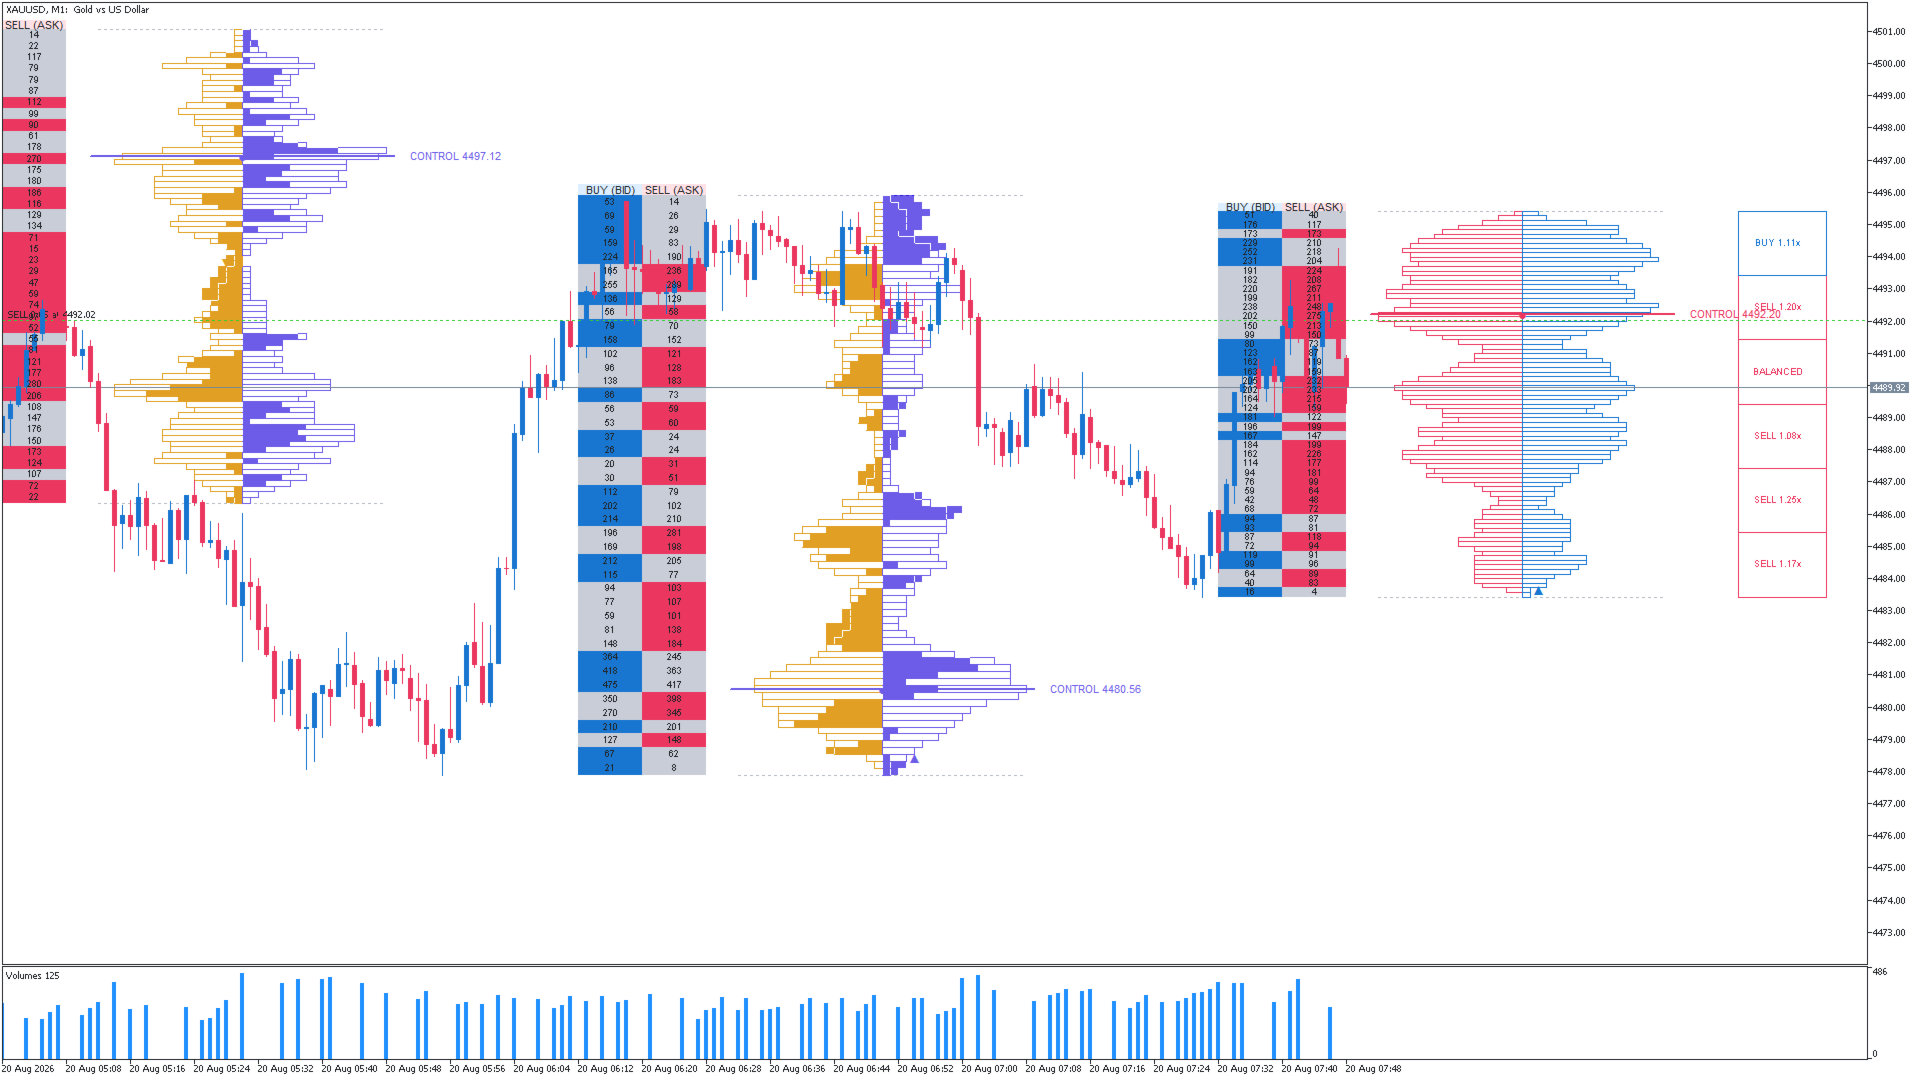
OrderFlow Matrix PRO brings true institutional-grade Order Flow analysis and Volume Profiling directly to MetaTrader 5. By decomposing each candlestick’s tick volume into precise Bid (Sell) and Ask (Buy) participation, the indicator reconstructs the internal auction mechanics at every price level.
Unlike traditional volume indicators that only show total volume per bar, OrderFlow Matrix PRO visualizes where buyers and sellers fought, who won control, and where aggressive institutional order imbalances were absorbed.
🌟 Key Features
-
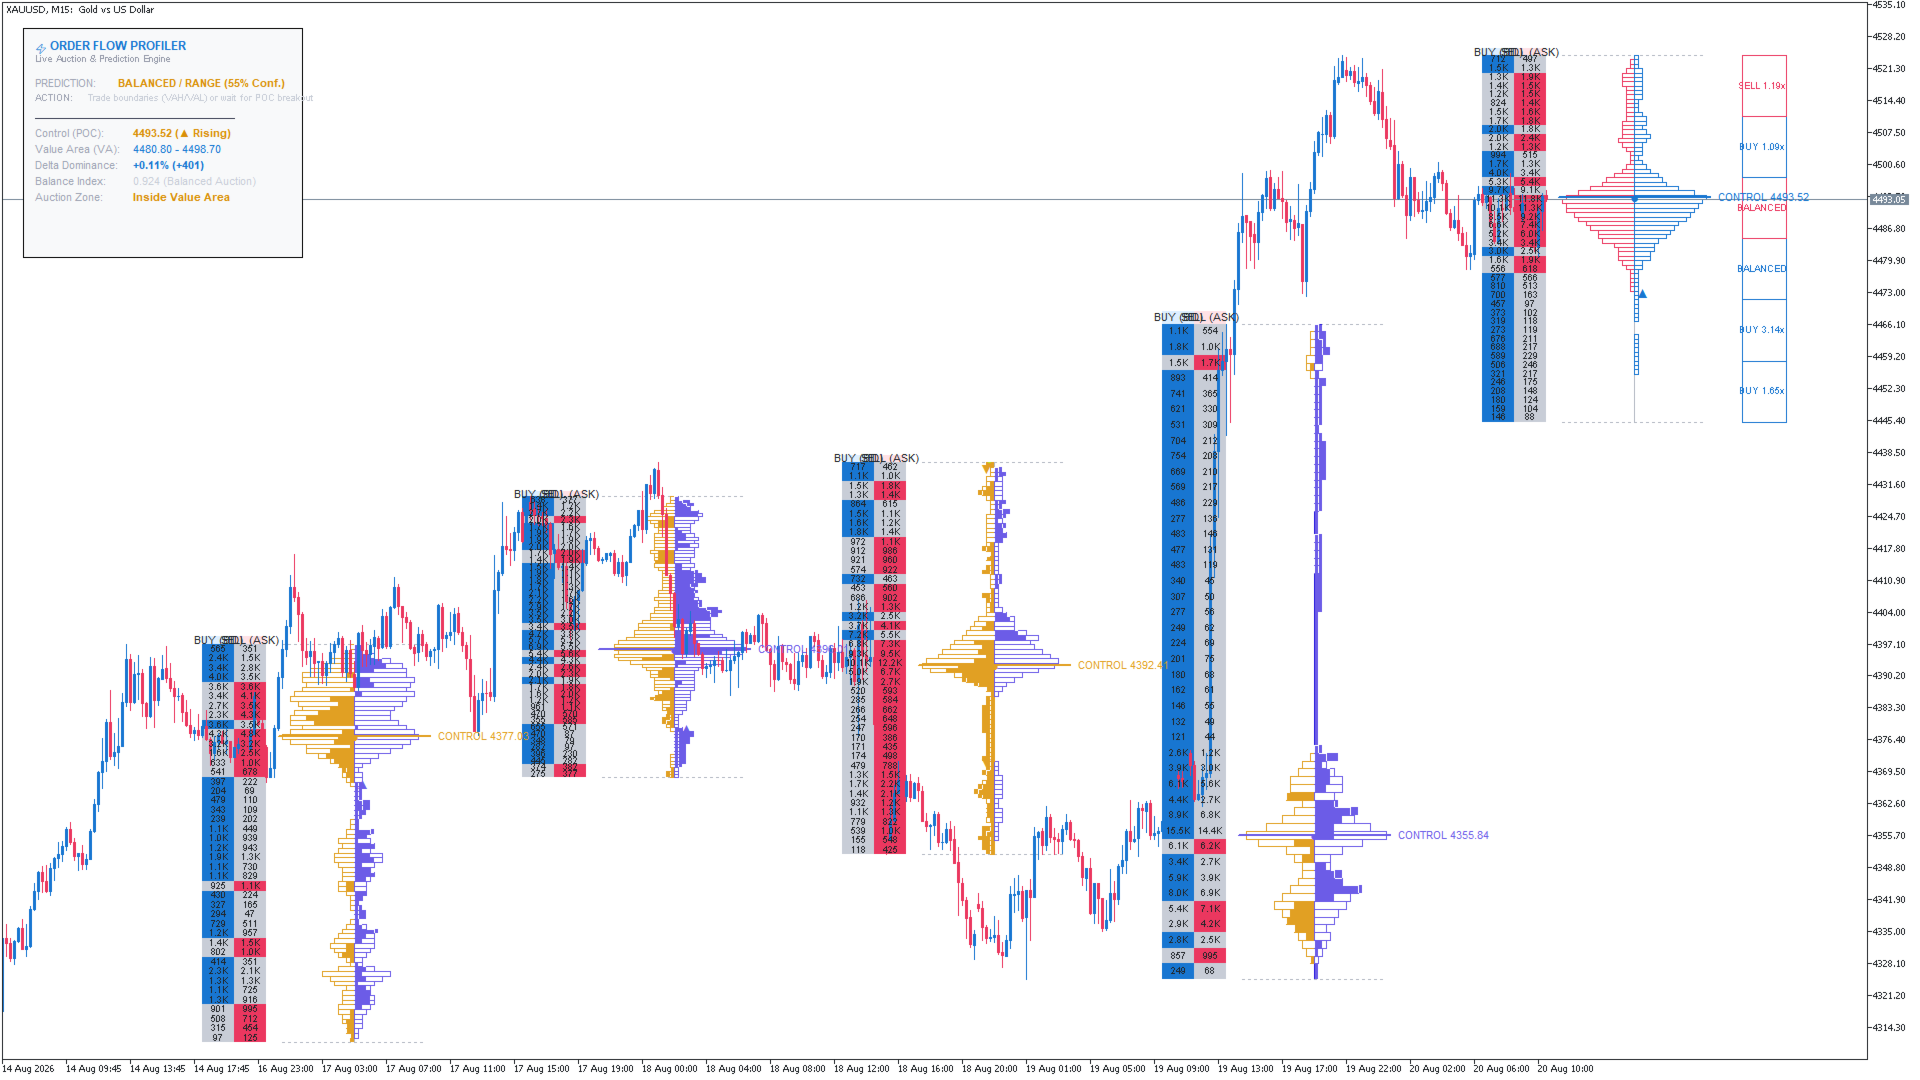
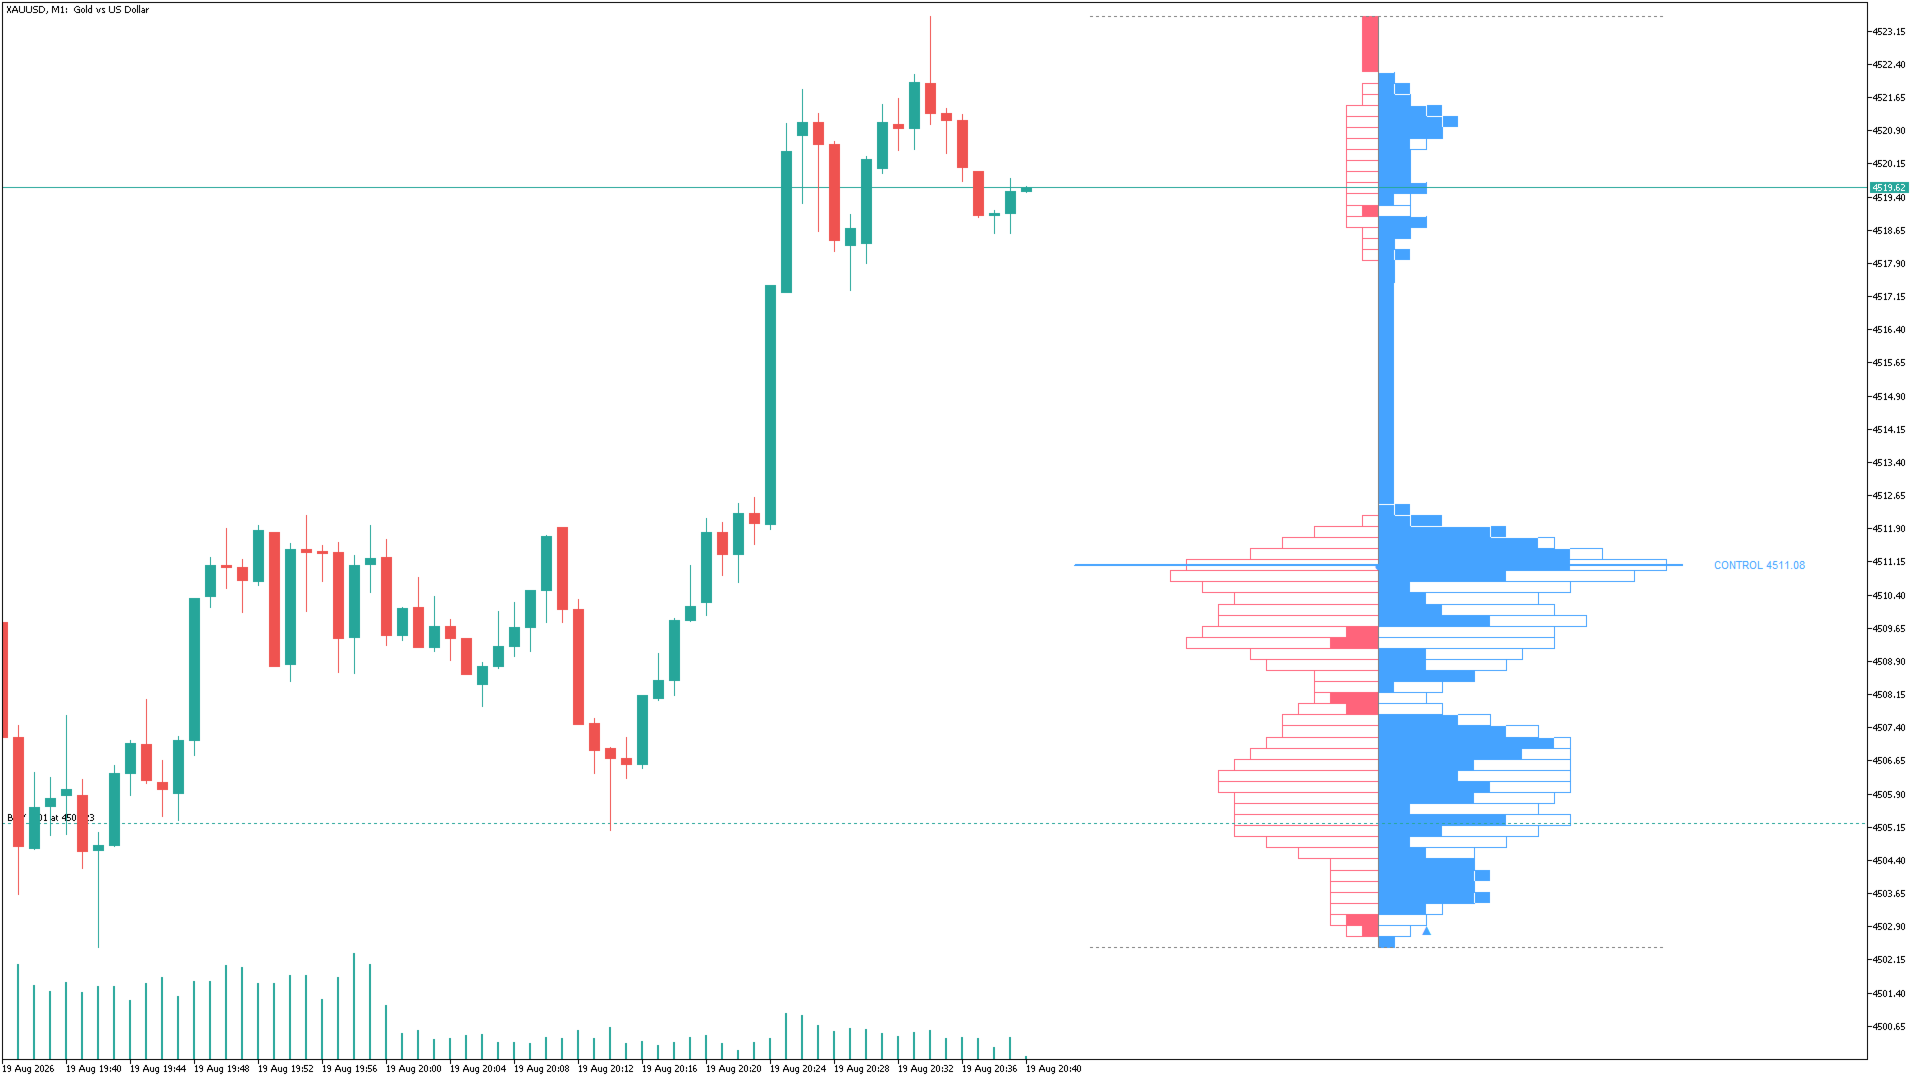
Two-Sided Order Flow Profile: Real-time visual wings displaying buying volume (right) and selling volume (left) centered around an auction spine.
-
How to Read the Indicator
-
Point of Control (POC) Rejection / Acceptance:
-
The Control Line represents fair value where the most volume was transacted.
-
When price pulls back to the POC and delta shows buyer dominance, it signals institutional support / absorption.
-
-
Diagonal Pressure Flags (▲ / ▼):
-
Highlights aggressive imbalances where one side transacted 300%+ (customizable) more volume than the opposing neighboring row.
-
-
Auction Migration (Trend Shift):
-
Rising Historical POCs + Positive Delta = Healthy, strong uptrend.
-
Falling Historical POCs + Negative Delta = Healthy, strong downtrend.
-
-
Footprint Numeric Matrix:
-
Look for price levels where the BUY or SELL numbers are substantially higher than surrounding rows to spot institutional breakout or absorption points.
-
Dual-Column Footprint Matrix: Live numeric Bid x Ask ladder showing exact buyer and seller tick volumes for every individual price cell, complete with BUY (BID) and SELL (ASK) column headers.
-
-
How to Read the Indicator
-
Point of Control (POC) Rejection / Acceptance:
-
The Control Line represents fair value where the most volume was transacted.
-
When price pulls back to the POC and delta shows buyer dominance, it signals institutional support / absorption.
-
-
Diagonal Pressure Flags (▲ / ▼):
-
Highlights aggressive imbalances where one side transacted 300%+ (customizable) more volume than the opposing neighboring row.
-
-
Auction Migration (Trend Shift):
-
Rising Historical POCs + Positive Delta = Healthy, strong uptrend.
-
Falling Historical POCs + Negative Delta = Healthy, strong downtrend.
-
-
Footprint Numeric Matrix:
-
Look for price levels where the BUY or SELL numbers are substantially higher than surrounding rows to spot institutional breakout or absorption points.
-
-