Af system directional
- Göstergeler
-
Alexandre Favero
 My Journey in the Financial Market
I began my journey in the financial market in 2006, at a time when access to complete and well-structured educational materials on the subject was scarce. Faced with this gap, my learning came largely through self-directed study and hands-on experience. - Sürüm: 1.0
- Etkinleştirmeler: 5
Volatility and Financial Volume Indicator
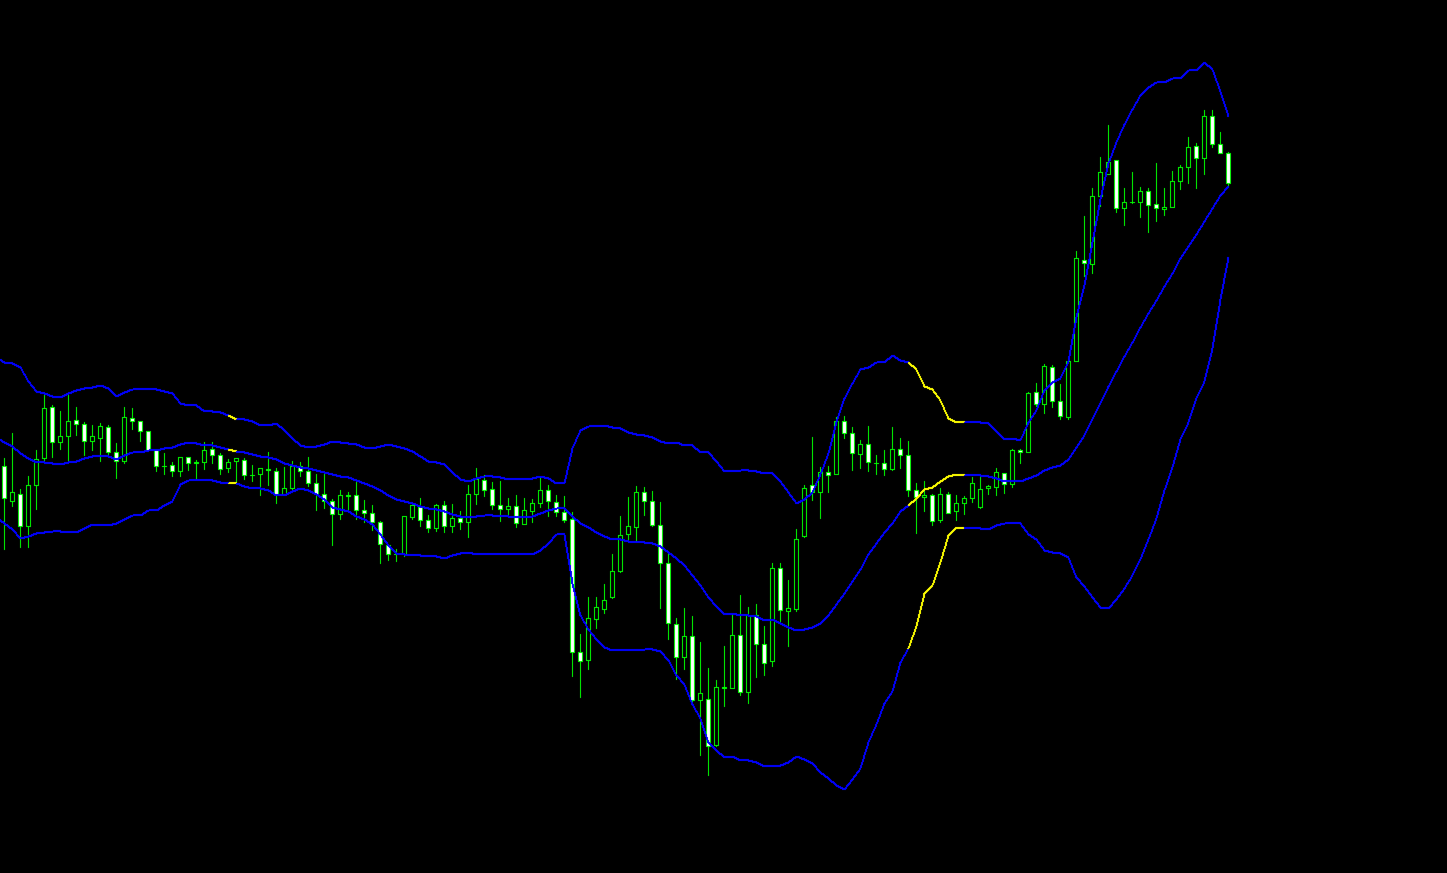
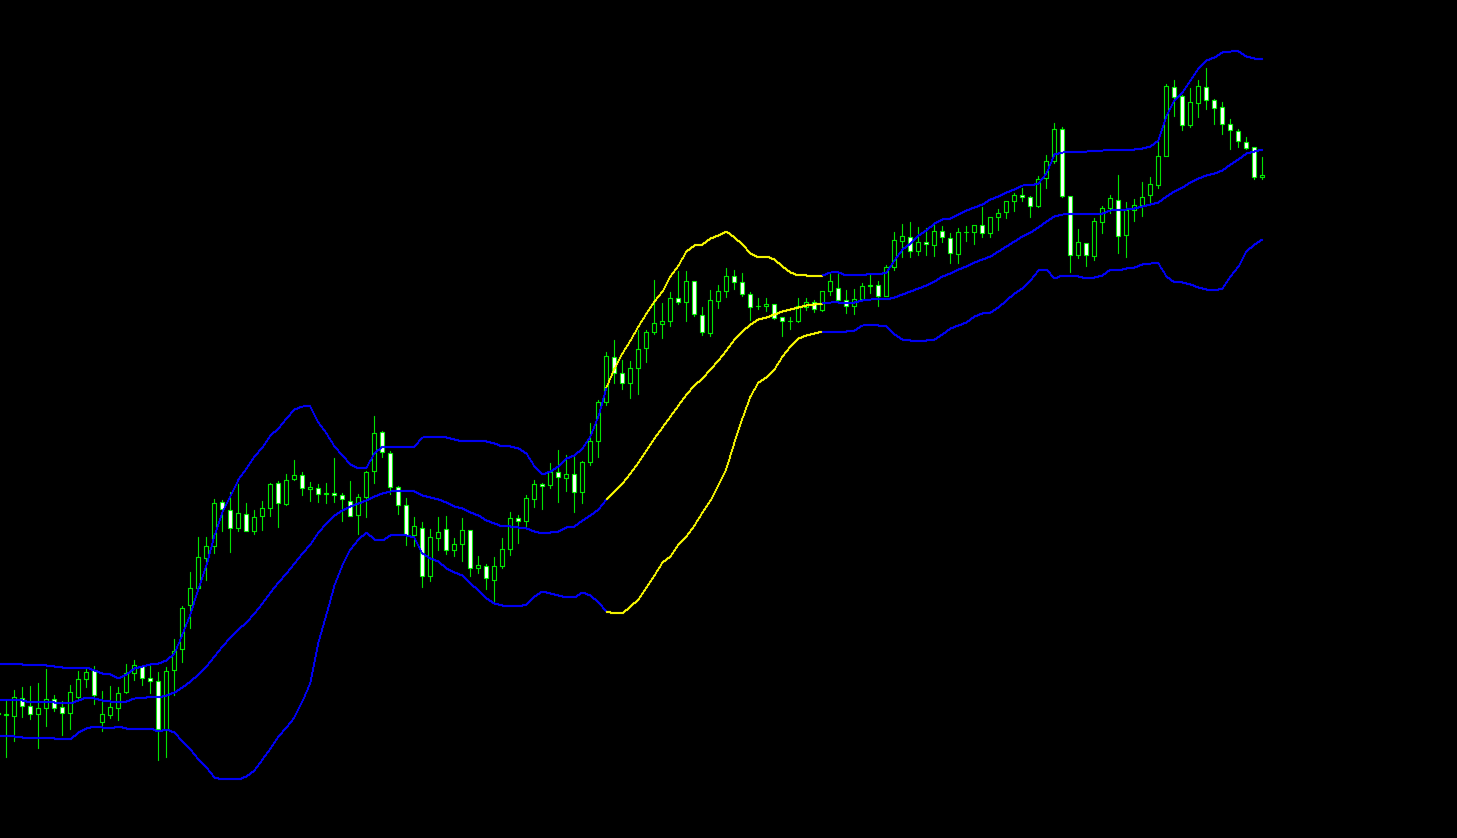
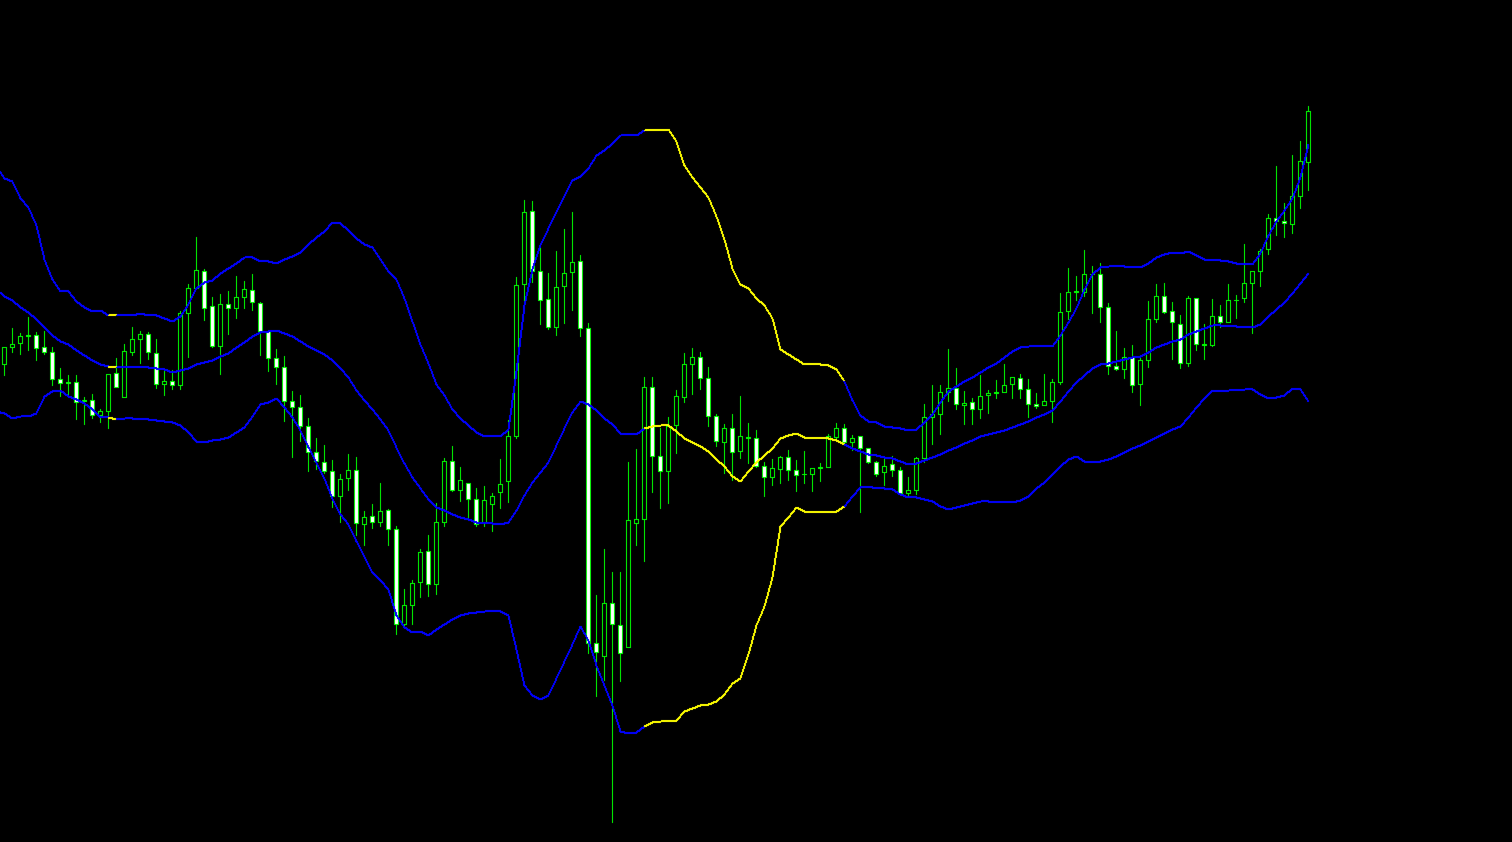
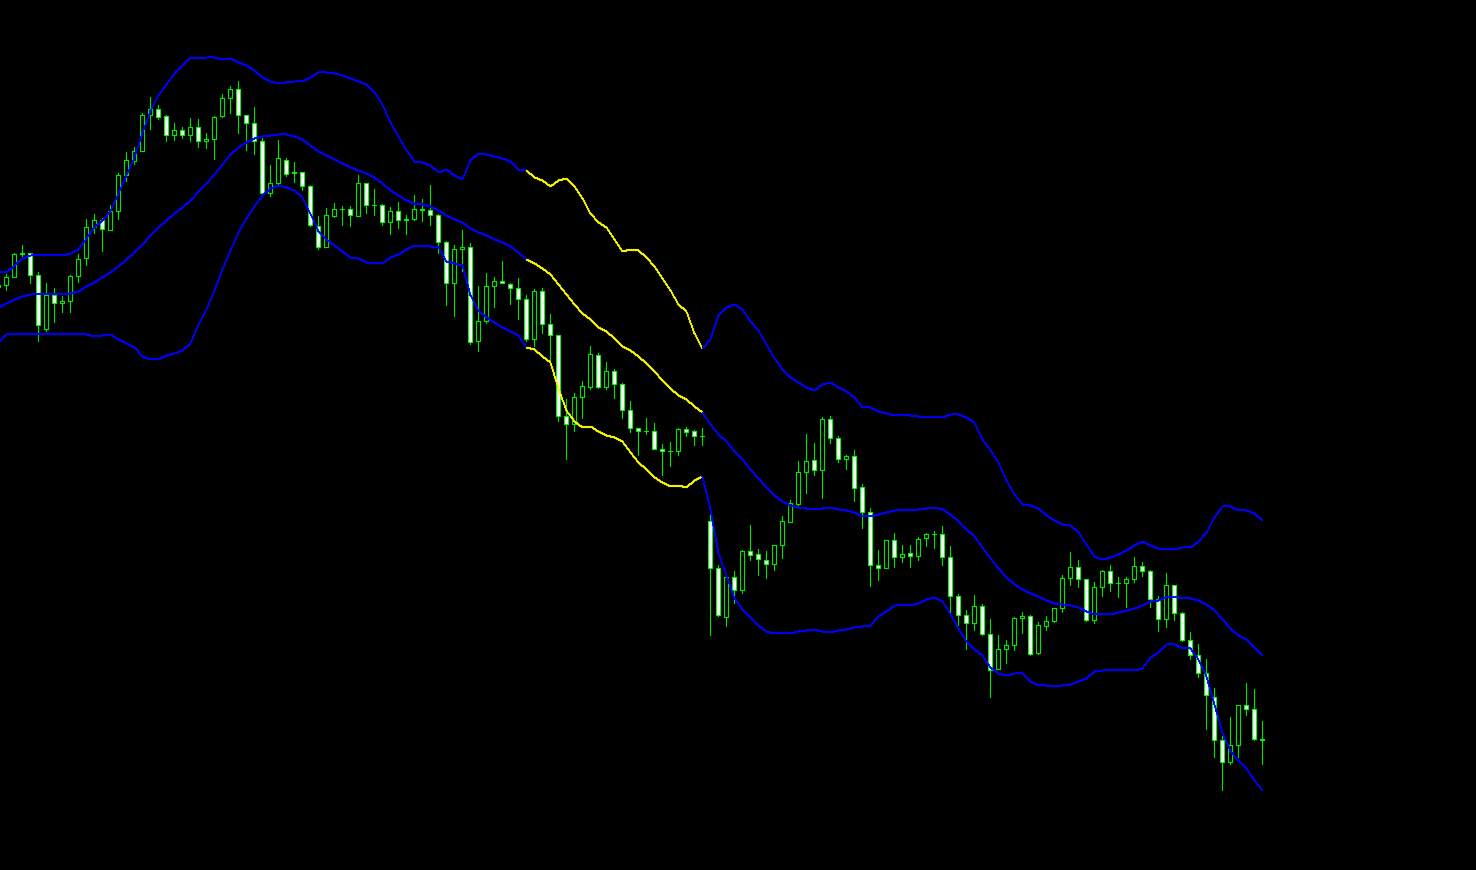
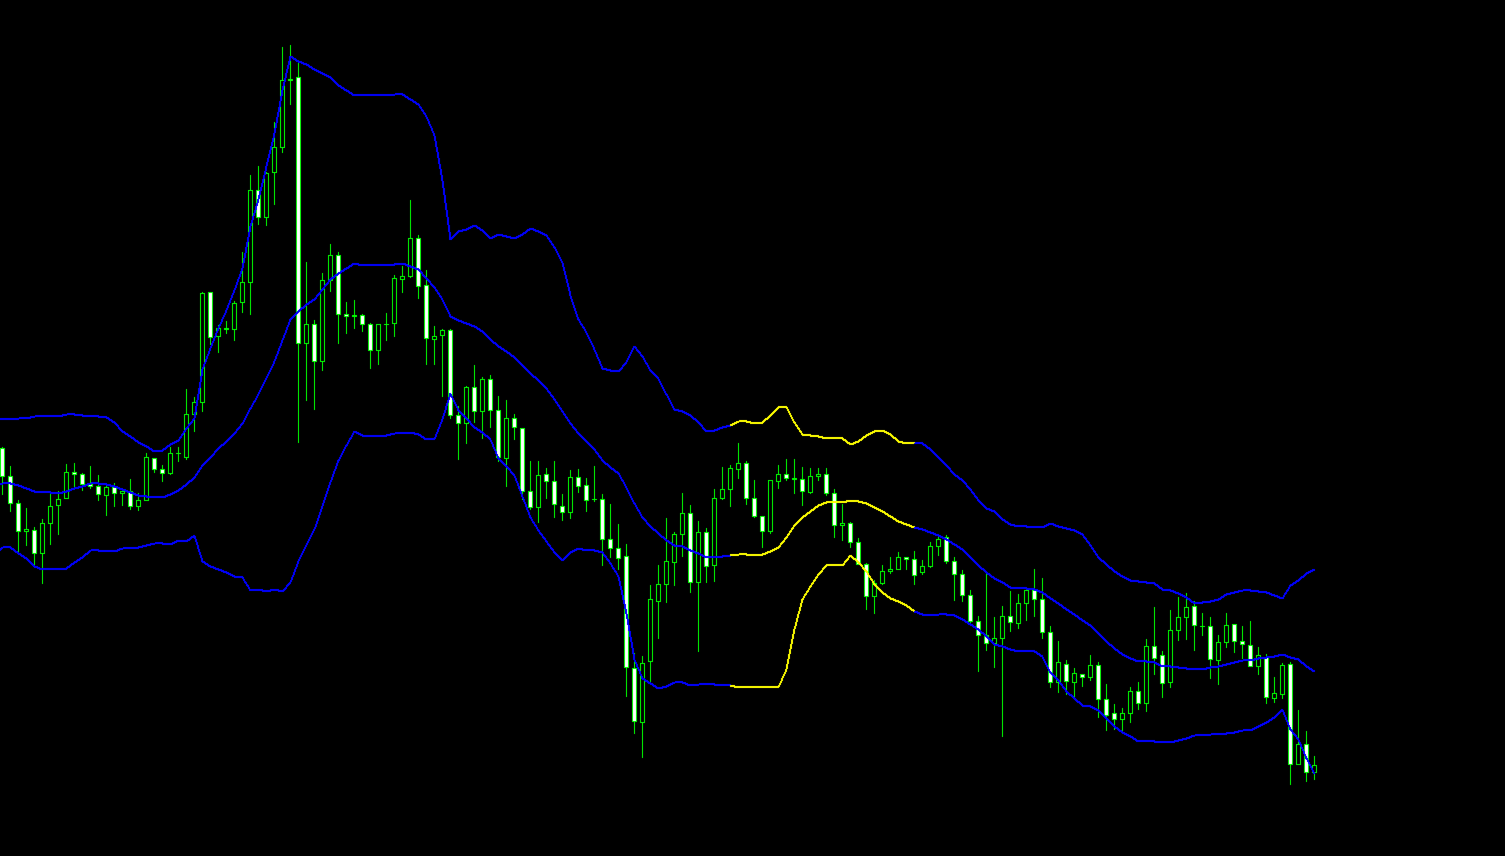
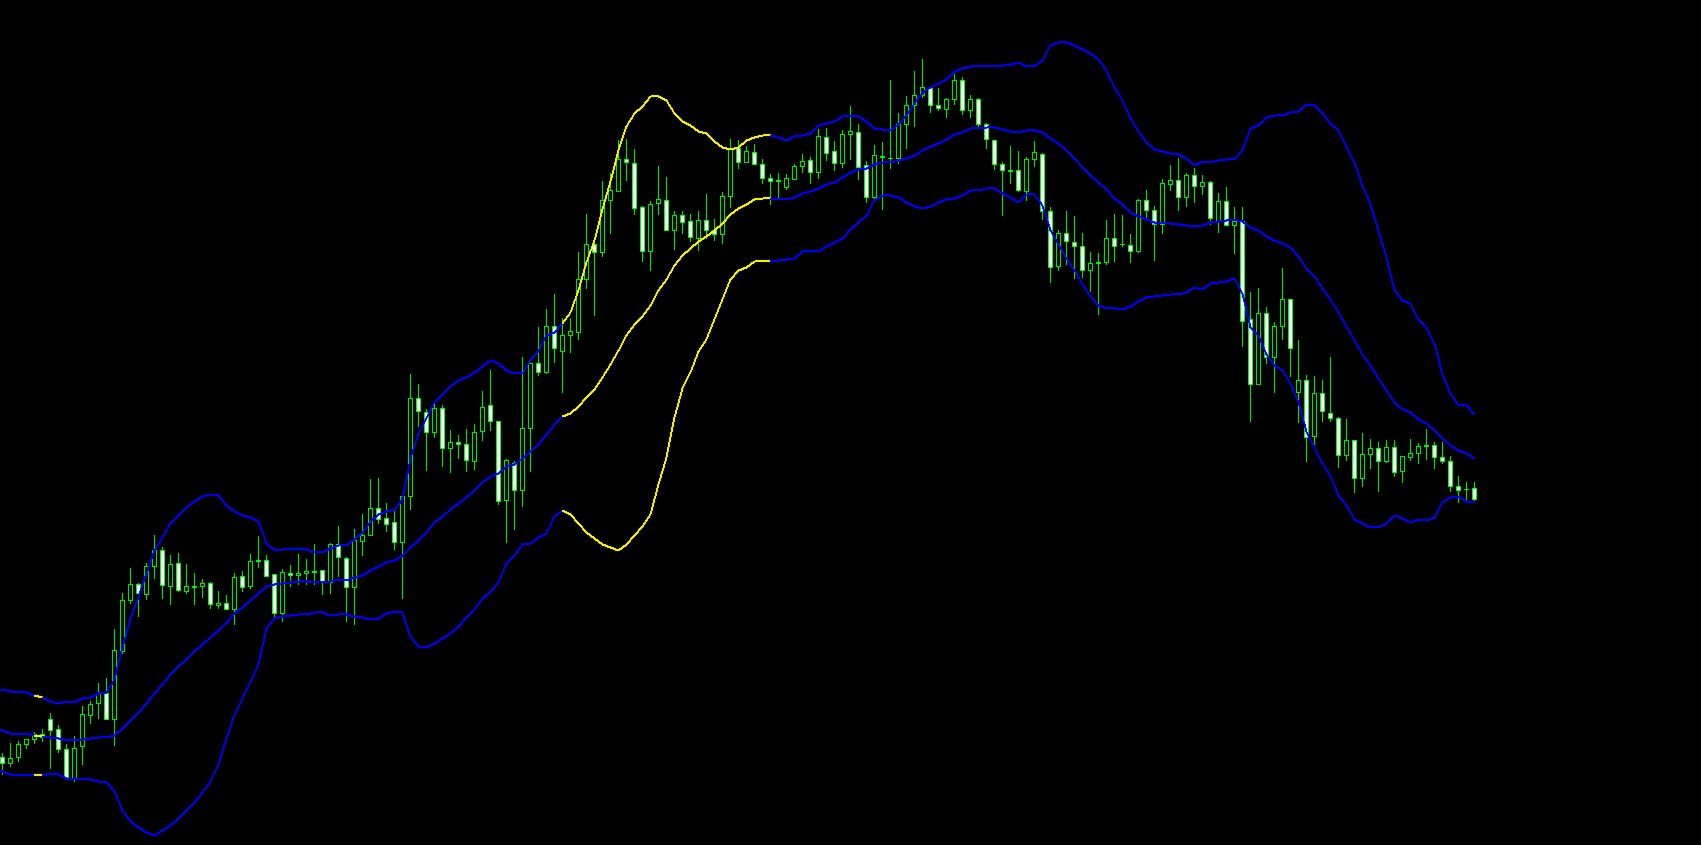
This indicator was developed to assist in analyzing price volatility, identifying periods of band contraction and expansion, together with color changes associated with financial volume behavior.
The system highlights regions where a significant increase in volume occurs, allowing traders to observe potential areas of interest for trend continuation or trend reversal studies.
The analysis is primarily focused on the M15 and M5 timeframes, allowing users to monitor changes in volatility and volume with greater precision during market movements.
Color Change
When the indicator changes from blue to yellow, it means that, during the analyzed period, there was a significant increase in financial volume compared with the previous market behavior.
This color change should be interpreted as additional information about market behavior, rather than as an automatic buy or sell signal.
Indicator Usage
The indicator should be used as a study and analysis tool, particularly in regions where relevant changes in volatility and volume are identified.
Users are encouraged to combine this information with their own trading methods and systems, using technical analysis, price structure, support and resistance levels, or other confirmation criteria.
Important: The indicator should not be used independently as an entry trigger. The color changes and highlighted regions are intended to serve as monitoring areas, allowing traders to conduct their own analysis and evaluate potential scenarios of trend continuation or trend reversal.
The primary objective is to provide an additional confluence of information, helping users better understand volatility and volume behavior in relevant market areas.